Key Takeaways
- Bitcoin is trading at $38,000 in Nigeria, a premium of 66%
- The Nigerian central bank has implemented ATM withdrawal limits of $43 per day in push towards a cashless society for Africa’s biggest economy
- The central bank also announced a rival card system to Visa and Mastercard, in a bid to reduce fees
- Some are excited at the push towards Bitcoin, but it is important to remember Bitcoin’s failings here, too, writes our Analyst Dan Ashmore
- Internet penetration rate is only 35% in Nigeria, while Bitcoin’s volatility means assigning it any kind of “hedge” role would be idealistic
One Bitcoin is trading for north of $38,000 in Nigeria.
The price can be seen on the Nigerian exchange NairaEx, where it is quoted at 17.8 million Naira. That equates to $38,600, despite Bitcoin trading at $23,200 across the market, meaning it is trading for a 66% premium in Nigeria.
Nigeria shifting to a cashless society
The premium comes amid a time when the Nigerian central bank is making a big push towards a cashless society.
Limits on ATM withdrawals have been implemented, with citizens limited to withdrawing 20,000 Naira per day ($43 at current rates) and 100,000 per week ($217).
Nigeria’s controversial money management
The central bank also extended the deadline this weekend for citizens to exchange old banks notes from Jan 24th to Feb 10th. Higher denomination naira notes had been designed with the goal of reducing counterfeiting and the use of cash in society.
The move was widely criticised, with analysts pointing towards one very obvious question: how does issuing new bank notes reduce the use of cash? Nigeria is Africa’s largest economy and remains heavily dependent on cash.
Aside from big-picture questions, Nigerians decried that they had not been given enough time to make the switch to the new notes. Tales of queues at banks were plenty, while many of Nigeria’s 210 million people live in rural areas and have no access to banks, where they are required to swap old notes for new.
The government had announced a scheme only one week before the deadline to help those in such rural areas via banking representatives, but controversy remained that there was not enough time. There were also reports of shortages of new notes, with commercial lenders only getting their hands on the new notes less than a month before the deadline.
“I don’t have good news for those who feel we should shift the deadline; my apologies”, central bank governor Godwin Emefiele had said only last Tuesday.
Nonetheless, the central bank eventually caved, with political pressure mounting ahead of the presidential elections in a few weeks’ time.
Could Bitcoin help Nigeria?
The chaotic developments are just the latest example of how poorly governments around the world often manage money. Nigeria has been no stranger to inflation historically, either.
Zooming in on 2022 shows that the last year has seen the currency devalue at a significantly higher rate than most developed economies worldwide.
Against this backdrop, the central bank also announced the launch of a domestic card scheme last week. The goal is to create competition for Visa and Mastercard, again pushing Nigeria towards a cashless society while saving the country on foreign transaction fees.
The goal may be admirable, but the realities of the situation make the push difficult. As mentioned above, this is a society still hugely dependent on cash, with a massive chunk of the population shut out from banking.
Some Bitcoiners are pointing towards the crypto as a solution for Nigerians. To me, this feels a bit idealistic. While there is no doubt that Bitcoin is extremely accessible compared to banking in developed countries, it does still require an Internet connection. And in Nigeria, that is not as readily available as desired.
While the fundamentals of Bitcoin certainly make it interesting in the context of a currency under severe controls and with a historical flirtation with inflation, let us not gloss over the fact that Bitcoin has issues of its own.
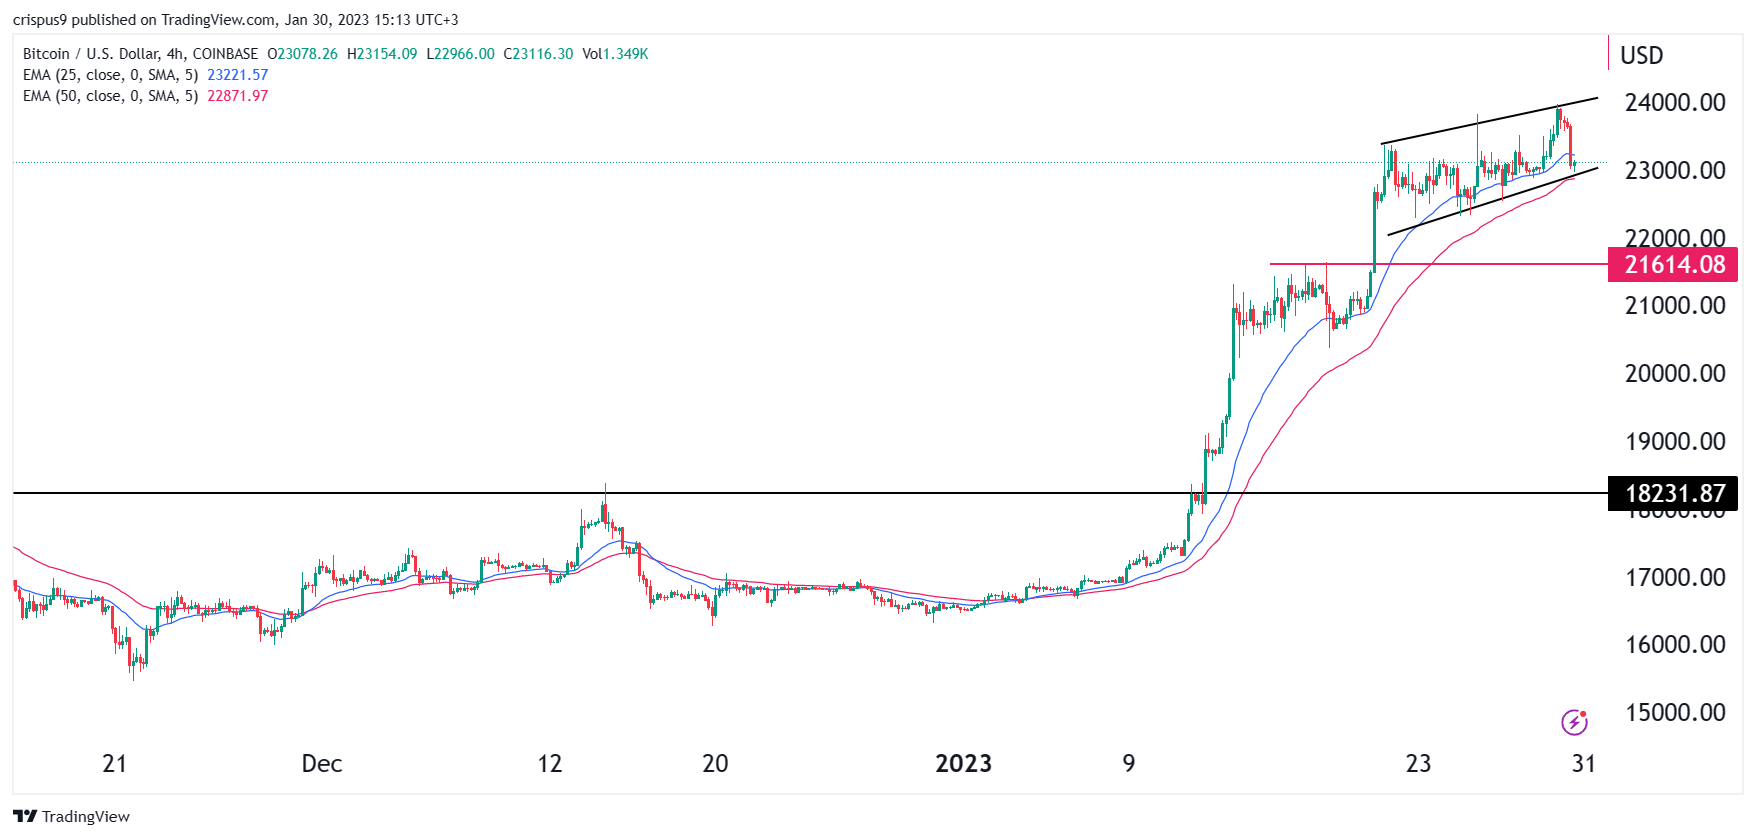
One Bitcoin was worth $68,000 a little over a year ago. Then it was $16,000 towards the end of last year. Now it is $23,200. For those living in rural Nigeria, this volatility would be back-breaking, and quite simply makes it totally unfeasible right now, despite the clamour coming out of Bitcoin enthusiasts.
I do think – and have written about this extensively previously – that Bitcoin has really intriguing attributes with regard to developing economies and collapsing currencies, and what could happen if the asset continues to mature.
However, in the year 2023, it is an extreme risk-on asset that couldn’t be less suitable to store one’s wealth in. The Naira may be feeling inflation of 20%+ right now, but Bitcoin can slice 50% of its price in a day.
Why is the Bitcoin premium so high?
The way I like to look upon this is like the Big Mac index with purchasing power parity. A fun metric to gauge how expensive a country is, the Big Mac Index compares the price of the universal good that is McDonald’s most famous burger from country to country.
In a similar way, looking at the price that Bitcoin trades at can provide hints as to how well a nation’s money is functioning. The 66% premium in Nigeria clearly highlights that there is some real turmoil in the economy. Citizens willing to pay such an enormous markup to get their cash out of Naira is startling.
Then again, there could be other factors in play. The Kimichi premium famously persisted for many years, describing the constant premium that could be seen in the Korean bitcoin market. This was primarily a result of regulatory issues surrounding the always-controversial Bitcoin.
If nothing else, this tale out of Nigeria shows quite how fragile a lot of the world is with regard to money. With these episodes happening increasingly regularly, as well as those in Argentina, Lebanon, Turkey and so on, it is no surprise that there is a growing clamour for the mysterious, decentralised asset that we all call Bitcoin.
But claiming Bitcoin is anything close to a solution right now would be naive. As for the future, well who knows?
Share this article
Categories
Tags