America’s largest crypto exchange, Coinbase, announced a long list of tokens it could potentially list in the second quarter of 2022 in an effort to increase transparency.
An April 12 blog post from the exchange includes a list of tokens under consideration, but notes that other tokens may be under consideration but not specifically mentioned. Among those on their radar are 45 ERC-20 tokens on the Ethereum (ETH) network, and five SPL tokens on the Solana (SOL) network.
Some of the tokens with a relatively large market cap are Binance USD (BUSD), which is the third-largest stablecoin on the market, and one of the largest DAO projects BitDAO (BIT) which boats a market cap of just over $1 billion at the time of writing according to CoinGecko data.
The exchange stated that its new approach toward token listings will also provide “as much information symmetry as possible.” Information symmetry promotes efficiency and fairness within a market.
It also reduces the chances for a pump and dump scenario on listing day as the retail trading frenzy can be mitigated by advanced knowledge of a listing. While it is far more common on other centralized and decentralized exchanges, Coinbase has had its share of such price action on coins it lists. In 2020, OMG Network (OMG) pumped 200% within 15 minutes of being listed on Coinbase and crashed moments later.
Crypto projects are aware of the attention a Coinbase listing, or even just the potential one can bring. The relatively small decentralized finance (DeFi) data tokenizer Big Data Protocol (BDP) with a $3.3 million market cap according to CoinGecko tweeted delight today that Coinbase was giving it looks at potentially being listed.
However, while the increased transparency may be a boon for investors and projects, the seasoned crypto trader from Twitter account @12yearoldwithcc believes the potential listings are lackluster. The account tweeted today that “Coinbase is in their flop era.”
Other investors may not even have noticed Coinbase’s new transparency efforts yet as many are focused on the exchange’s intention to produce a series of three films about the Bored Ape Yacht Club (BAYC) nonfungible token (NFT) collection.
Some in the crypto community are perplexed by the $10,000 deal Coinbase has offered BAYC holders for the rights to use their ape in the films, with some even warning that they should not accept it.
In all, it has already been a turbulent week for the exchange as it launched trading services in India for the first time on April 8 but abruptly suspended buy order services under pressure from local payment service regulators on April 11.
Protocols in the Cosmos ecosystem have seen a significant amount of growth in 2022 due to the intensifying focus on blockchain interoperability and compatibility with the Ethereum network.
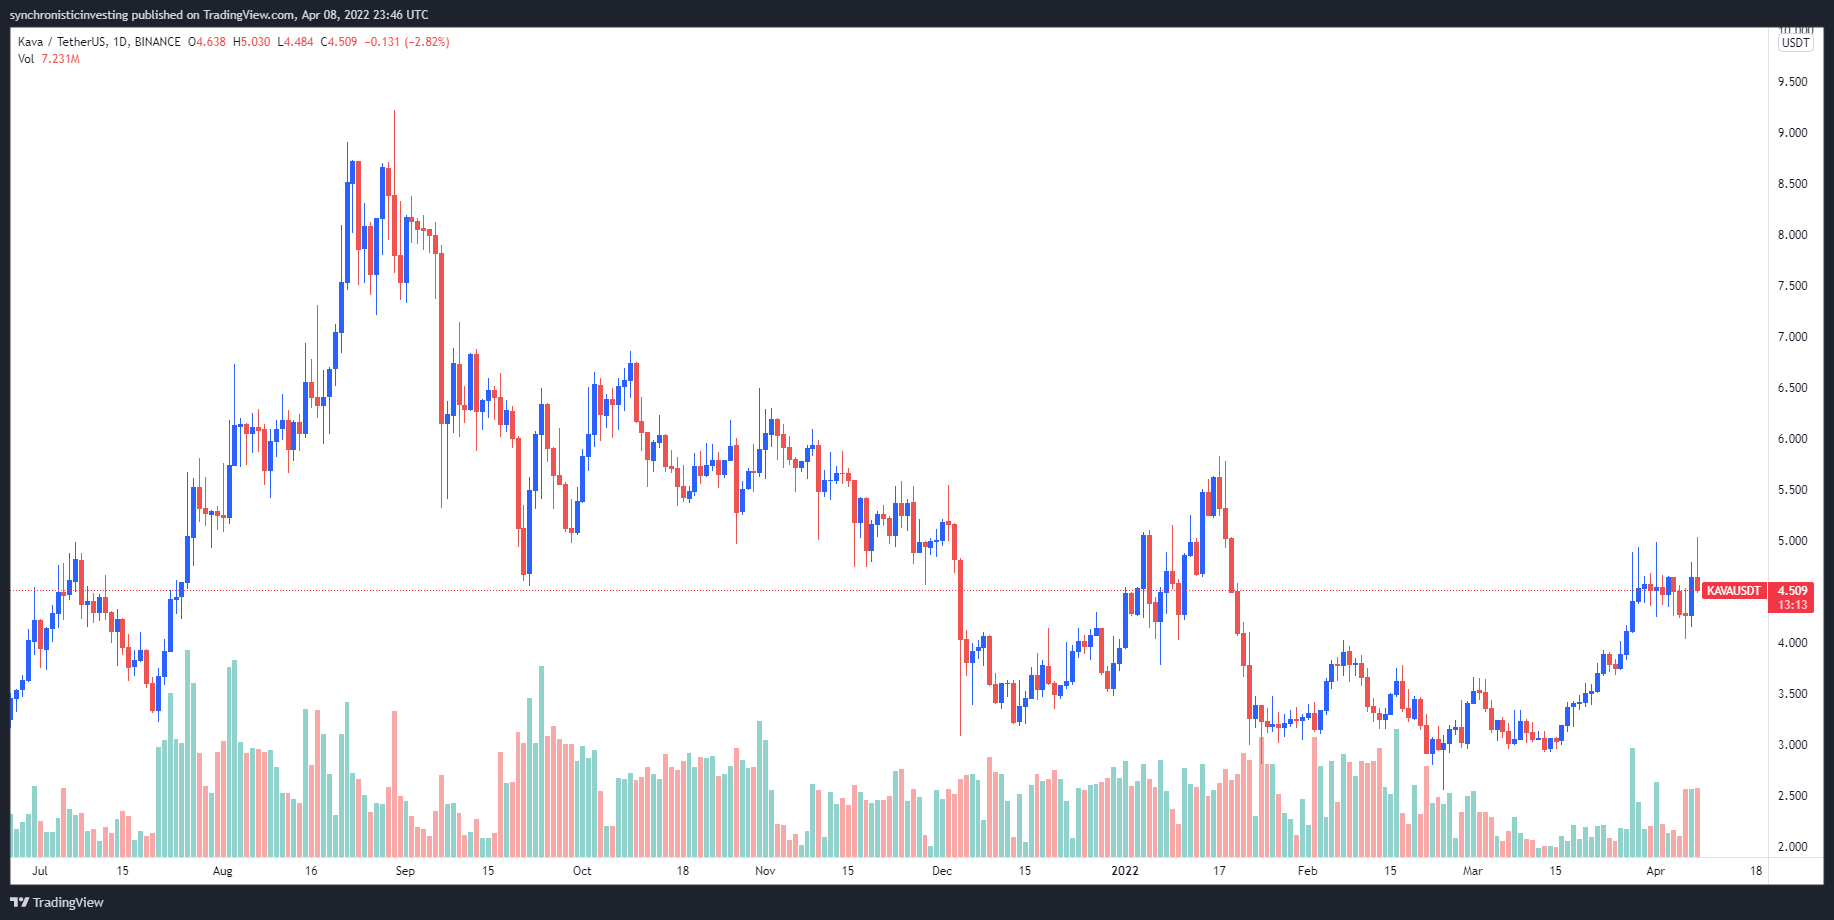
One protocol that has seen a buildup in momentum since the middle of March is Kava, a project that is developing a co-chain architecture for the Cosmos and Ethereum network.
Data from Cointelegraph Markets Pro and TradingView shows that the price of Kava’s native token KAVA has climbed 72.3% after hitting a low of $2.92 on March 13 to establish a daily high of $5.03 on April 8.
KAVA/USDT 1-day chart. Source: TradingView
Three reasons for the increase in price and momentum for KAVA include the Ethereum Co-Chain beta launch, the launch of a $750 million developer incentive program and a series of partnerships and protocol launches that have expanded the size of the Kava ecosystem.
Ethereum Co-chain beta launch
One of the most anticipated developments to come out of the Kava ecosystem was the successful completion of the alpha phase of the Ethereum Co-chain launch.
The Ethereum Co-Chain enables support for Ethereum Virtual Machine (EVM) smart contracts while the Cosmos Co-Chain enables support for the Tendermint consensus engine and the Inter Blockchain Communication Protocol (IBC). A translator module connects the co-chains and allows for seamless interoperability between the networks.
The mainnet launch of the Ethereum Co-Chain is expected to take place on May 10.
Kava launches a $750 million developer incentive program
A second reason for the building strength of KAVA was the March 3 launch of Kava Rise, a $750 million developer incentive program designed to help onboard developers from decentralized finance (DeFi), gaming and nonfungible projects into the Kava community.
Kava Rise is an on-chain incentive mechanism that will distribute 62.5% of all block rewards to developers who are building on Kava’s Ethereum and Cosmos Co-Chains as part of the protocol’s effort to become a builder-owned network. The remaining 37.5% of block rewards will be distributed to stakers.
The incentive program is expected to go live with the Kava 10 upgrade, which will also include the launch of the Cosmos and Ethereum Co-Chains on the Kava mainnet.
A third factor helping to boost the demand for KAVA has been the addition of new partnerships and protocols for the Kava network.
Some of the newest protocols to launch on the Kava co-chain architecture include the NFT marketplace OpenBiSea, the decentralized finance launchpad DexPad and the DeFi piggy bank WePiggy.
Other recent launches on Kava include the multichain DeFi lending protocol ForTube, the Ruby Protocol that brings the first algorithmic stablecoin to the Kava Ethereum Virtual Machine (EVM) and an Ethereum Co-Chain integration with the Ren protocol.
VORTECS™ data from Cointelegraph Markets Pro began to detect a bullish outlook for KAVA on April 1, prior to the recent price rise.
The VORTECS™ Score, exclusive to Cointelegraph, is an algorithmic comparison of historical and current market conditions derived from a combination of data points including market sentiment, trading volume, recent price movements and Twitter activity.
As seen in the chart above, the VORTECS™ Score for KAVA began to pick up on April 1, around 94 hours before the price increased 25% over the next three days.
The views and opinions expressed here are solely those of the author and do not necessarily reflect the views of Cointelegraph.com. Every investment and trading move involves risk, you should conduct your own research when making a decision.
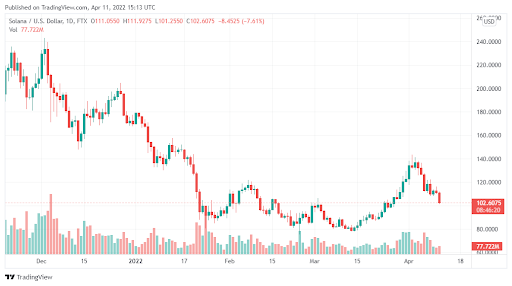
Solana (SOL) has struggled to report any gains after trading in losses over the last three sessions in a row. The coin now looks very weak, and unless something drastic happens, it’s headed for further decline. Here are some highlights:
SOL has fallen sharply in the last 24 hours, dropping by almost 10%.
The coin still remains above a crucial $100 support zone
But this is unlikely to hold in the coming days
Data Source: Tradingview
Solana (SOL) – How far can it fall
After surging at the end of March, SOL slowed sharply in April. The coin has fallen from its $140 highs and is now just above the $100 mark. SOL even managed to push below its lowest price in March of $107. This could suggest that we are on the brink of a trend reversal that could see more losses follow.
In fact, if bulls lose the crucial psychological support zone of $100, then the only way for SOL will be downwards. The $100 and the $93 support zones have proved very strong in the past. While there may be some resilience in the days ahead, the $100 will be lost, and bulls will try to consolidate at $93.
But if $93 is also lost, SOL will enter an intense downward spiral that could bottom at $77 before any leg up. This will represent a loss of nearly 30% from its current price and almost a 100% decline from its highest price in March.
Is it good to own Solana?
Solana is a big project, and if you don’t have it yet, this would be a nice time to buy it. However, because there is a significant downside risk, you may want to wait for a week or so.
Based on current indicators on the chart, SOL is likely to bottom. When that happens, you can buy and hold SOL for the future.
Bitcoin (BTC) and most major altcoins have broken key support levels to start the week on a weak note. The crypto markets seem to be following the U.S. equity markets lower which are being pulled down as investors reduce exposure to risky assets because of rising rates.
Arthur Hayes, ex-CEO of derivatives giant BitMEX, said that with rates moving higher and the Fed tapering its asset purchases, the equity markets could witness a meltdown. If that happens, Hayes expects the crypto markets to continue lower and Bitcoin to drop to $30,000 and Ether (ETH) to $2,500 by June of this year.
Ark Invest founder Cathie Wood said in an interview with CNBC that decentralized finance applications are attracting huge interest from investors. The legacy banking industry is feeling the heat because they are not only losing the lending and saving business to DeFi but also losing talent to the crypto industry.
Although the long-term remains positive, could Bitcoin and altcoins weaken further in the near term? Let’s study the charts of the top-10 cryptocurrencies to find out.
BTC/USDT
The bulls held Bitcoin above the 50-day simple moving average ($41,908) for the past few days but could not push the price above the 20-day exponential moving average ($43,576). This suggests that bears are selling on rallies.
BTC/USDT daily chart. Source: TradingView
The selling picked up momentum today and the bears have pulled the price below the 50-day SMA. There is a minor support at the psychological level at $40,000 but if it cracks, the BTC/USDT pair could plummet to the support line of the ascending channel. The bulls are likely to defend this level with all their might.
The downsloping 20-day EMA and the RSI in the negative territory indicate that bears are back in the driver’s seat. This negative view will be invalidated in the short term if the price turns up and breaks above the 20-day EMA. The pair could then rise to $45,400.
ETH/USDT
Ether traded near the 20-day EMA ($3,198) for the past few days but the weak bounce off it suggested a lack of aggressive buying by the bulls. That may have emboldened the bears who have accelerated their selling today.
ETH/USDT daily chart. Source: TradingView
The bears will now try to pull the price to the 50-day SMA ($2,940). If the price rebounds off this support, the ETH/USDT pair could consolidate between the 50-day SMA and the 200-day SMA ($3,489) for a few days.
Alternatively, if the price breaks below the 50-day SMA, the selling could accelerate and the pair could drop to $2,800. A break below this support could result in a decline to the trend line. The bulls are expected to defend this level aggressively.
BNB/USDT
Binance Coin (BNB) turned down from the overhead resistance at $445 on April 8 and broke below the 20-day EMA ($422). This suggests that bears are selling on rallies to $445.
BNB/USDT daily chart. Source: TradingView
The buyers tried to push the price back above the 20-day EMA in the past two days but could not sustain the higher levels. This renewed the selling and the BNB/USDT pair has dropped to the 50-day SMA ($400).
A strong rebound off the current level will suggest that bulls are accumulating on dips. The buyers will have to push and sustain the price back above the 20-day EMA to enhance the prospects for a retest at $445.
Conversely, if the price breaks below the 50-day SMA, it will suggest that buying has dried up. That could pull the pair down to the strong support at $350.
SOL/USDT
Solana (SOL) turned down from the overhead resistance at $122 on April 8 and plunged below the 20-day EMA ($112). The bulls pushed the price back above the 20-day EMA on April 10 but could not sustain the higher levels. This suggests that bears are selling on rallies.
SOL/USDT daily chart. Source: TradingView
The selling picked up momentum today and the bears have pulled the price below the support at $106. The SOL/USDT pair could now drop to the 50-day SMA ($98) which is likely to act as a strong support.
If the price rebounds off the 50-day SMA and breaks above the 20-day EMA, it will suggest strong demand at lower levels. On the other hand, a break and close below the 50-day SMA could open the doors for a further downside to $81.
XRP/USDT
Ripple (XRP) had been trading above the $0.75 level for the past few days but the failure to push the price back above the moving averages may have attracted further selling by the bears.
XRP/USDT daily chart. Source: TradingView
The 20-day EMA ($0.79) has turned down and the RSI is near 34, indicating that sellers are in control. The next stop is likely to be $0.69. A strong rebound off this level will suggest that bulls are defending this level with vigor. That could keep the XRP/USDT pair range-bound between $0.69 and $0.91 for a few days.
However, if the price breaks below $0.69, the selling could intensify further and the pair could drop to the next major support at $0.60.
ADA/USDT
Cardano (ADA) made several attempts to rise back above the 20-day EMA ($1.06) in the past few days but the bears did not relent. The selling intensified today and the bears have pulled the price below the 50-day SMA ($0.96).
ADA/USDT daily chart. Source: TradingView
If the price sustains below the 50-day SMA, the ADA/USDT pair could drop to the critical support at $0.74. The bears are expected to defend this level with all their might. A strong bounce off it could suggest that the pair may consolidate inside a large range between $0.74 and $1.26 for a few days.
Contrary to this assumption, if the price turns up from the current level and rises above the 20-day EMA, it will suggest strong buying at lower levels. That could limit the trading range between the 50-day SMA and $1.26.
LUNA/USDT
Terra’s LUNA token plunged and closed below the 20-day EMA ($99) on April 8. The bulls tried a recovery on April 9 but could not challenge the 20-day EMA. This may have attracted further selling and the bears have pulled the price below the 50-day SMA ($90).
LUNA/USDT daily chart. Source: TradingView
The 20-day EMA has turned down and the RSI has dipped into the negative zone, suggesting that the momentum has turned in favor of the bears. If the price sustains below the 50-day SMA, the possibility of a drop to $75 increases. If this level also cracks, the next stop could be the strong support at the 200-day SMA ($65).
On the contrary, if the price turns up from the current level and rises above the 50-day SMA, it will suggest strong demand at lower levels. The bulls will then again attempt to push the price above the 20-day EMA.
The bulls failed to sustain Avalanche (AVAX) above the 20-day EMA ($86) on April 8, suggesting that the bears are defending this level. This may have led to further selling and the price dipped below the 50-day SMA ($82) on April 10.
AVAX/USDT daily chart. Source: TradingView
The 20-day EMA has turned down and the RSI is in the negative territory, indicating that bears have the upper hand. The sellers will attempt to pull the price to the next strong support at $65.
If the price rebounds off this level, it will suggest that the AVAX/USDT pair could oscillate between $65 and $99 for a few more days.
Alternatively, if the price turns up from the current level, the bulls will again try to push the pair above the 20-day EMA and challenge the overhead resistance at $99.
DOT/USDT
The bulls defended the 50-day SMA ($19) from April 8 to 10 but the failure to push Polkadot (DOT) above the 20-day EMA ($20) may have attracted selling. That has pulled the price below the strong support at $19.
DOT/USDT daily chart. Source: TradingView
The 20-day EMA has started to turn down and the RSI is in the negative territory, indicating that bears have the upper hand. The DOT/USDT pair could now drop to $16, which is likely to act as a strong support.
If the price rebounds off this level, the pair could remain stuck between $16 and $21 for a few more days. The next trending move is likely to start on a break below $16 or a rally above the overhead hurdle at $21.
DOGE/USDT
Dogecoin (DOGE) attempted a rally on April 10 but the long wick on the candlestick shows that bears sold at higher levels. The bears will now try to sink and sustain the price below the 20-day EMA ($0.14).
DOGE/USDT daily chart. Source: TradingView
If that happens, the DOGE/USDT pair could slide to the 50-day SMA ($0.13). Such a move will suggest that the pair could remain stuck inside the large range between $0.17 and $0.10 for the next few days.
The flattening 20-day EMA and the RSI near the midpoint also suggest a consolidation in the near term. If the price rebounds off the current level, the bulls will again try to push the pair to $0.17. A break and close above the 200-day SMA ($0.18) could indicate the start of a potential new uptrend.
The views and opinions expressed here are solely those of the author and do not necessarily reflect the views of Cointelegraph. Every investment and trading move involves risk. You should conduct your own research when making a decision.
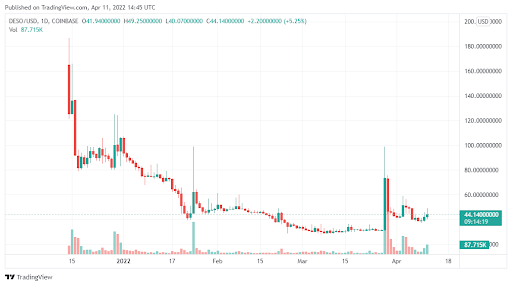
The broader crypto market has started the new week the same way it ended last week. Most coins have continued to report losses. But in the middle of all this, Decentralized Social (DESO) appears to be holding steady in fact; the coin is relatively bullish compared to the rest of the market. Here is what you need to know:
DESO has surged by nearly 10% over the last 24 hours, outperforming the market.
The coin also remains well above a crucial support zone of $37.5
But massive whale holdings open DESO to wild volatility
Data Source: Tradingview
Decentralized Social (DESO) – The price action
As noted above, DESO has managed to outperform the whole market by a mile. As most coins see single-digit drops today, DESO has surged by over 10% over the last 24 hours alone. The coin has now gained nearly 70% from its lowest point in 2022 and looks to keep going.
Besides, DESO remains above the crucial support zone of $37.50. As long as bulls keep the price action above this, then we could see DESO thrust towards $54 in the near term. The biggest risk factor, however, is massive whale accumulation for this coin.
This makes it prone to wild volatility if big wallets decide to sell. In fact, a scenario where DESO loses the $37.5 support is possible. This could bring massive sell-off pressure and push the price downwards.
Is DESO a profitable asset?
Well, it is and it depends on how you want to play the current setup. DESO may still add at least 20% of its value before it corrects, so there is a short-term play here. This will however depend on whether whales decide to sell or not.
Also, DESO is fairly decent as a long-term asset. We believe the coin has the potential to touch $100 by the end of 2022, which will be a 100% return.
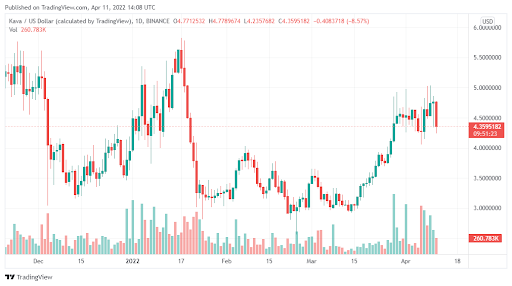
Kava (KAVA) appears to be showing several bullish signals. This comes even as the coin falls sharply from its recent rally. KAVA is currently looking to consolidate before its next bull run, and this could come sooner than you think. Here are the latest developments:
KAVA could surge towards $6.68 in the upcoming bull run
The coin is trading above a crucial support zone of $4.13.
KAVA is relatively closer to its ATH compared to other altcoins
Data Source: Tradingview
Kava (KAVA) – Can it hit $6.68
Unlike most altcoins in the market, KAVA has remained very resilient to recent market pressures. For instance, while most altcoins have fallen nearly 90% from their all-time highs, KAVA has done much better, trading about 45% lower than its ATH.
The coin is in a consolidation phase right now. If bulls hold the crucial support of $4.13, we are likely to see a bullish breakout in the near term that takes KAVA closer to the $6.68 mark. KAVA has also bounced back sharply from its 2022 lows. After tanking to around $2.55 in February, the coin has surged over 100% ever since.
We expect this bullish momentum to continue in the near term. KAVA is likely to soar past $5 in the days ahead before consolidating again and testing the $6.68 mark. If this happens, the coin will deliver gains of up to 55% from its current price.
Should you buy Kava?
Well, KAVA looks primed for a decent run in the weeks ahead. This would be the most ideal time to accumulate the coin. However, watch it for a few days.
If bulls are still able to keep the $4.13 support, then you can enter. Exit points should be around $5 and the $6 mark. As for the long-term investor, KAVA holds incredible fundamentals and should be a good addition to your portfolio.
Please be aware that some of the links on this site will direct you to the websites of third parties, some of whom are marketing affiliates and/or business partners of this site and/or its owners, operators and affiliates. We may receive financial compensation from these third parties. Notwithstanding any such relationship, no responsibility is accepted for the conduct of any third party nor the content or functionality of their websites or applications. A hyperlink to or positive reference to or review of a broker or exchange should not be understood to be an endorsement of that broker or exchange’s products or services.
Risk Warning: Investing in digital currencies, stocks, shares and other securities, commodities, currencies and other derivative investment products (e.g. contracts for difference (“CFDs”) is speculative and carries a high level of risk. Each investment is unique and involves unique risks.
CFDs and other derivatives are complex instruments and come with a high risk of losing money rapidly due to leverage. You should consider whether you understand how an investment works and whether you can afford to take the high risk of losing your money.
Cryptocurrencies can fluctuate widely in prices and are, therefore, not appropriate for all investors. Trading cryptocurrencies is not supervised by any EU regulatory framework. Past performance does not guarantee future results. Any trading history presented is less than 5 years old unless otherwise stated and may not suffice as a basis for investment decisions. Your capital is at risk.
When trading in stocks your capital is at risk.
Past performance is not an indication of future results. Trading history presented is less than 5 years old unless otherwise stated and may not suffice as a basis for investment decisions. Prices may go down as well as up, prices can fluctuate widely, you may be exposed to currency exchange rate fluctuations and you may lose all of or more than the amount you invest. Investing is not suitable for everyone; ensure that you have fully understood the risks and legalities involved. If you are unsure, seek independent financial, legal, tax and/or accounting advice. This website does not provide investment, financial, legal, tax or accounting advice. Some links are affiliate links. For more information please read our full risk warning and disclaimer.
One of the best ways to make money from crypto would be to target low-cap coins. Now, this does not mean that all low cap projects will go on to make it big. But in most cases, if you want to grow your capital fairly fast, such low cap coins would be just perfect. Here is why:
A low cap coin often has relatively low value with room to expand.
Most low cap coins tend to have low coverage by the media and other investors.
Almost all coins that have delivered 10x or more have often been low cap assets.
With this in mind, it should be the responsibility of any investor to hunt down promising low cap coins and lock them in. Here are 3 options you can consider now:
Base Protocol (BASE)
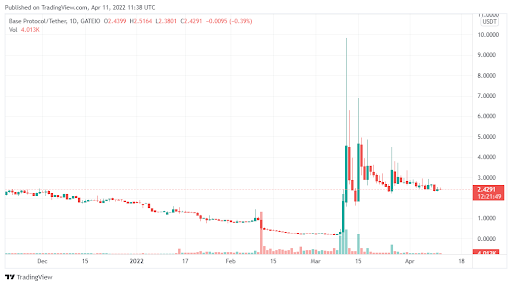
The Base Protocol (BASE) is basically a crypto asset whose value is pegged on the market cap of the entire crypto industry. In essence, the price action of these coins is based on how the overall market cap of the industry moves.
Data Source: Tradingview
BASE is designed to help investors bet on the entire crypto market without having to buy specific coins. It is a very interesting project, and when you consider the market cap right now is around $1.1 million, the potential for growth is massive.
Fetch.AI (FET)
Fetch.AI (FET) is an NFT inspired project that wants to create a robust and social sharing culture. The project is relatively small, with a market cap of around $250 million. With NFTs really heating up, it is likely that FET will see more growth in the medium term.
Augur (REP)
Augur (REP) is a prediction markets aggregator that hopes to create a fully decentralized prediction market community. It has a powerful ecosystem and a stellar team of experts to back it. The project as of now has a market cap of around $140 million.
2021 was seen as one of the best years for crypto assets. Many coins made it big last year, and there was hope that this trend would carry on even in 2022. But the market has stagnated a bit and lost some of the momenta we saw at the end of 2021. But 2022 could still be a big year for crypto investment. Here is why:
The overall risk in other assets, including equities is now very high.
Crypto is likely to outperform traditional assets by a huge margin in 2022.
The crypto market has dipped slightly and should be perfect for value investing.
So, if you are thinking of adding some crypto assets into your portfolio over the coming months, here are 3 coins to consider.
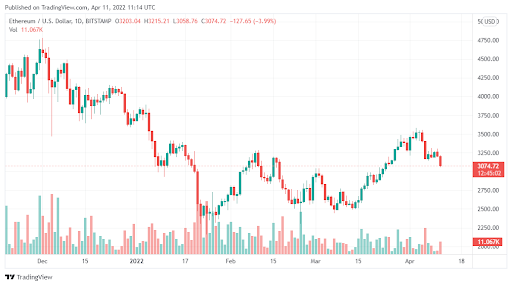
Ethereum (ETH)
A lot of positive things have been happening with the Ethereum (ETH) chain over the last few months. The chain is moving towards a proof of stake consensus that will help enhance scalability and efficiency.
Data Source: Tradingview
Ethereum is also expected to report record fees this year as more and more DAPPs flock towards its ecosystem. Considering that ETH has fallen quite substantially from its 2021 highs, it could be a very decent buy.
STEPN (GMT)
Hopes about the rise of the metaverse have been quite substantive over the last few months. 2022 is seen as perhaps the breakthrough year for metaverse tokens and as such, it won’t be a surprise if coins like STEPN (GMT) surge. While there are many other metaverse tokens to watch, this one is a very promising one.
Shiba Inu (SHIB)
Shiba Inu (SHIB) made massive headlines last year with recording-breaking growth. It has since lost a lot of the gains it made in 2021 but this does not mean SHIB is down and out. In fact, it could deliver impeccable gains for investors in 2022 but not as much as we saw last year.
Terra (LUNA) price slid on April 11 as a broader correction across crypto assets added to the uncertainties concerning its token burning mechanism.
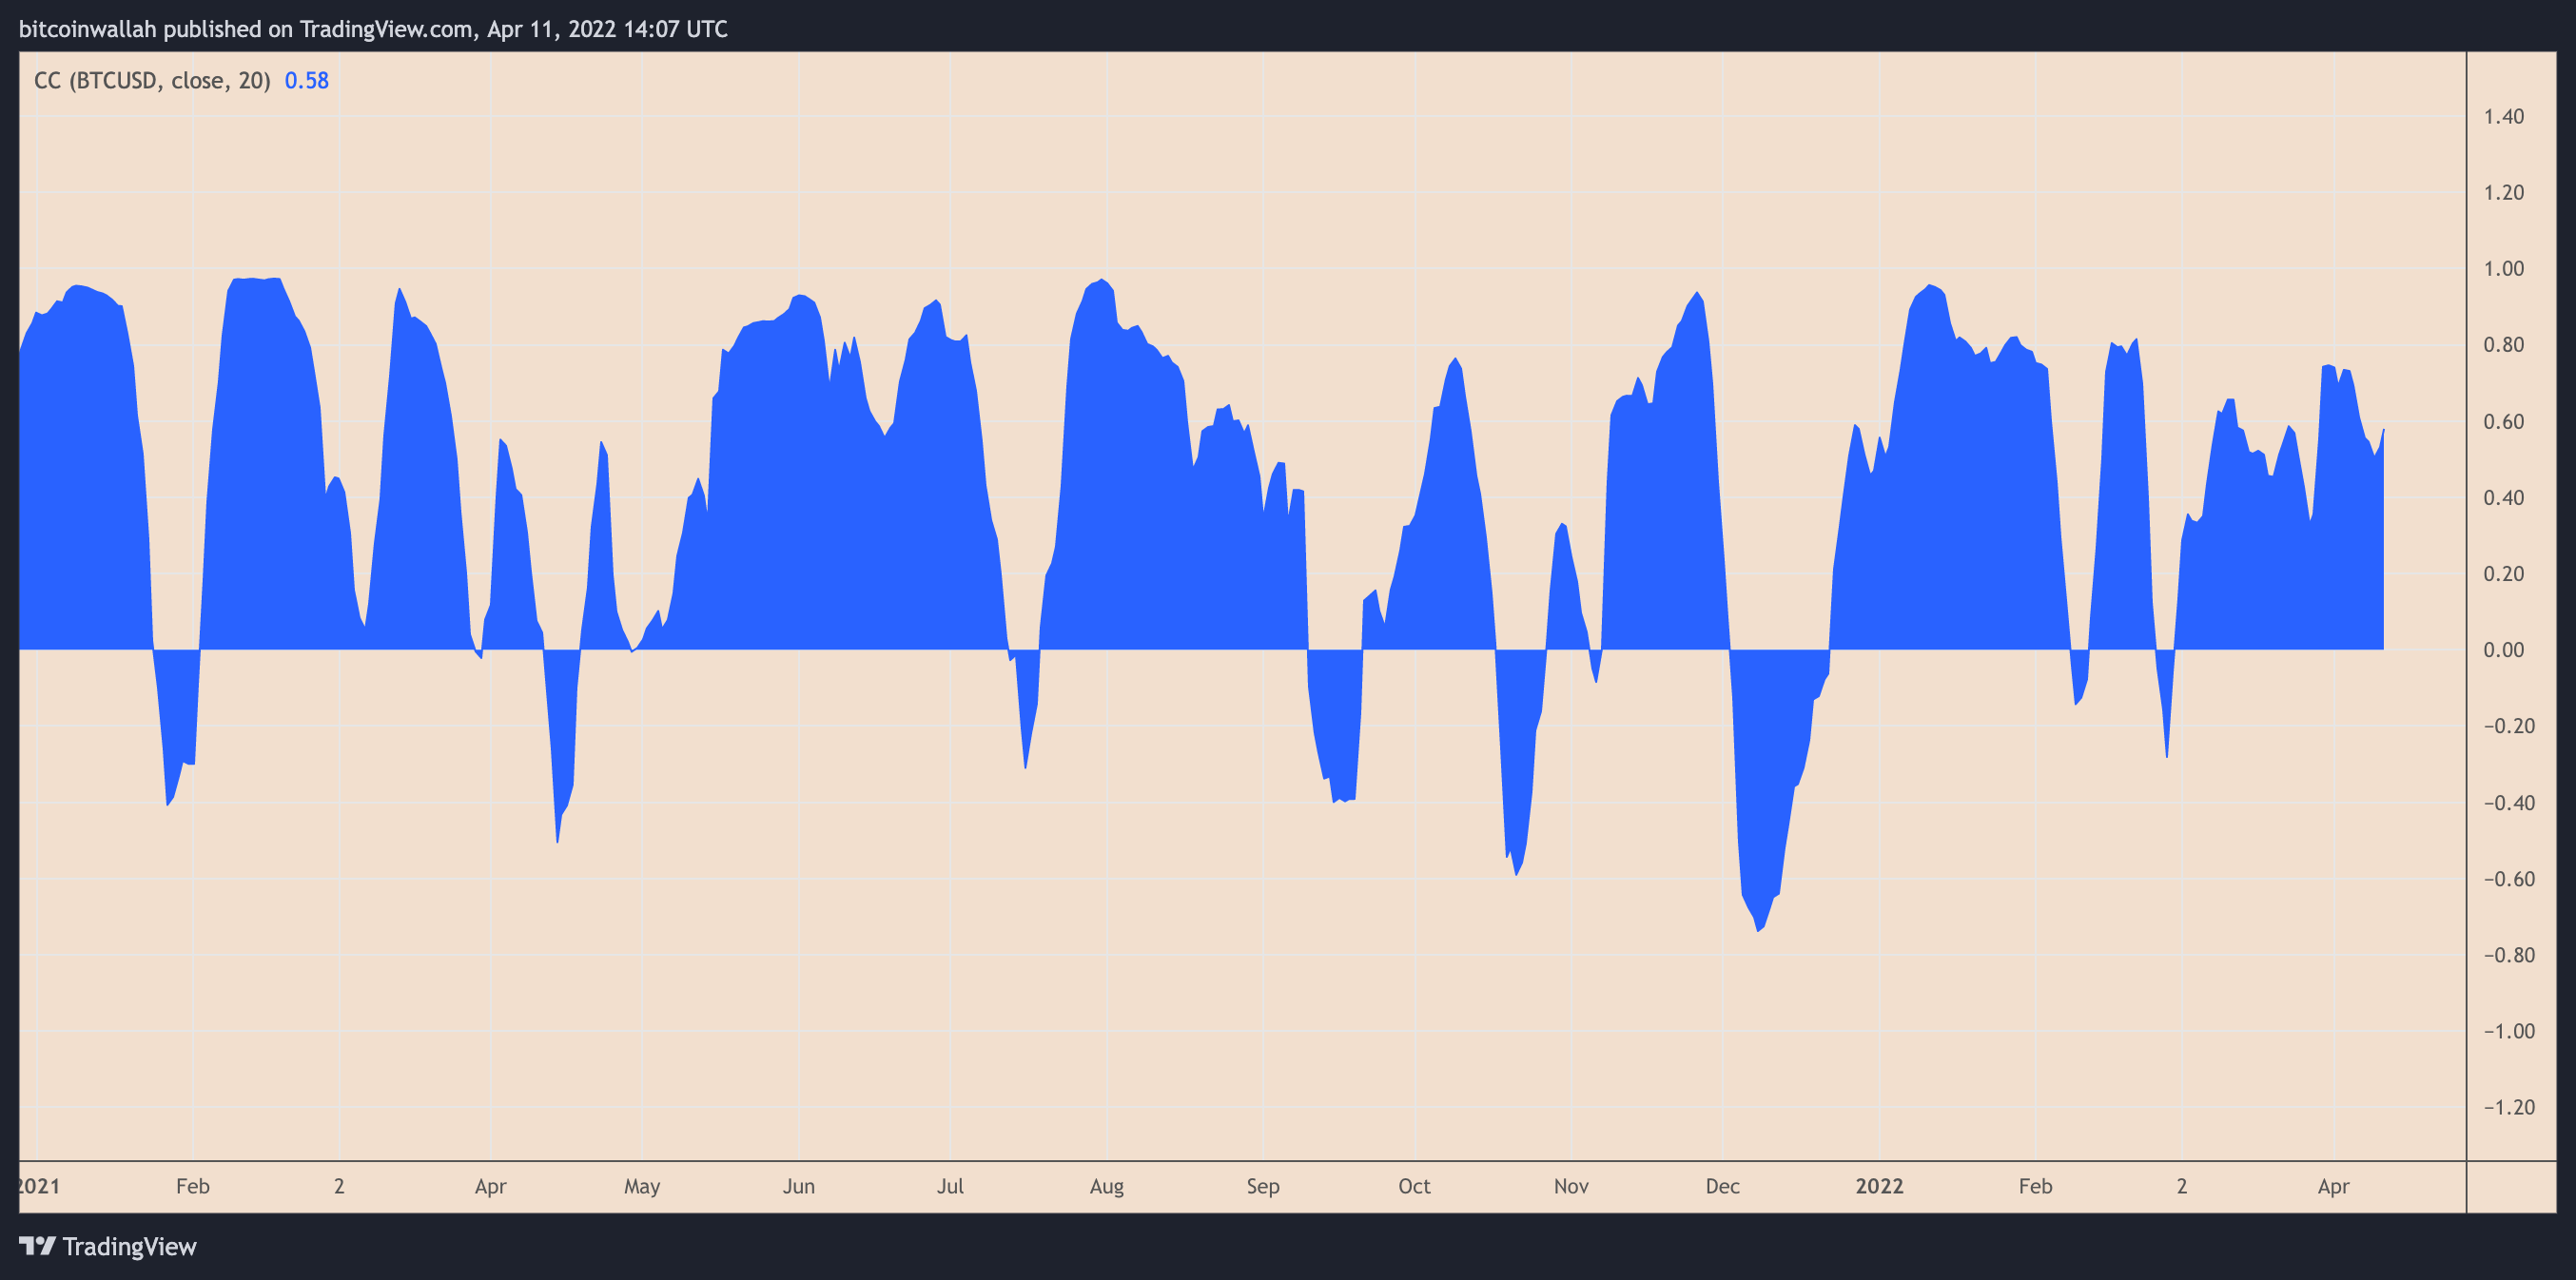
Bitcoin (BTC) and Ether (ETH) led to a decline in the rest of the cryptocurrency market, with LUNA’s price dropping by over 8% to nearly $91.50, and about 30% from its record high of $120, set on April 6.
The overall drop tailed similar moves in the U.S. stock market last week after the Federal Reserve signaled its intentions to raise interest rates and shrink balance sheets sharply to curb rising inflation.
The correlation between LUNA and BTC has been largely positive in 2022. Source: TradingView
Tale of two exposés
LUNA picked additional downside cues from at least two “exposé” threads that went viral on Twitter over the weekend.
The first thread, penned by a pseudonymous analyst @DeFi_Made_Here on April 7, questioned LUNA’s capability to maintain the peg of Terra’s native stablecoin, TerraUSD (UST) since it is not backed by any tangible asset.
The second thread, published on April 9 by Jack Niewold, an analyst at the Crypto Pragmatist — a DeFi newsletter, accused Terra co-founder Do Kwon of receiving all the LUNA tokens meant to be “burned” to mint UST.
He also alleged that the Luna Foundation Guard, a nonprofit organization that backs the Terra ecosystem, has been using a percentage of burned LUNA supply to buy Bitcoin.
Kwon refuted the claims in a tweet-to-tweet response to Niewold, calling him a “made up clickbait.” The self-proclaimed “master of stablecoin” asserted that Terra burns LUNA 1:1 to mint new UST, which can be seen by testing a swap on the Anchor Protocol dashboard.
Jose Maria Macedo, head of crypto research platform Delphi Digital, also rubbished Niewold’s thread as “absolutely terrible.”
Key LUNA price support breaks
The latest LUNA selloff also led its price below its key moving average support against the U.S. dollar.
In detail, the Terra token dropped below its 50-day exponential moving average (50-day EMA; the red wave in the chart below), now near $90, almost two months after reclaiming it as support.
The latest support-to-resistance flip exposes LUNA to the possibility of extending its downtrend toward its 200-day EMA (the blue wave) around $67 (around 20% lower than April 11’s price) in April.
LUNA/USD daily price chart featuring 50-day EMA support. Source: TradingView
The 200-day EMA also coincides with the 0.382 Fib line of the Fibonacci retracement graph, drawn from the $4-swing low to the $106-swing high, thus offering LUNA double-layered support against bears.
Conversely, an early rebound from 0.236 Fib line (near $82) could have LUNA retest $106 as its interim upside target.
The views and opinions expressed here are solely those of the author and do not necessarily reflect the views of Cointelegraph.com. Every investment and trading move involves risk, you should conduct your own research when making a decision.