Despite these pressures, however, several cryptocurrency projects have managed to post gains in excess of 20% on March 14, thanks to new partnerships and protocol updates.
Top 7 coins with the highest 24-hour price change. Source: Cointelegraph Markets Pro
Data from Cointelegraph Markets Pro and TradingView shows that the biggest gainers over the past 24-hours were Request Network (REQ), Hifi Finance (MFT) and Selfkey (KEY).
Metaverse payments with Request Network
Request Network (REQ) is an Ethereum-based decentralized payment system that allows users to create, share or fulfill a request for payment through secure channels without the need for an intermediary.
VORTECS™ data from Cointelegraph Markets Pro began to detect a bullish outlook for REQ on March 13, prior to the recent price rise.
The VORTECS™ Score, exclusive to Cointelegraph, is an algorithmic comparison of historical and current market conditions derived from a combination of data points including market sentiment, trading volume, recent price movements and Twitter activity.
VORTECS™ Score (green) vs. REQ price. Source: Cointelegraph Markets Pro
As seen in the chart above, the VORTECS™ Score for REQ began to pick up on March 13, around eight hours before the price increased 45% over the next day.
The increase in momentum for REQ comes following the addition of support for the Jarvis Network’s Euro stablecoin (jEUR) to go along with the project’s ongoing push to become the go-to payment provider for activities in the evolving Metaverse.
Hifi Finance adds community governance
Hifi Finance is a decentralized lending protocol that allows crypto holders to borrow against the value in their assets using bond-like instruments that represent an on-chain obligation that settles on a specified date in the future.
Data from Cointelegraph Markets Pro and TradingView shows that since hitting a low of $0.006 on March 6, the price of MFT climbed 5% to hit a daily high at $0.009 on March 14 as its 24-hour trading volume spiked 1,131% to $235 million.
MFT/USDT 4-hour chart. Source: TradingView
The sudden spike in price and trading volume for MFT follows an announcement that Hifi Finance will soon be integrating governance capabilities for MFT holders who will be able to create and vote on proposals regarding the future development of the protocol.
Selfkey (KEY) is a blockchain-based identity platform that is looking to advance the Know Your Customer (KYC) process and support the ethos of Self-Sovereign Identity through its KYC-Chain.
VORTECS™ data from Cointelegraph Markets Pro began to detect a bullish outlook for REQ on March 7, prior to the recent price rise.
VORTECS™ Score (green) vs. KEY price. Source: Cointelegraph Markets Pro
As seen in the chart above, the VORTECS™ Score for KEY elevated into the green on March 7 and hit a high of 85 around 72 hours before the price began to increase 35.6% over the next four days.
The turnaround in the price of KEY comes as the project works to integrate SelfKey and its KYC-Chain decentralized identity management system across the cryptocurrency ecosystem as a way to satisfy global KYC/Anti-Money Laundering regulations.
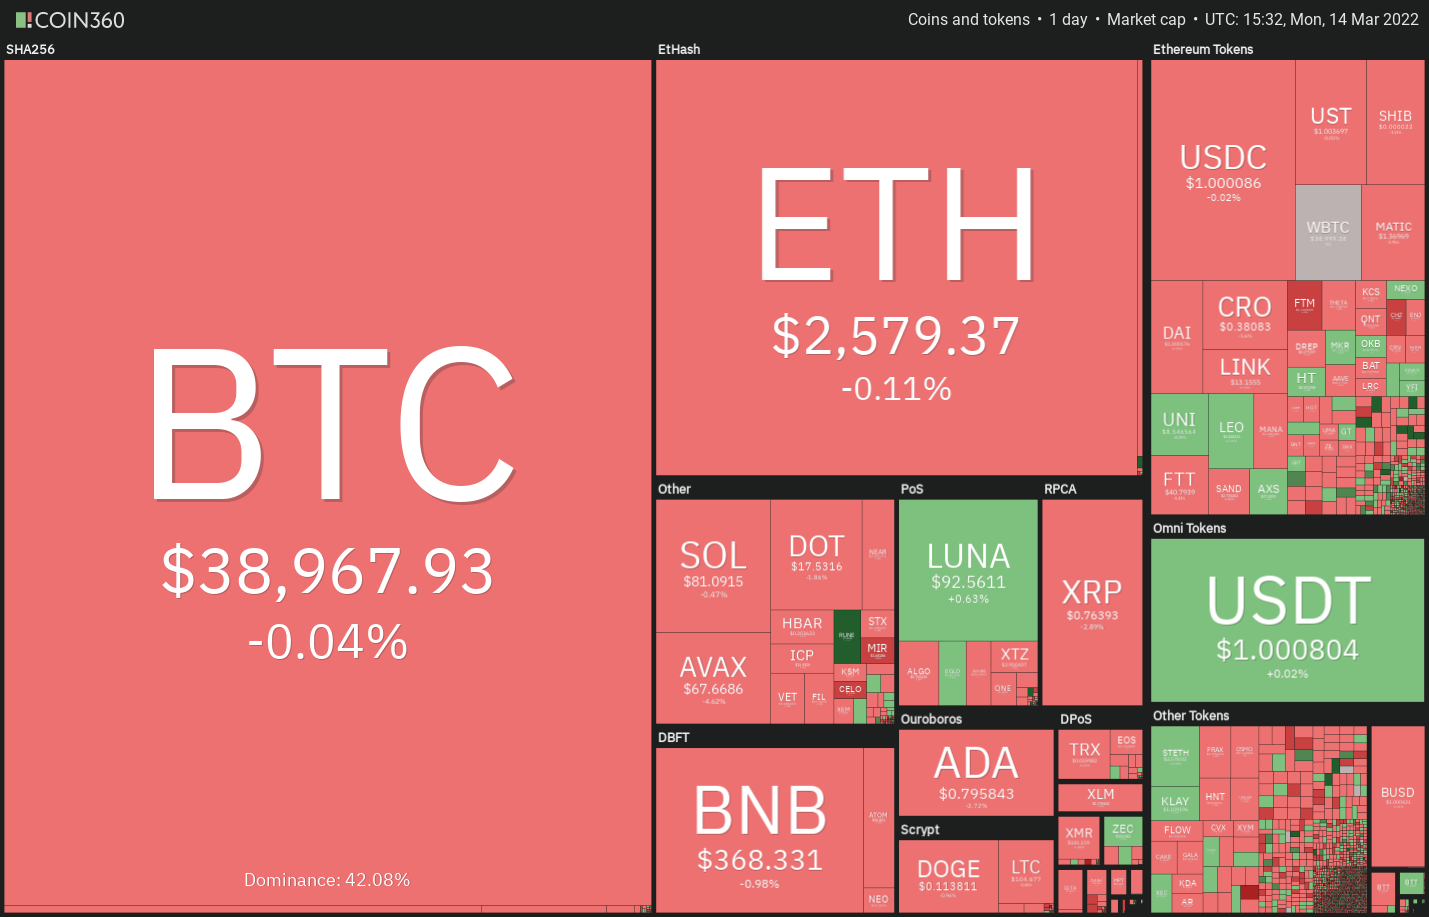
The overall cryptocurrency market cap now stands at $1.732 trillion and Bitcoin’s dominance rate is 42.7%.
The views and opinions expressed here are solely those of the author and do not necessarily reflect the views of Cointelegraph.com. Every investment and trading move involves risk, you should conduct your own research when making a decision.
Within 24 hours of its launch on digital collectibles marketplace Veve, crypto enthusiasts purchased all 54,995 pieces of the Disney Pixar Pals nonfungible tokens, or NFTs, collection. The drop consisted of iconic characters and moments created by Pixar Animation Studios, including Sheriff Woody, Mike Wazowski,Lightning McQueen, The House from Up andEdna Mode. Users purchased their NFTs from a blind box, meaning that they receive a random collectible as part of the series and would not know which collectible until after payment.
The list price for each Pixar NFT was 60 gems ($60). By multiplying the collection sold by their listed gem price, it is estimated that the NFT collection fetched the equivalent of $3.3 million. At the time of publication, items in the Pixar drop are selling for up to 350 gems on the secondary market. NFTs on VeVe are currently minted on GoChain. Its developers claim that the blockchain is fast, environmentally friendly and 100% compatible with Ethereum (ETH).
Gems are VeVe’s in-app tokens exchangeable for digital assets on a 1:1 basis with the U.S. dollar. However, the ability to convert gems back into fiat is still in the testing phase. This is because there currently exists a related incentive with holding OMI tokens, which are created by VeVe’s parent, ECOMI.
Whenever gems are used to purchase an NFT, 100% of the equivalent value of OMI is burnt from the token supply while the digital collectible is transferred to the user’s account. Correspondingly, OMI can be converted into gems but not vice versa due to speculation that it may tank the former’s price.
Bitcoin (BTC) has largely been directionless since the start of the year as the bulls have been buying on dips while bears are selling the rallies. This suggests that the price is consolidating in a large range with both the bulls and the bears waiting for the next trigger to establish their supremacy.
The short-term volatility may pick up after the United States Federal Reserve announces its policy decision on March 16 but unless the Fed springs a surprise, the likelihood of a new trending move could be low. Bitcoin could spend some more time in a bottoming formation before breaking out of it.
A positive sign in the range-bound action this year has been evidence of accumulation by both the small investors and select whales. This has coincided with a sustained drop in Bitcoin balances on exchanges. The combined Bitcoin balances on the 21 exchanges it covers have dropped to 2.32 million Bitcoin, the lowest since August 2018, according to CryptoQuant.
Could Bitcoin break above the immediate resistance level and pull the altcoins higher? Let’s analyze the charts of the top-10 cryptocurrencies to find out.
BTC/USDT
Bitcoin has bounced from the immediate support at $37,000, indicating that bulls are attempting to defend this level. The buyers will now try to push the price above the moving averages. If they succeed, it will suggest strong demand at lower levels.
BTC/USDT daily chart. Source: TradingView
The bulls will then try to extend the up-move by clearing the overhead hurdle at $42,594. If they manage to do that, it will be the first indication that the bears may be losing their grip. The BTC/USDT pair could then rise to the overhead zone between $45,400 and the resistance line of the ascending channel.
Conversely, if the price turns down from the moving averages, it will suggest that bears are unwilling to let go of their advantage. The sellers will then attempt to solidify their position by pulling the price below the support line of the channel. Such a move could signal the resumption of the downtrend.
ETH/USDT
The bulls are attempting to defend the support line of the symmetrical triangle. A strong bounce off the current level could push Ether (ETH) to the moving averages where the bears are again likely to mount a strong defense.
ETH/USDT daily chart. Source: TradingView
If the price turns down from the moving averages, it will suggest that the sentiment remains negative and traders are selling on relief rallies. That will increase the possibility of a break below the triangle. The ETH/USDT pair could then resume its downtrend and decline to $2,159.
Contrary to this assumption, if bulls propel the price above the moving averages, it will suggest that the selling pressure may be reducing. The pair could then rise to the psychological level at $3,000 and later challenge the resistance line of the triangle.
BNB/USDT
BNB is attempting to rebound off the support zone between $360 to $350. This suggests that buyers continue to accumulate on dips near the support zone.
BNB/USDT daily chart. Source: TradingView
The buyers will have to push and sustain the price above the moving averages to indicate that the bears may be losing their grip. If the price sustains above the 50-day simple moving average (SMA) ($389), the bulls will attempt to push the BNB/USDT pair to $425.
This positive view will invalidate if the price once again turns down from the moving averages and breaks below $350. Such a move will suggest that the sentiment remains negative and traders continue to sell on rallies. That could pull the price to the critical support at $320.
XRP/USDT
Ripple (XRP) price soared above the downtrend line on March 11 but the rally met with stiff resistance at $0.85. This suggests that the bears have not yet given up and they continue to sell on rallies.
XRP/USDT daily chart. Source: TradingView
The price has pulled back to the 20-day exponential moving average (EMA) ($0.75), which is likely to act as a strong support. If the price rebounds off the current level, the buyers will make one more attempt to push and sustain the XRP/USDT pair above $0.85. If they succeed, the pair could rally to $0.91 and then rise to the psychological resistance at $1.
This positive view will invalidate if the price breaks below the moving averages. Such a move will suggest that the break above the downtrend line may have been a bull trap. A break and close below $0.69 could open the doors for a possible drop to $0.62.
LUNA/USDT
Terra’s LUNA token slipped below $94 on March 11 but the bears could not pull the price to the 20-day EMA ($82). This is a positive sign as it shows that traders are buying on every minor dip.
LUNA/USDT daily chart. Source: TradingView
Although the rising 20-day EMA indicates advantage to buyers, the negative divergence on the relative strength index (RSI) suggests that the bullish momentum may be weakening.
The bulls are attempting to push the price back above $94. If that happens, the buyers will make one more attempt to clear the overhead hurdle at $105 and resume the uptrend. If they do that, the LUNA/USDT pair could rally to $115.
Conversely, if the price turns down from the overhead zone, the bears will try to sink the pair below the 20-day EMA.
SOL/USDT
Solana (SOL) broke and closed below the strong support at $81 on March 11 and followed it up with further selling on March 13. However, the bears have not been able to break the intraday low at $75 made on Feb. 24.
SOL/USDT daily chart. Source: TradingView
The positive divergence on the RSI indicates that the selling pressure may be reducing. The bulls are attempting to push the price back above the breakdown level at $81 on March 14. If they sustain the price above $81, it will suggest that the recent breakdown may have been a bear trap. The buyers will then strive to push the SOL/USDT pair above the 20-day EMA ($87).
This positive view will invalidate if the price turns down from the current level and breaks below $75. That will suggest the bears have flipped the $81 level into resistance. The pair could then drop to $66.
ADA/USDT
Cardano (ADA) is attempting a rebound off the strong support at $0.74 but the effort lacks conviction. A minor positive is that the RSI is showing the first signs of positive divergence, indicating that the selling pressure may be reducing.
ADA/USDT daily chart. Source: TradingView
The bulls will have to push and sustain the ADA/USDT pair above the 20-day EMA ($0.85) to signal that the bears may be losing their grip. That could open the doors for a possible retest of the breakdown level at $1. This level is likely to attract strong selling.
Contrary to this assumption, if the price turns down from the current level or the 20-day EMA, it will indicate that bears are pouncing on every minor rally. That will increase the possibility of a break below $0.74. If that happens, the downtrend could extend to $0.68.
Avalanche (AVAX) broke below the uptrend line on March 13, indicating that the bears have overpowered the bulls. The attempts by the buyers to push the price above the breakdown level on March 14 met with strong selling by the bears.
AVAX/USDT daily chart. Source: TradingView
If bears sink and sustain the price below $64, the AVAX/USDT pair could slide to the strong support at $51. The downsloping 20-day EMA ($74) and the RSI in the negative territory indicate advantage to sellers.
This bearish view will invalidate in the short term if the price turns up from the current level and breaks above the moving averages. The bulls will then try to overcome the barrier at the downtrend line of the descending channel.
This is an important level to keep an eye on because the bulls have faltered at the downtrend line on four previous occasions. If bulls push and sustain the price above the channel, the pair could rally to $100.
DOT/USDT
Polkadot (DOT) once again turned down from the 50-day SMA ($18) on March 13 but the bulls are not allowing the price to sustain below the 20-day EMA ($17).
DOT/USDT daily chart. Source: TradingView
The price has been stuck in a tight range between $16 and $19 for the past few days, indicating indecision among the bulls and the bears. Such tight-range trading is usually followed by a sharp trending move.
If buyers push and sustain the price above $19, the DOT/USDT pair could rally to the next overhead resistance at $23. A break and close above this level will signal that the downtrend may be over.
Alternatively, if the price turns down and breaks below $16, the pair could retest the critical support at $14.
DOGE/USDT
Dogecoin (DOGE) made a strong attempt to start a relief rally on March 14 but the efforts of the bulls met with stiff resistance at the 20-day EMA ($0.12).
DOGE/USDT daily chart. Source: TradingView
If the bulls fail to clear the overhead hurdle, the bears will fancy their chances and try to sink the pair below the psychological support at $0.10. If that happens, the selling could further pick up momentum and the DOGE/USDT pair may slide to $0.06.
Contrary to this assumption, if the price rises from the current level or rebounds off $0.10, it will suggest accumulation by the bulls. The buyers will have to push and sustain the price above the 50-day SMA ($0.13) to signal a possible change in trend.
The views and opinions expressed here are solely those of the author and do not necessarily reflect the views of Cointelegraph. Every investment and trading move involves risk. You should conduct your own research when making a decision.
“USD consumer inflation will continue near all-time highs, and asset inflation will run at double the rate of consumer inflation. Weaker currencies will collapse, and the flight of capital from cash, debt, & value stocks to scarce property like bitcoin will intensify,” Saylor tweeted in response to Musk’s inflation query late Sunday.
The leader in news and information on cryptocurrency, digital assets and the future of money, CoinDesk is a media outlet that strives for the highest journalistic standards and abides by a strict set of editorial policies. CoinDesk is an independent operating subsidiary of Digital Currency Group, which invests in cryptocurrencies and blockchain startups. As part of their compensation, certain CoinDesk employees, including editorial employees, may receive exposure to DCG equity in the form of stock appreciation rights, which vest over a multi-year period. CoinDesk journalists are not allowed to purchase stock outright in DCG.
The leader in news and information on cryptocurrency, digital assets and the future of money, CoinDesk is a media outlet that strives for the highest journalistic standards and abides by a strict set of editorial policies. CoinDesk is an independent operating subsidiary of Digital Currency Group, which invests in cryptocurrencies and blockchain startups. As part of their compensation, certain CoinDesk employees, including editorial employees, may receive exposure to DCG equity in the form of stock appreciation rights, which vest over a multi-year period. CoinDesk journalists are not allowed to purchase stock outright in DCG.
Bitcoin (BTC) has been relatively calm during the weekend, indicating that traders are playing it safe and not waging large bets before the upcoming Federal Open Market Committee meeting on March 15 and March 16. The quantum of the rate hike could act as the next trigger for the crypto markets.
The current neutral setup of Bitcoin has kept the analysts guessing. Analytics resource Material Indicators warned that Bitcoin could plunge but they advised investors to be ready to buy the dip as they believe that the “bounce can change your life.”
A Price Waterhouse Coopers’ Sports Outlook 2022 report for North America highlighted three use cases for nonfungible tokens, which could shape the future of sports. The consultancy believes that NFTs and digital assets are among the ten major trends in the sports industry.
Could the crypto markets start a directional move in the near term? Let’s study the charts of the top-5 cryptocurrencies that may participate in a rally if the bullish sentiment picks up.
BTC/USDT
Bitcoin formed a Doji candlestick pattern on March 12 and on Sunday, indicating indecision among the bulls and bears. The price is stuck between the 20-day exponential moving average ($39,810) and the horizontal support at $37,000.
BTC/USDT daily chart. Source: TradingView
The 20-day EMA is flattish and the relative strength index (RSI) is just below the midpoint, indicating a balance between supply and demand.
If the price rises and breaks above the 50-day simple moving average ($39,978) the bulls will attempt to push the BTC/USDT pair above $42,600. If they succeed, the pair could rally to $45,400 and later to the resistance line of the channel.
Conversely, if the price turns down and breaks below $37,000, the bears will smell an opportunity. The sellers will then try to pull and sustain the pair below the support line of the channel. Such a move could clear the path for a possible drop to $30,000.
BTC/USDT 4-hour chart. Source: TradingView
The pair is forming a descending triangle pattern which will complete on a break and close below the strong support at $37,000. The pair could then drop to $34,322 and later start its journey toward the pattern target at $29,250.
Alternatively, if bulls push and sustain the price above the 50-SMA, the pair could rise to the downtrend line. A break and close above this level will invalidate the bearish pattern. That could attract buying and the pair may then rally toward $45,400.
DOT/USDT
Polkadot (DOT) has been in a downtrend for the past several months but the bulls are trying to form a bottom in the zone between $16 and $14. The price rose above the 20-day EMA ($17) but the bulls have not been able to overcome the barrier at the 50-day SMA ($18).
DOT/USDT daily chart. Source: TradingView
However, a positive sign is that the bulls have not given up much ground from the 50-day SMA. This suggests that the traders may be holding on to their position anticipating a break above the resistance. If that happens, the DOT/USDT pair could rally to the overhead resistance at $23 where the bears may again pose a stiff challenge.
The flattish 20-day EMA and the RSI near the midpoint suggest a range-bound action in the short term. If the price turns down from the 50-day SMA, the bears will try to pull the pair below $16. If they succeed, the pair could retest the critical support at $14.
DOT/USDT 4-hour chart. Source: TradingView
The 4-hour chart shows that the pair is oscillating between $16 and $19. The failure of the buyers to propel the price above the overhead resistance may have attracted profit-booking from short-term traders. That pulled the price to the 50-SMA.
If the price rises above the 200-SMA, it will suggest that bulls continue to buy on dips. The buyers will then again try to drive the price above the overhead resistance at $19. If they manage to do that, the pair could rise to $20 and later make a dash toward $23.
Conversely, a break and close below the 50-SMA may increase the possibility of a drop to the strong support at $16.
SAND/USDT
The Sandbox (SAND) has been range-bound between $2.55 and $4.86 for the past several weeks. The bears pulled the price below the 200-day SMA ($3.15) on March 4 but haven’t been able to break the support at $2.55.
SAND/USDT daily chart. Source: TradingView
This indicates accumulation near the support of the range. The RSI is showing signs of a positive divergence, indicating that the bearish momentum may be weakening.
If the price rises from the current level, the bulls will try to push the SAND/USDT pair above the 200-day SMA. If that happens, the pair could rise to the 50-day SMA ($3.51). A break and close above this resistance could open the doors for a possible rally to $4.50 and then to $4.86.
This bullish view will invalidate in the short term if the price turns down and slides below $2.55. That could suggest the resumption of the downtrend.
SAND/USDT 4-hour chart. Source: TradingView
The 50-SMA has been acting as a stiff resistance on the 4-hour chart. If bears sink the price below $2.70, the pair could drop to the solid support at $2.55. A break and close below this level could indicate advantage to bears.
To negate this view, the bulls will have to push the price above the zone between the 50-SMA and $3. If that happens, the pair could rally to $3.42 where the bears may again mount a strong defense.
THORChain (RUNE) broke above the moving averages on March 1 and successfully defended the level during the retest on March 8. This suggests that the sentiment has changed from sell on rallies to buy on dips.
RUNE/USDT daily chart. Source: TradingView
The bulls will now try to push the price to the 200-day SMA ($7.90) where the bears may again pose a strong challenge. If the price does not give up much ground from the 200-day SMA, the bulls will make one more attempt to clear this hurdle. If they succeed, the RUNE/USDT pair could rise to $9.
Alternatively, if the price turns down from the current level, the 20-day EMA is the important level to watch out for. A strong rebound off this level will suggest that the bullish sentiment remains intact while a break below it could result in a decline to $4.
RUNE/USDT 4-hour chart. Source: TradingView
The 20-EMA on the 4-hour chart is sloping up and the RSI is in the positive zone, indicating that the bulls have the upper hand. The pair could now rise to the overhead resistance at $7 where the bears will try to stall the up-move.
Alternatively, if the price turns down from the current level, the pair could drop to the 20-EMA. If the price rebounds off this level, the bulls will attempt to resume the uptrend. The bears will have to pull and sustain the price below the 20-EMA to indicate a change in the short-term trend.
ZEC/USDT
Zcash (ZEC) broke and closed above the $135 resistance on March 8, which completed a double bottom pattern. This was followed by a break above the 200-day SMA ($145) on March 10, signaling that bulls are back in the game.
ZEC/USDT daily chart. Source: TradingView
The bears are currently attempting to pull the price back below the 200-day SMA and challenge the breakout level at $135. This is an important level for the bulls to defend because a break below it could suggest that the recent breakout may have been a bear trap. The ZEC/USDT pair could then drop to the 50-day SMA ($114).
If the price rebounds off the current level or $135, it will suggest that the sentiment remains positive and traders are buying on dips. The bulls will then try to drive the pair above $160 and resume the up-move. The target objective of the breakout from the double bottom pattern is $189.
ZEC/USDT 4-hour chart. Source: TradingView
The bears pulled the price below the 20-EMA on the 4-hour chart but they have not been able to sustain the lower levels. This suggests that bulls continue to buy on every minor dip. The bulls will now try to push the price above $160 and resume the uptrend. The rising 20-EMA and the RSI in the positive territory indicate that the path of least resistance is to the upside.
Contrary to this assumption, if the price turns down from the overhead resistance and slips below $143, the selling could pick up momentum. The pair could then drop to the critical support at $135.
The views and opinions expressed here are solely those of the author and do not necessarily reflect the views of Cointelegraph. Every investment and trading move involves risk, you should conduct your own research when making a decision.
Since Russia began its unprovoked attack, bitcon, has risen and dipped within the $37,000 to $45,000 price range that it entered in late January. “It’s been another range-bound, indecisive week for Bitcoin and the crypto markets where the market leader has failed to make any meaningful headway on the upside,” wrote Joe DiPasquale, the CEO of fund manager BitBull Capital, in a text to CoinDesk. He added: “The current price action is typical during bearish phases, as was seen in May, June and July, and often precedes strong price bottoms.”
The leader in news and information on cryptocurrency, digital assets and the future of money, CoinDesk is a media outlet that strives for the highest journalistic standards and abides by a strict set of editorial policies. CoinDesk is an independent operating subsidiary of Digital Currency Group, which invests in cryptocurrencies and blockchain startups. As part of their compensation, certain CoinDesk employees, including editorial employees, may receive exposure to DCG equity in the form of stock appreciation rights, which vest over a multi-year period. CoinDesk journalists are not allowed to purchase stock outright in DCG.
XRP price risks dropping by more than 25% in the coming weeks due to a multi-month bearish setup and fears surrounding excessive XRP supply.
XRP descending triangle
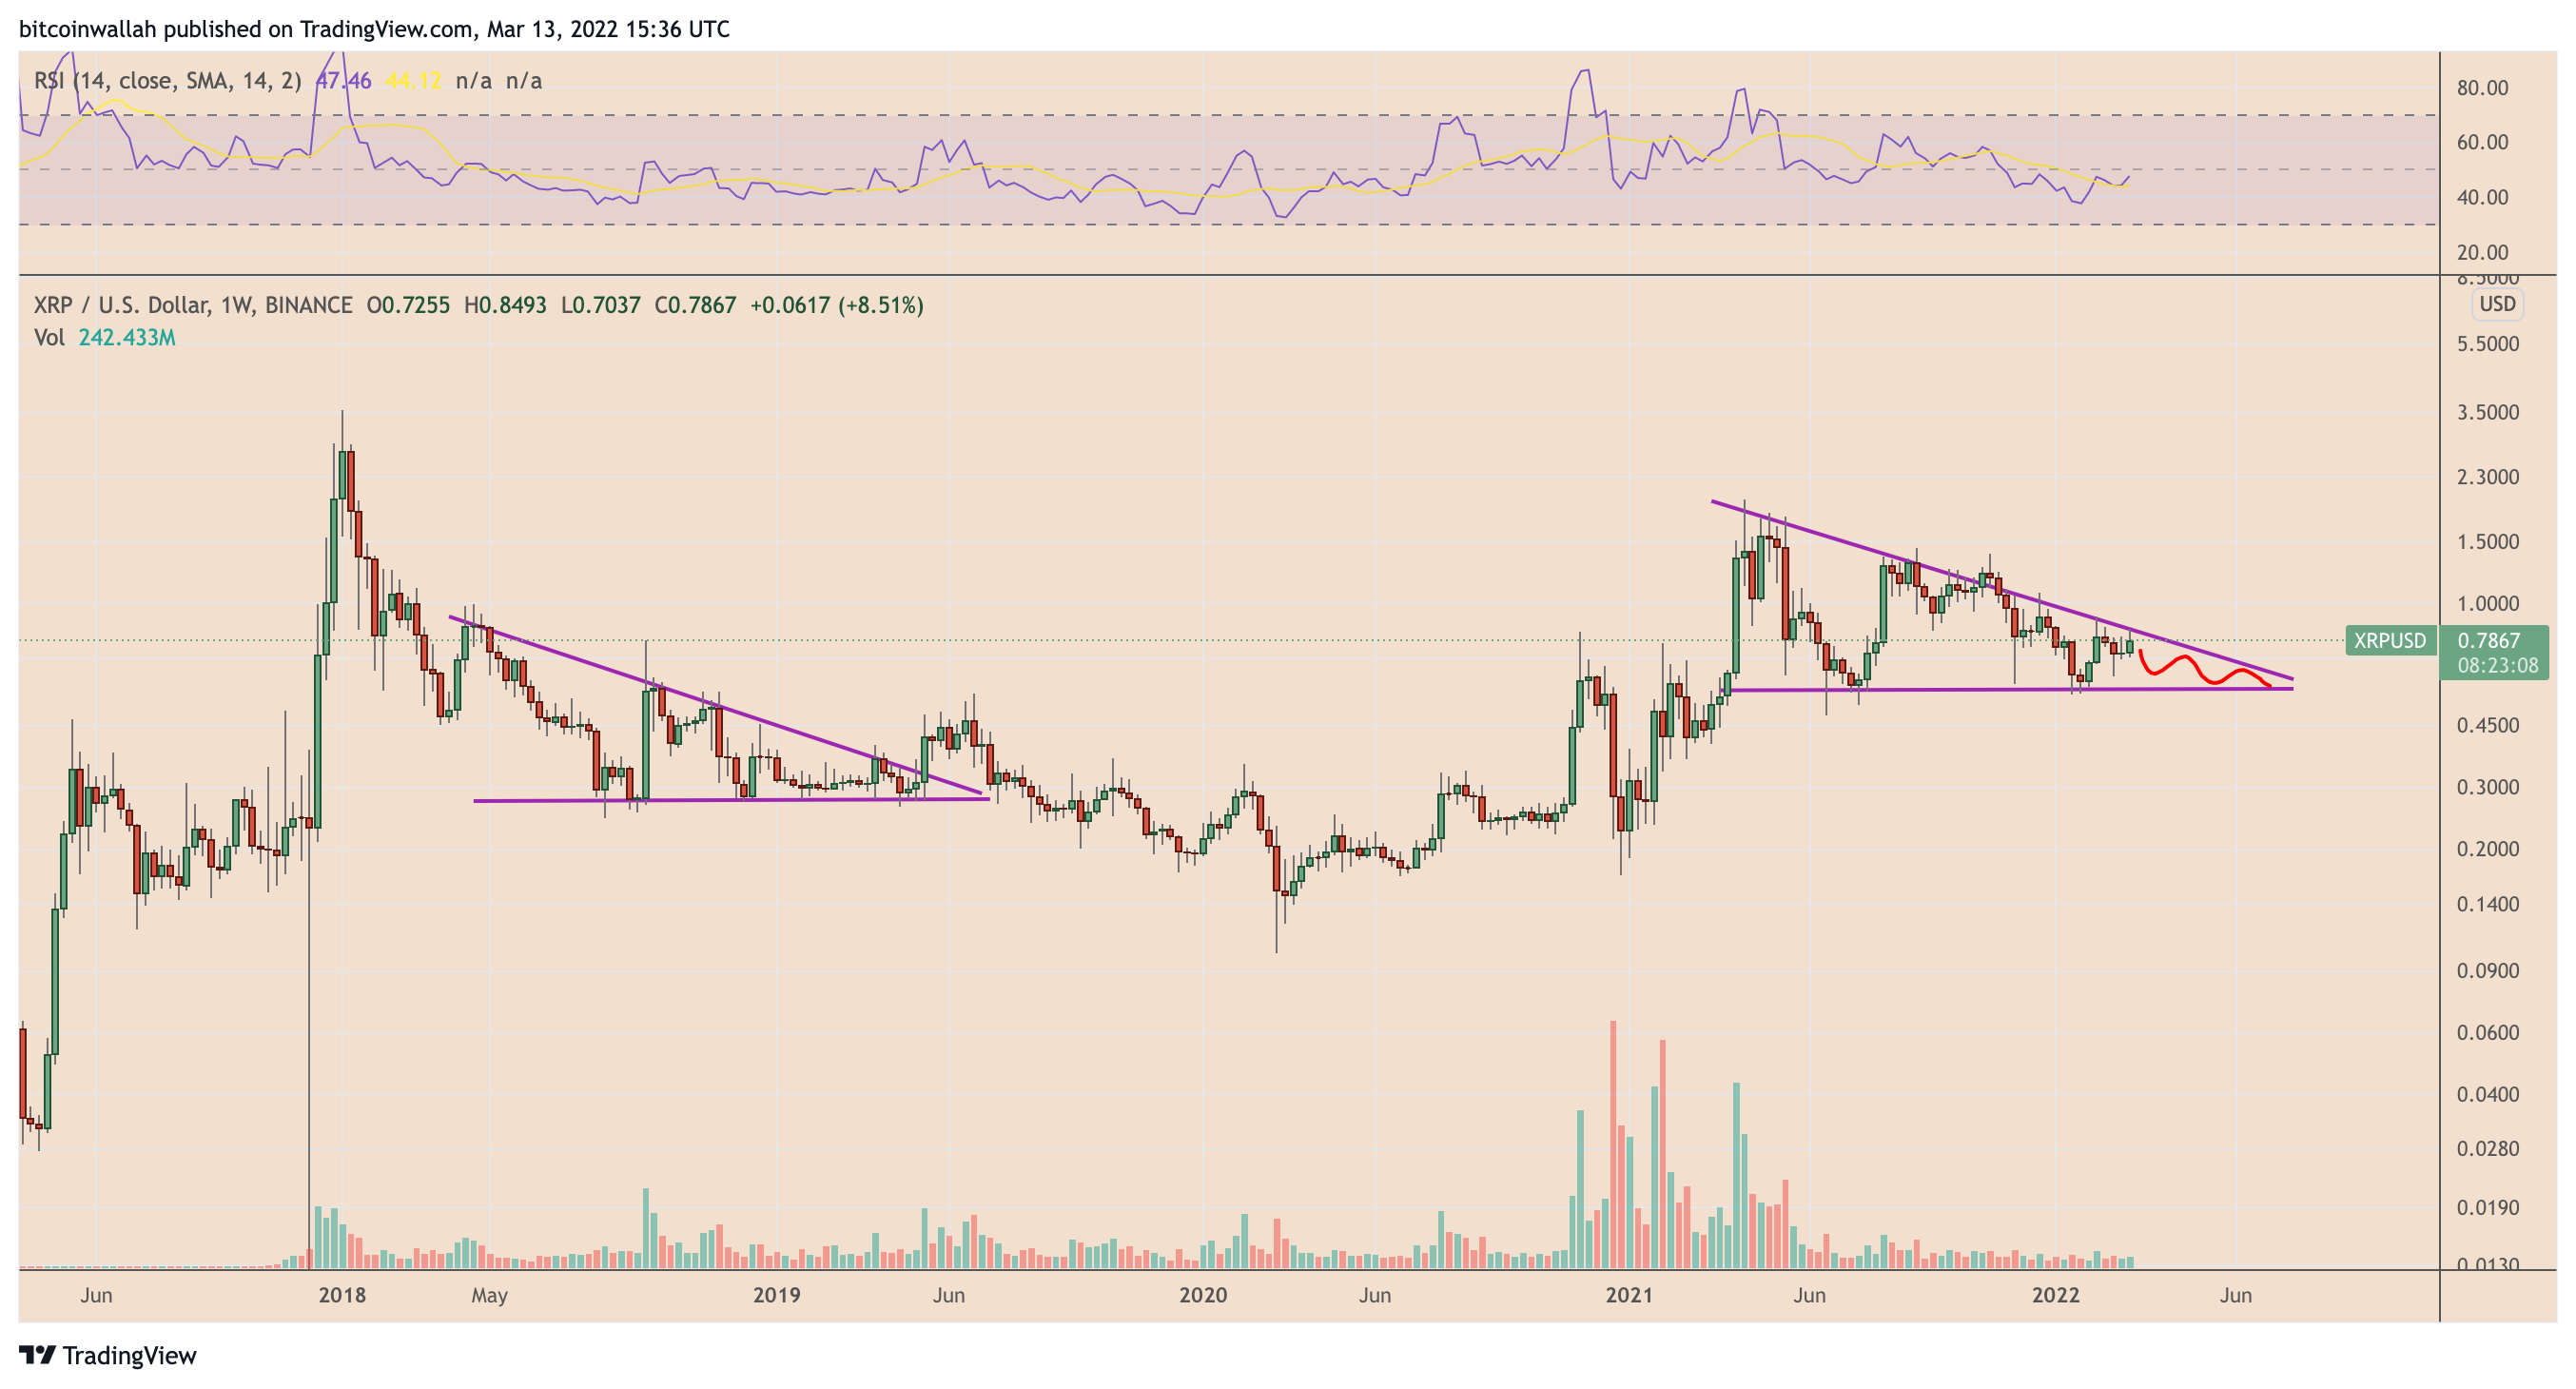
XRP has been consolidating inside a descending triangle pattern since topping out at its second-highest level to date — near $1.98 — in April 2021.
In doing so, the XRP/USD pair has left behind a sequence of lower highs on its upper trendline while finding a solid support level around $0.55, as shown in the chart below.
In the week ending March 13, XRP’s price again tested the triangle’s upper trendline as resistance, raising alarms that the coin could undergo another pullback move to the pattern’s support trendline near $0.55, amounting to a drop between 25% and 30%.
The downside outlook also takes cues from other bearish catalysts that has emerged around the triangle resistance.
For instance, XRP formed a bearish hammer on March 12, a single candlestick pattern with a small body and a long upside wick, suggesting lower buying pressure near the coin’s week-to-date top of around $0.85.
Additionally, the price turned lower after testing a confluence of resistances defined by its 20-week exponential moving average (20-week EMA; the green wave) and its 50-week EMA (the red wave), as shown in the attached image below.
XRP/USD weekly candle price chart with moving average resistances. Source: TradingView
Excessive supply FUD
More downside cues for XRP come after Ripple Labs locked 800 million XRP in escrow as a part of its programmed schedule for withdrawals.
The blockchain payment company moved around 100 million XRP worth nearly $40 million to exchange wallets on March 3. Meanwhile, it kept the other 700 million XRP (worth around $550 million) in an escrow account, raising anticipations that at least 200 million XRP would be flooded into the market to generate funds for Ripple’s operational expenses, as well as to distribute XRP among Ripple’s global clientele.
Meanwhile, it kept the other 700 million XRP (worth around $550 million) in an escrow account, raising anticipations that at least 200 million XRP would enter the market to generate funds for Ripple’s operational expenses, as well as to distribute XRP among Ripple’s global clientele.
I understood there are some 800 million $XRP that are locked up and ready to be sold…someone should check the increase in circulating supply to verify this
The selloff fears originated from the XRP price’s earlier response to unexpected supply hikes. For instance, XRP/USD fell by more than 50% to near $0.60 four months after its net supply in circulation increased from 40.46 billion to over 47 billion in just two days.
XRP circulating supply. Source: Messari
Nonetheless, Ripple’s withdrawal of 800 million XRP has not yet been reflected in its net circulating supply.
Profit-taking risks mount
Another catalyst that hints XRP’s price could fall 25-30% to reach its descending triangle target is a Santiment indicator that tracks social media trends and their impact on market trends.
XRP price versus $XRPNetwork trend. Source: Santiment
XRP’s price rose by over 15% week-to-date on March 12, notes Santiment, alongside a large spike in social media searches for the hashtag #XRPNetwork, suggesting that it could follow up with a potential selloff ahead. Excerpts:
“Historically, our social trends indicate that profit-taking is justified whenever the crowd makes the #XRPNetwork a top topic.”
The views and opinions expressed here are solely those of the author and do not necessarily reflect the views of Cointelegraph.com. Every investment and trading move involves risk, you should conduct your own research when making a decision.