The spread between the six-month ether and bitcoin implied volatilities fell to a two-year low of 13%, perhaps indicating that the cryptocurrencies’ fortunes are more strongly tied to each other than before. Implied volatility refers to investors’ expectations for price turbulence over a specific period.
A digital asset’s price rally rarely comes out of the blue. Before the token’s market value explodes, some collateral forces come into motion. The asset can suddenly attract abnormally high online attention, its trading volume can go up dramatically, or some market-moving information can go public that triggers the first two examples. Mastering the art of crypto trading means learning to see those subtle cues early on.
Spiking trading volume is one of the signs that something interesting might be brewing around a crypto asset. Often, trading volume simply follows a price trend, with the coin entering a virtuous circle where its rallying price attracts more traders, boosting the volume accordingly. In other cases, abnormally high volume points to robust liquidity and rising investor interest, which can underpin further waves of appreciation.
One of the ways to get alerted to potentially informative trading volume pumps is the Unusual Trading Volume bar on the dashboard of Cointelegraph Markets Pro, Cointelegraph’s subscription-based data intelligence platform.
Last week, four out of the 10 tokens that showed the greatest increase in week-to-week trading volume flashed weekly volume highs before their prices peaked. Here’s how traders could have profitably put this information to work.
RUNE: Big news boosts both trading volume and price
RUNE price (blue) vs. trading volume (purple), Feb. 25 – March 4. Source: TradingView/The TIE
THORChain’s RUNE had a big week, with a Terra integration and upcoming mainnet launch exerting huge upside pressure on the token’s price. The breakthrough moment came on March 1 when RUNE took off from around $3.70 and breached $5.80 in less than a day. Trading volume spiked alongside the price, with the highest volume of the week coming after the first price peak. Traders who took heed of the volume dynamics were in for a continued rally, as the token’s price remained up, breaching the $6 mark on March 4.
FUN: Two trading volume pumps amid a rolling rally
FUN price (blue) vs. trading volume (purple), Feb. 25 – March 4. Source: TradingView/The TIE
The price of Funfair’s FUNToken (FUN) steadily went up throughout the entire week, with two trading volume spikes reassuring traders that strong fundamentals fueled the token’s appreciation. The first came on Feb. 28 and preceded a local price peak at $0.0103 registered on March 1. Two days later, an even larger trading volume wave hit, foreshadowing the week’s price high of $0.0105.
WAVES: Volume spikes following price pump, anticipates even bigger one
WAVES price (blue) vs. trading volume (purple), Feb. 25 – March 4. Source: TradingView/The TIE
WAVES added upward of 80% to its value over last week, thanks to the Waves platform’s ongoing transition to version 2.0, a bullish partnership with Allbridge that will ensure cross-chain interoperability, and the news of the launch of Waves Labs, a $150 million fund that will support the project’s growth in the United States market. On March 1, the token’s price soared from around $13 to over $19 in less than a day, triggering a corresponding pump in trading volume. Even as the wave of liquidity subsided, the price action remained robust, with the token’s valuation going further up to its weekly high at $20.86.
KNC: Strong price momentum following trading volume spike
KNC price (blue) vs. trading volume (purple), Feb. 25 – March 4. Source: TradingView/The TIE
Kyber Network Crystal (KNC), the utility and governance token of Kyber Network, massively rallied on Feb. 28, dragging the token’s trading volume with it. The volume peaked against a price of $2.51, but the feast carried on as the price continued to soar all the way up to $2.91.
Cointelegraph Markets Pro’s Unusual Trading Volume panel, March 10. Source: Cointelegraph Markets Pro
In addition to the raw data on trading volume outliers available on the Cointelegraph Markets Pro dashboard, the trading volume metric is one of the core components of the VORTECS™ Score. An algorithmic tool for comparing historical and present market conditions around digital assets, the VORTECS™ Score can be used to identify historically bullish or bearish setups around each digital asset it tracks, alerting traders to the coins with the most favorable outlooks.
Cointelegraph is a publisher of financial information, not an investment adviser. We do not provide personalized or individualized investment advice. Cryptocurrencies are volatile investments and carry significant risk including the risk of permanent and total loss. Past performance is not indicative of future results. Figures and charts are correct at the time of writing or as otherwise specified. Live-tested strategies are not recommendations. Consult your financial adviser before making financial decisions.
The leader in news and information on cryptocurrency, digital assets and the future of money, CoinDesk is a media outlet that strives for the highest journalistic standards and abides by a strict set of editorial policies. CoinDesk is an independent operating subsidiary of Digital Currency Group, which invests in cryptocurrencies and blockchain startups. As part of their compensation, certain CoinDesk employees, including editorial employees, may receive exposure to DCG equity in the form of stock appreciation rights, which vest over a multi-year period. CoinDesk journalists are not allowed to purchase stock outright in DCG.
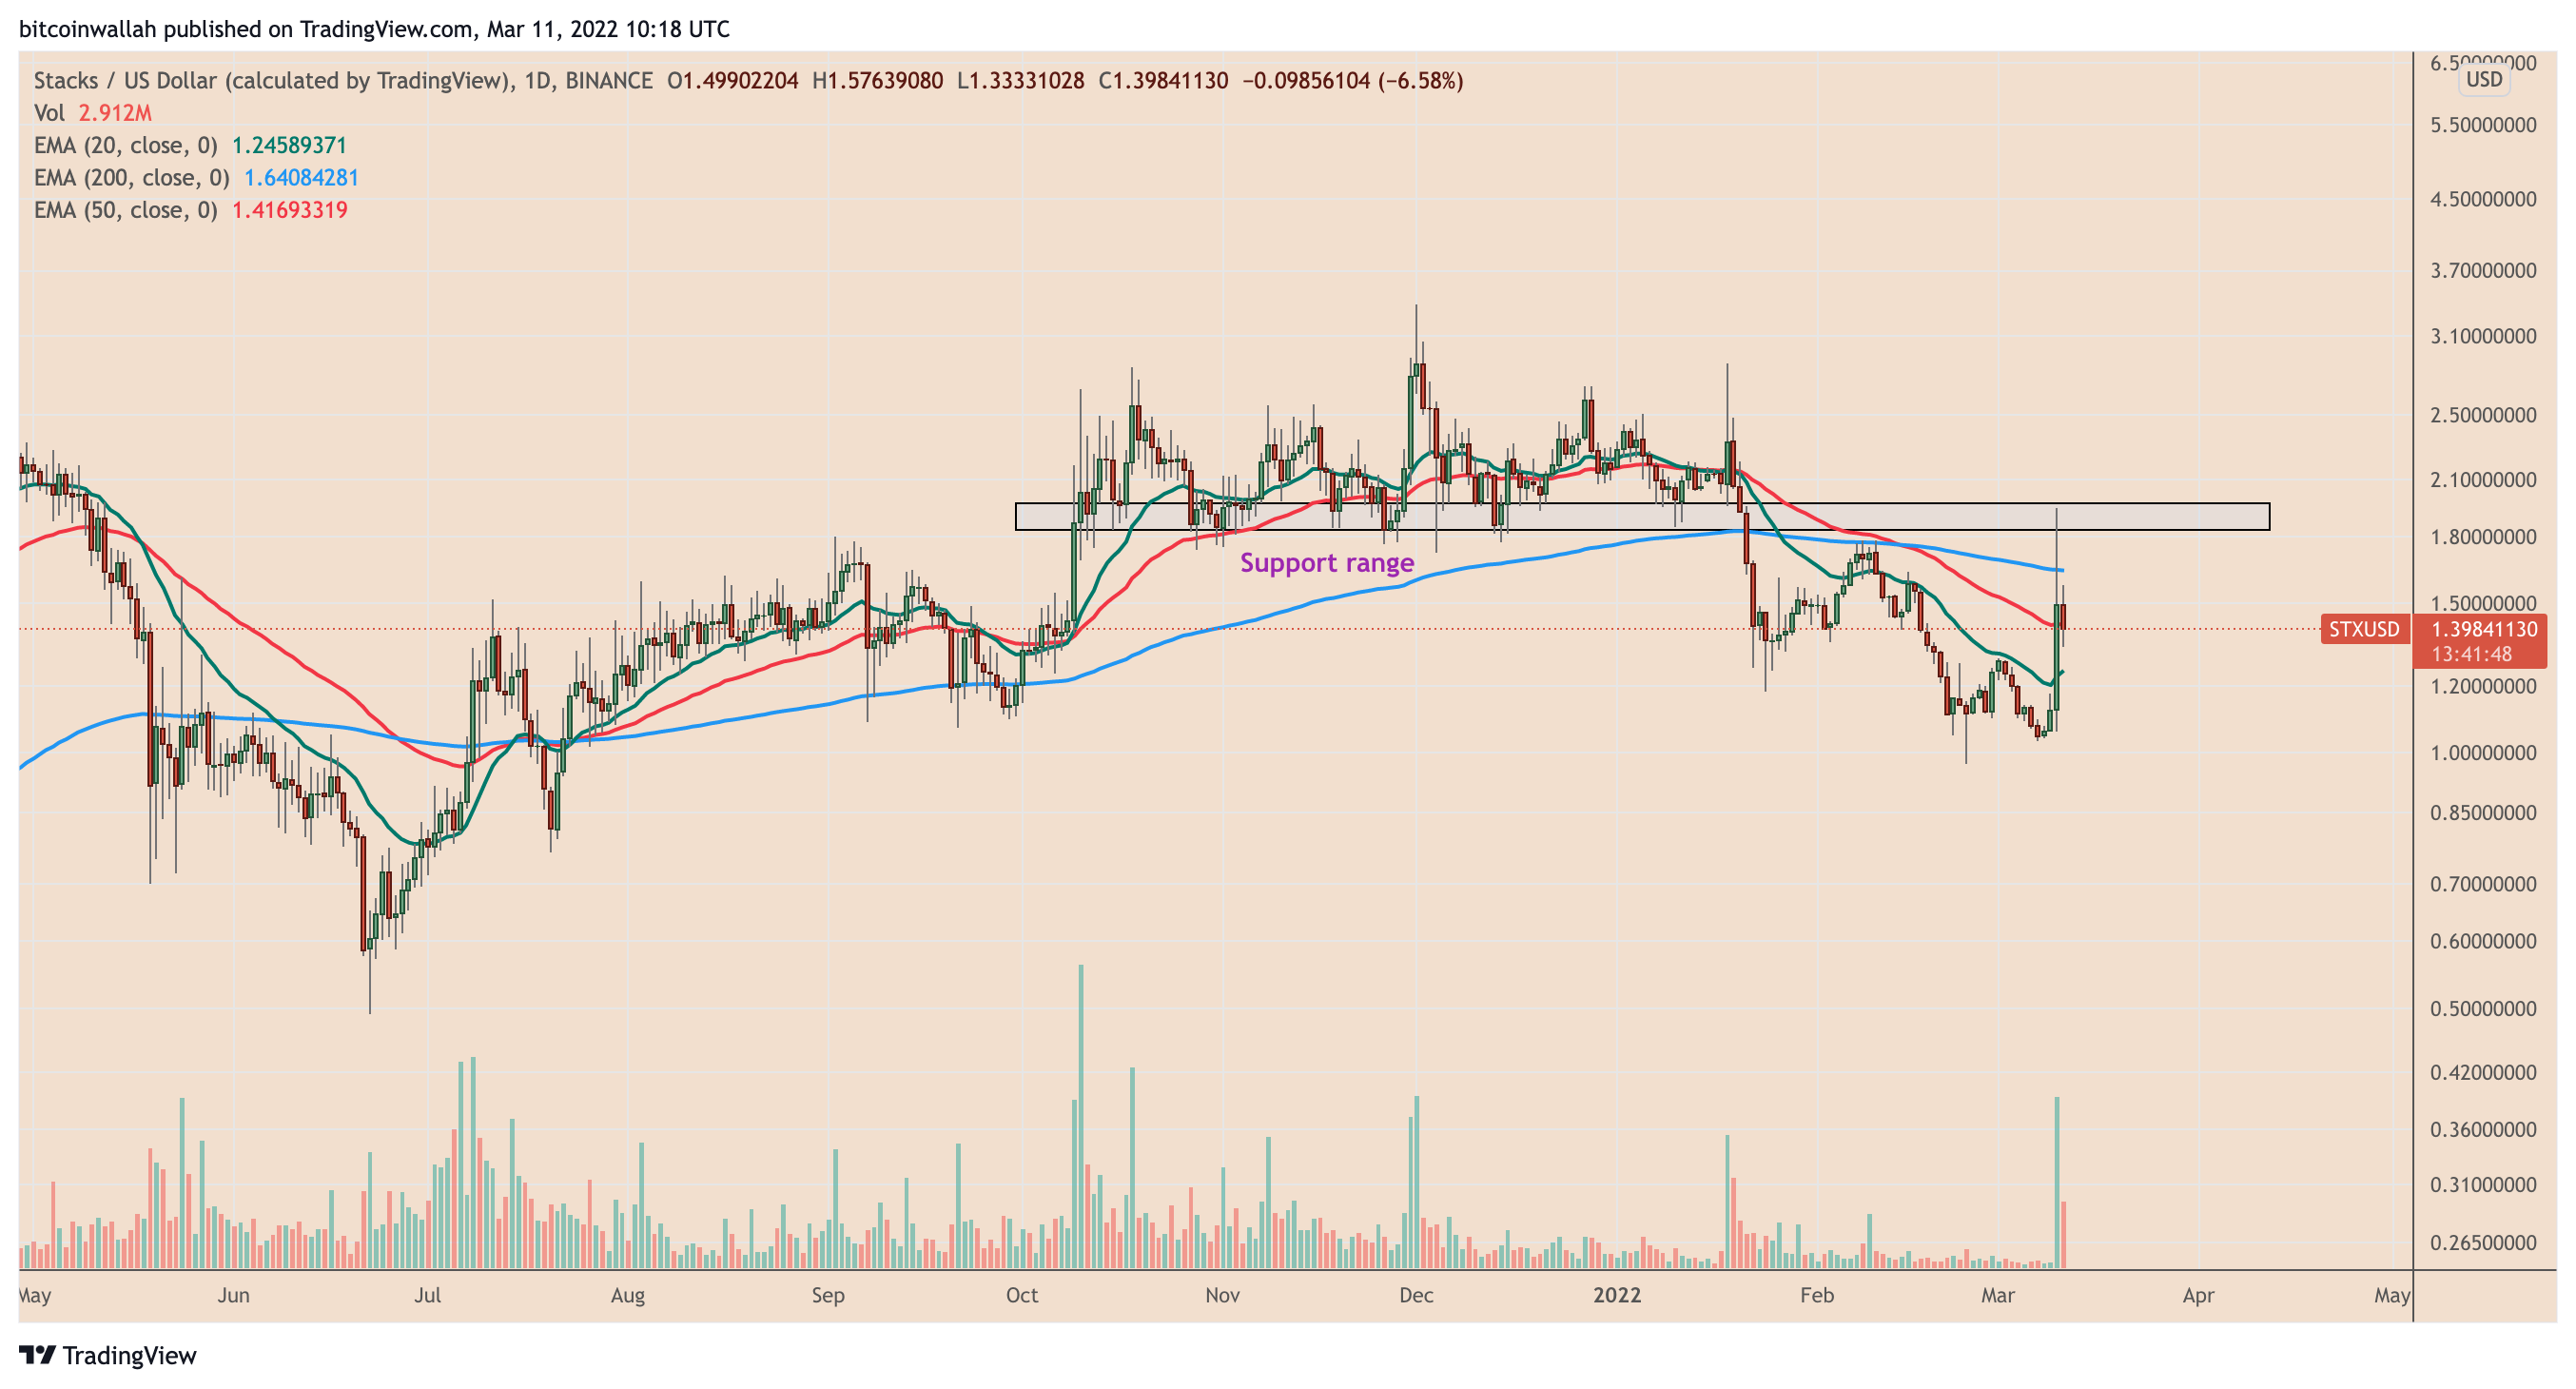
Stacks (STX) pared a considerable portion of the gains it made on March 10 as the euphoria surrounding its $165 million pledge to support Bitcoin (BTC) projects showed signs of fading.
STX’s price dropped by over 30% to reach a level as low as $1.33 on Friday when measured from its week-to-date high of $1.94. The selloff, in part, appeared technical as the $1.94-top fell in the same range that served as solid support between October 2021 and January 2022, only to flip later to become a resistance area.
STX/USD daily price chart. Source: TradingView
It also appears that traders spotted selling opportunities due to STX’s long wick candlestick on March 10. Stacks rallied by as much as 73% into the day while forming a disproportionally long bullish wick on the daily chart that hinted at upside exhaustion.
What pushed STX higher?
The rally in the STX market on March 10 coincided with the launch of “Bitcoin Odyssey,” a $165 million fund to develop Web3, decentralized finance (DeFi), and nonfungible token (NFT) projects on the Bitcoin blockchain by harnessing Stacks’ open-source network for Bitcoin-based smart contracts.
Notably, STX serves as a utility token inside the Stacks ecosystem to pay for network activity and contract execution. STX owners can also stake their holdings on the Stacks network via “Stacking” to support its blockchain’s consensus mechanism. In return, they earn BTC rewards.
It appears traders flocked to purchase STX en masse, anticipating a rise in its demand after the Bitcoin Odessey’s launch. For instance, cryptocurrency exchange OKcoin, the main backer behind the $160-million-fund, promoted the Stacks token for its bullish outlook, saying it is “not a bad time to get in on” Stacks.
All-time high ahead?
Interestingly, STX’s ongoing price rally appeared at a confluence of two key support levels, with at least one suggesting that the Stacks token is heading to a new all-time high next.
This confluence comprises an upward sloping trendline that has acted as an accumulation point for traders since early 2020 and the 0.5 Fib line (near $1.50) of the Fibonacci retracement graph made from $0.04-swing low to $2.82-swing high.
STX/USD weekly price chart. Source: TradingView
STX now looks to close above its two interim exponential moving averages (EMA) — the 20-week (green) and the 50-week (red) EMAs — following its rebound from the dual-support area. A successful breakout may have the Stacks token retest another upward sloping trendline that has served as a resistance level since 2020.
Conversely, a pullback from the 20-50 EMA resistances could have STX break below its ascending trendline support toward 0.786 Fib line near $0.63.
The views and opinions expressed here are solely those of the author and do not necessarily reflect the views of Cointelegraph.com. Every investment and trading move involves risk, you should conduct your own research when making a decision.
The leader in news and information on cryptocurrency, digital assets and the future of money, CoinDesk is a media outlet that strives for the highest journalistic standards and abides by a strict set of editorial policies. CoinDesk is an independent operating subsidiary of Digital Currency Group, which invests in cryptocurrencies and blockchain startups. As part of their compensation, certain CoinDesk employees, including editorial employees, may receive exposure to DCG equity in the form of stock appreciation rights, which vest over a multi-year period. CoinDesk journalists are not allowed to purchase stock outright in DCG.
The leader in news and information on cryptocurrency, digital assets and the future of money, CoinDesk is a media outlet that strives for the highest journalistic standards and abides by a strict set of editorial policies. CoinDesk is an independent operating subsidiary of Digital Currency Group, which invests in cryptocurrencies and blockchain startups. As part of their compensation, certain CoinDesk employees, including editorial employees, may receive exposure to DCG equity in the form of stock appreciation rights, which vest over a multi-year period. CoinDesk journalists are not allowed to purchase stock outright in DCG.
The leader in news and information on cryptocurrency, digital assets and the future of money, CoinDesk is a media outlet that strives for the highest journalistic standards and abides by a strict set of editorial policies. CoinDesk is an independent operating subsidiary of Digital Currency Group, which invests in cryptocurrencies and blockchain startups. As part of their compensation, certain CoinDesk employees, including editorial employees, may receive exposure to DCG equity in the form of stock appreciation rights, which vest over a multi-year period. CoinDesk journalists are not allowed to purchase stock outright in DCG.
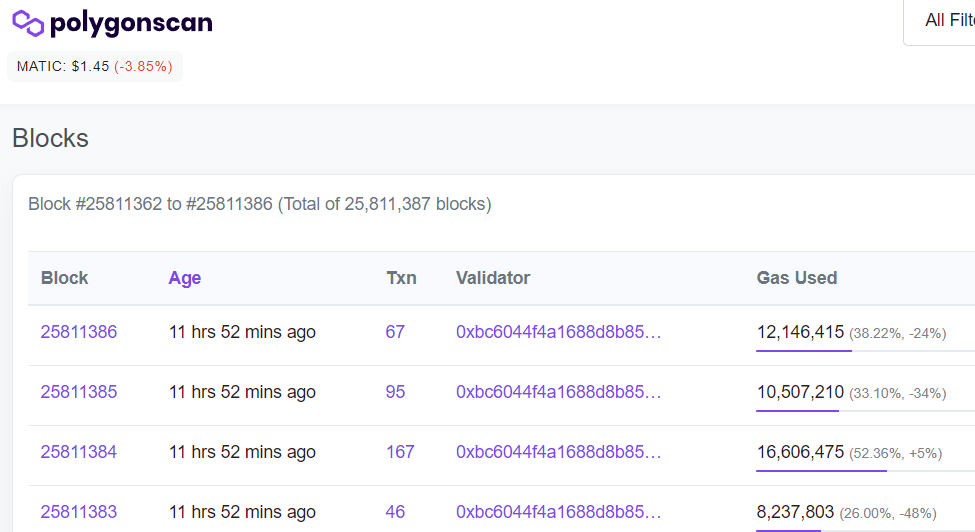
Layer-2 Ethereum scaling solution Polygon has not produced a new block for over 11 hours, with developers attributing the issue to a technical upgrade on the network.
On March 10 at 4:20 pm UTC, Polygon (MATIC) network developers notified users on the project’s forum that there would likely be downtime starting at about 5:50 pm UTC due to maintenance required on one of the network’s three layers. A recent upgrade is thought to have caused an error in the network’s ability to achieve consensus.
“We suspect there may have been a bug in the upgrade which affected consensus and caused different Heimdall validators to be on different versions of the chain, thereby not reaching 2/3 consensus.”
As expected, the outage began at about 5:54 pm UTC.
The Polygon team issued an update at about 1:30 am UTC explaining that it was still working to fix the error and that a hotfix was deployed to help continue making blocks. That hotfix does not appear to have taken effect as of the time of writing.
The team also assured users that all funds and data on-chain are safe.
A network outage on Polygon has lasted for 11 hours.
Polygon users apparently understood the outage was expected, but by the sixth hour, rumblings began to appear among the community. Most users have pointed out concerns at the extended amount of time for the outage.
So uhhhhh…..Polygons been down for 6 hours and counting….
Others have noted that their profession or crypto business has been negatively affected by the outage. Twitter user @Miklos211 said:
“I’m literally unable to work thanks to that, could you please send us a time where we can expect the network to be back on?”
The Polygon network consists of three layers that each serves a unique role. Smart contracts run on the Ethereum (ETH) layer and the Bor layer helps produce blocks. The third Heimdall layer is where the problem lies.
Heimdall is a set of proof-of-stake (PoS) nodes that help the network reach consensus. With the Heimdall issue, Polygon cannot reach network consensus.
In related news, Polygon recently partnered with the multichain music nonfungible tokens (NFT) marketplace TokenTraxx to support the marketplace in the Polygon ecosystem. TokenTraxx will allow musicians to tokenize their work and sell it as NFTs.
The price of Brent crude, a key measure of global oil supply, was selling near $110 per barrel, well off its high of $130 earlier this week but well over its range just a month ago. In the U.S., inflation accelerated in February to a fresh four-decade high, signaling supply and demand imbalances were little improved amid soaring gas prices. The Consumer Price Index rose 7.9% over the past 12 months, the fastest since 1982, the U.S. Labor Department’s Bureau of Labor Statistics reported Thursday.
At the point that OnlyFans made the 500 ETH donation, the DAO was stalled at about half of the 1,000 ETH reserve amount, a representative said. The OnlyFans donation pushed the amount over the top, and from that point on, more donations began to pile in.