Author: BTCLFGTEAM

  • Bitcoin near $95K despite tariff woes, analyst concern

    Bitcoin near $95K despite tariff woes, analyst concern

    Crypto news today: Bitcoin tops $95K, stocks rally despite analyst's 'blind market' warning

    • Bitcoin traded above $95,400 Tuesday, showing resilience despite economic concerns.
    • US stocks (S&P 500, Nasdaq +0.55%) also continued their recovery from early April tariff fears.
    • Consumer confidence hit lowest since May 2020; JOLTS job openings missed estimates.

    Cryptocurrency markets displayed notable stability on Tuesday, seemingly unfazed by mounting pessimism regarding the economic impact of the Trump administration’s tariff policies.

    Bitcoin edged higher, reclaiming ground above $95,000, while traditional stock markets also continued a recovery trend, prompting some analysts to question whether markets are accurately pricing in underlying economic risks.

    Markets march higher despite warning signs

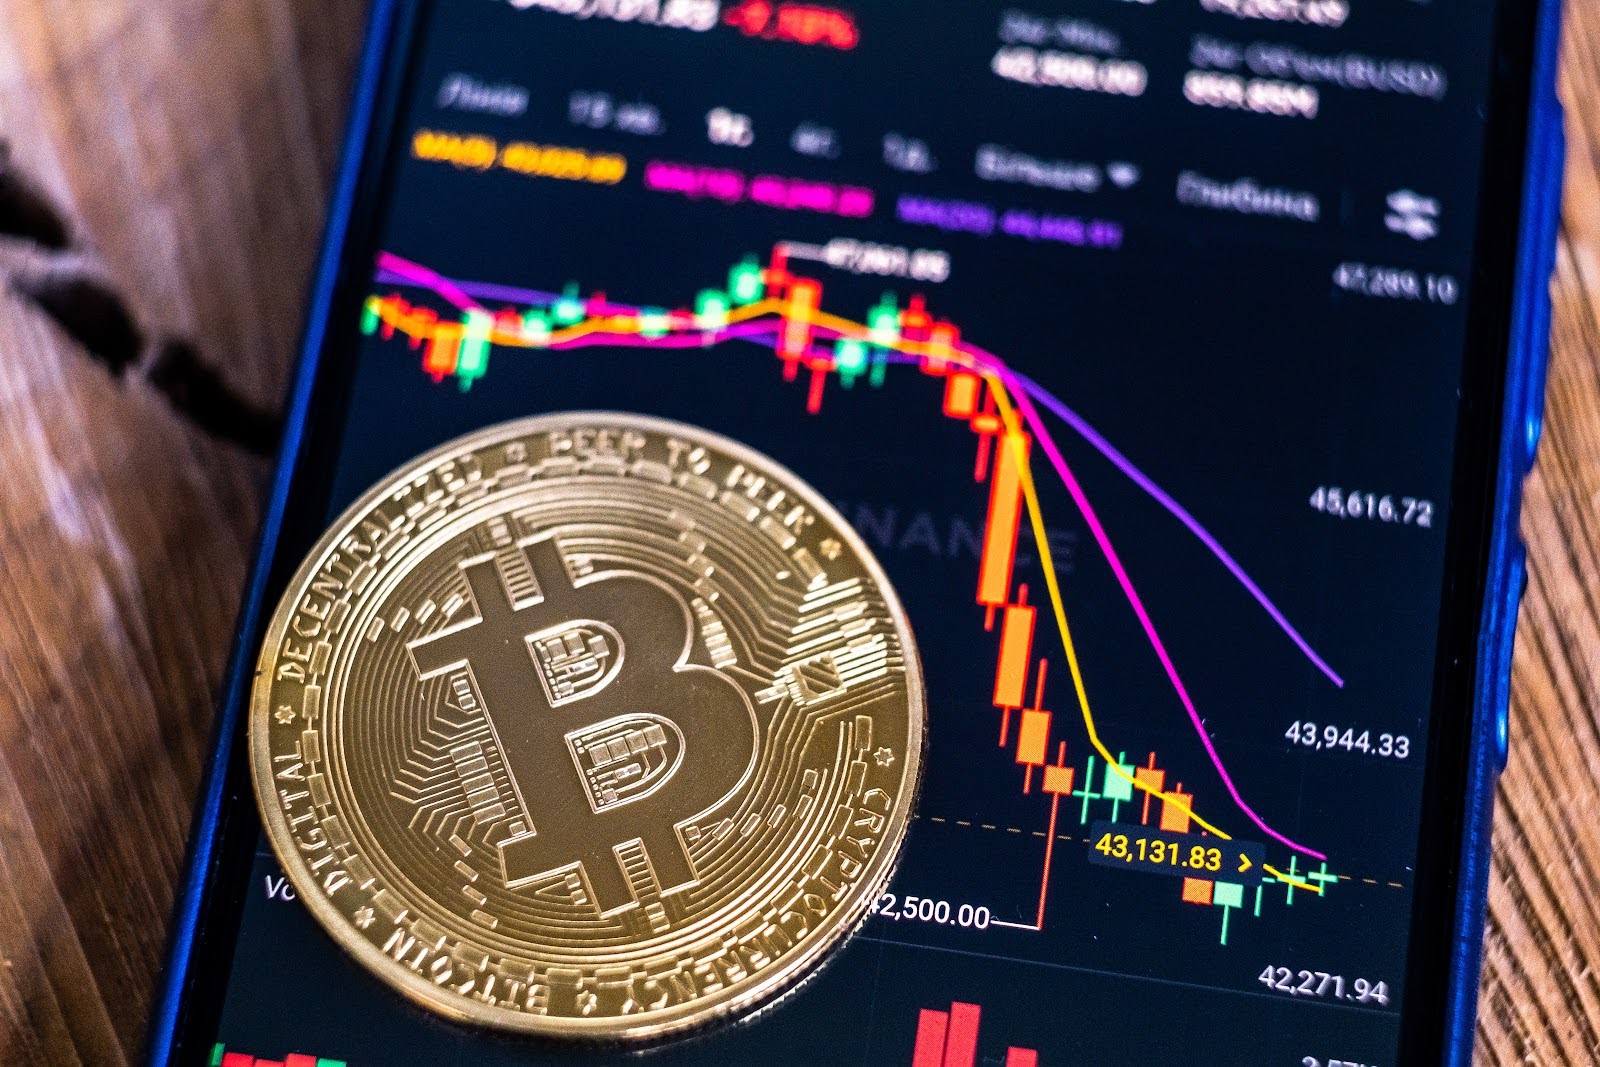
    Bitcoin (BTC) continued its recent positive momentum, gaining about 1% over the preceding 24 hours to trade near $95,400.

    This move brought the key $96,000 level – last seen in late February – within striking distance.

    The broader crypto market showed similar resilience, with the CoinDesk 20 index advancing 1.1%.

    Bitcoin Cash (BCH) stood out with a significant 6.3% surge.

    Crypto-related equities also participated, albeit modestly, with Coinbase (COIN) up 0.9% and MicroStrategy (MSTR) adding 3.3%, while Janover (JNVR) continued its strong run (+16%) linked to its Solana accumulation strategy.

    This relative calm in digital assets mirrored strength in traditional equities.

    Both the S&P 500 and the Nasdaq composite posted gains of 0.55%, extending the recovery from the tariff-induced panic seen earlier in April.

    Economic data paints sobering picture

    However, this market buoyancy unfolded against a backdrop of increasingly concerning economic indicators, suggesting a potential slowdown possibly linked to the White House’s tariff strategies.

    The Conference Board reported that US consumer confidence plummeted to its lowest level since May 2020, with the forward-looking consumer outlook component hitting its weakest point since 2011.

    Simultaneously, the latest Job Openings and Labor Turnover Survey (JOLTS) indicated a cooling labor market, with job openings falling to 7.19 million in March, significantly below the expected 7.5 million.

    Adding to the complex policy environment, Secretary of Commerce Howard Lutnick mentioned Tuesday that a trade deal had been reached with an unspecified country, though he noted it still required ratification, offering little immediate clarity on the broader tariff situation.

    Analyst warns of market ‘blindness’ to fundamental risks

    This apparent disconnect between market performance and weakening economic data has raised red flags among some observers.

    Jeff Park, head of Alpha Strategies at digital asset investment firm Bitwise, expressed strong concern about the market’s perspective.

    “Hard to fathom how blind the market really is,” Park posted on the social media platform X (formerly Twitter).

    He argued that the market’s intense focus on potential Federal Reserve interest rate cuts misses a larger, more fundamental risk.

    “A Fed cut means nothing if US creditworthiness is permanently impaired by the global community as resulted by dollar weaponization,” Park elaborated, linking the potential damage to Trump administration policies that leverage the dollar’s global role.

    He suggested that speculation about whether the Fed might be forced to cut rates to offset tariff impacts is misplaced.

    “That’s the mispricing we are talking about here,” he continued.

    The myopic focus on whether [we] are getting a fed cut in May/June is completely irrelevant if the notion of the risk-free as we know it is fundamentally challenged forever, which means cost of capital globally is going higher.

    Park’s comments highlight a deeper concern: that markets might be rallying on short-term hopes (like potential rate cuts) while ignoring potentially severe, longer-term structural damage to the US financial standing and the global cost of capital caused by ongoing policy uncertainty and aggressive trade tactics.

    While Bitcoin holds firm near recent highs, the debate continues over whether current market strength reflects genuine resilience or a dangerous disregard for underlying economic headwinds.

    Source link

  • SIGN price rallies 80% as top crypto exchanges add token

    SIGN price rallies 80% as top crypto exchanges add token

    • Sign (SIGN) price has jumped more than 80% amid multiple exchange listings, including on South Korea’s largest crypto exchange.
    • Upbit plans to list SIGN trading pairs for Korean won, Bitcoin and Tether (USDT).
    • Profit taking could derail Sign price momentum.

    Sign (SIGN) is up more than 80% in the past 24 hours, skyrocketing as multiple exchanges and trading platforms list the token.

    As of writing, the SIGN token traded near $0.13, up 85% and likely to rally further following its listing on Upbit, the largest cryptocurrency exchange in South Korea.

    Market buzz as Sign surges

    Sign is an omni-chain attestation protocol designed to power on-chain claims for identity, ownership, and credentials.

    The Sign Protocol, which operates across multiple blockchains, aims to make attestation technology more accessible and user-friendly, embedding it into everyday digital interactions.

    With services like Token Table for on-chain token distribution, EthSign for web3 signing, and the Sign Protocol for omni-chain attestation.

    Meanwhile, the Sign (SIGN) token is the platform’s native token, used for gas fees, staking and airdrop rewards.

    SIGN token’s remarkable price rally comes as Upbit, South Korea’s largest cryptocurrency exchange, announced the listing of the token.

    It joins other platforms, including Bitget, Bitrue and Gate.io in adding support for the token.

    The hype amid these developments have seen Sign’s token price jump sharply.

    Upbit plans to list SIGN with Korean won (KRW), Bitcoin (BTC), and Tether (USDT) trading pairs.

    Upbit said in a notice that deposits/withdrawals will open three hours after the announcement.

    However, the exchange did not provide an exact listing time for the token.

    Why does Upbit listing matter?

    South Korea is a major hub for crypto trading, and Upbit’s dominant position in the market has given SIGN a significant boost.

    The exchange’s decision to support SIGN reflects growing confidence in the project’s potential, especially given the fact that South Korean investors have historically shown massive enthusiasm for digital assets. Its listing of the token could help push prices higher.

    Notably, the trading volume of Sign (SIGN) has reached over $658 million, representing a staggering 1,462,136% increase in 24 hours.

    CoinGecko analysts indicate the spike signals a sharp rise in sentiment and market activity.

    Analysts are optimistic about its short-term trajectory, given the heightened trading volume and market interest.

    Price discovery may see buyers extend beyond $0.13, with momentum continuation benefiting from overall market performance.

    However, monitoring of whale activity could be key as is the fact that a reversal amid profit taking may be equally sharp and painful.


    Source link

  • Bitcoin rally gains steam above $95K amid Fed pressure, tariff worries

    Bitcoin rally gains steam above $95K amid Fed pressure, tariff worries

    Trump speech looms: can Bitcoin leverage exchange outflows, safe haven status for $100K?

    • Bitcoin climbed above $95,490 Monday ahead of Trump’s 100-day speech, eyeing policy clarity.
    • Potential confirmation of a US Bitcoin strategic reserve could be a major catalyst towards $100K.
    • Bitcoin shows resilience (YTD +5.6%) vs. US stocks (YTD -5%) amid tariff uncertainty, boosting safe-haven appeal.

    Bitcoin demonstrated renewed strength on Monday, climbing back above the significant $95,000 mark as the broader financial markets turned their focus towards President Donald Trump’s upcoming 100-day policy review speech.

    Amidst a complex macroeconomic backdrop shaped by Trump’s second term policies, on-chain data showing significant Bitcoin withdrawals from exchanges added fuel to bullish sentiment, prompting speculation about a potential push towards the $100,000 milestone.

    Anticipation builds ahead of Trump’s 100-day review

    After a period of consolidation, Bitcoin prices pushed higher, reaching levels above $95,490 according to CoinGecko data, marking an 0.8% gain over 24 hours and reflecting a robust 8.9% increase week-over-week.

    This price action mirrored gains seen in US equity markets, particularly among top technology stocks, as investors awaited clarity from Trump’s address.

    Crypto-related policies have been a notable feature of Trump’s second term thus far, and market participants are particularly keen for updates on proposals like the potential creation of a US Bitcoin strategic reserve.

    A definitive announcement confirming the strategic reserve initiative could serve as a powerful catalyst, potentially triggering a rapid (“parabolic”) move towards and beyond $100,000.

    Conversely, renewed emphasis on aggressive tariff strategies or drastic budget cuts in the speech could dampen overall market sentiment, potentially capping Bitcoin’s near-term upside despite its recent resilience.

    Macro crosscurrents: tariffs, inflation, and Fed pressure

    The first 100 days of Trump’s term have been marked by distinct policy trends influencing market dynamics.

    While US inflation has continued its downward trend (falling from a 9.1% peak in 2022 to 2.4% in March 2025, per TradingEconomics), Trump’s continued advocacy for tariffs – measures widely warned by economists as potentially inflationary – creates tension.

    The President has claimed victory over inflation while simultaneously pushing for policies that could reignite price pressures.

    This backdrop informs Trump’s recently intensified calls for the Federal Reserve to cut interest rates, including public pressure and threats aimed at replacing Fed Chair Jerome Powell.

    While these pronouncements have sparked market speculation, data from the CME FedWatch tool still indicates a dominant (90.1%) probability that the Fed will maintain current rates at its upcoming May 7 FOMC meeting.

    However, the administration’s focus on tariffs (“impose across-the-board tariffs on most foreign-made goods”) continues to inject uncertainty into US stock markets.

    This uncertainty appears to be bolstering Bitcoin’s narrative as a potential safe-haven asset, relatively insulated from direct geopolitical trade spats and supply chain disruptions.

    Notably, Bitcoin has posted year-to-date gains of 5.6%, contrasting with declines seen in the S&P 500 and Dow Jones indices (down 5% YTD) during the same period.

    Should Trump’s policies continue to foster volatility in traditional financial (TradFi) markets, Bitcoin’s perceived resilience could attract further capital inflows.

    On-chain flows signal accumulation?

    Adding weight to the bullish case is compelling on-chain data indicating significant Bitcoin movement off cryptocurrency exchanges.

    Analysis from CryptoQuant reveals that investors have withdrawn over $4 billion worth of Bitcoin from tracked exchange wallets since Trump’s recent calls for rate cuts began around April 22.

    Total exchange reserve balances reportedly fell from $237.8 billion to $233.8 billion during this period.

    This trend of coins leaving exchanges is often interpreted bullishly, as it suggests investors are moving Bitcoin into private storage (“cold wallets”) for longer-term holding rather than keeping it readily available for sale on trading platforms.

    This reduction in easily accessible supply, coupled with potentially steady or increasing demand triggers (like the safe-haven narrative or strategic reserve news), strengthens the argument for a potential price breakout.

    Bitcoin tests $95K resistance, eyes $100K breakout

    With demand factors seemingly active and exchange supply tightening, the technical picture comes into sharp focus. Bitcoin is currently testing the significant resistance zone around 95,000−95,500.

    Successfully overcoming and holding above this level is seen as crucial for confirming the next leg higher.

    The $100,000 psychological milestone remains the key upside target in the near term, with the confluence of macro uncertainty, potential policy catalysts from Trump’s speech, and supportive on-chain data suggesting the stage could be set for such a move.

    Source link

  • 1INCH price up 15% as BTC gains: what’s driving 1inch higher?

    1INCH price up 15% as BTC gains: what’s driving 1inch higher?

    • 1inch price performance amid market recovery
    • The 1INCH token has spiked 15% in the past week amid Bitcoin’s rise to above $95k.
    • Could a key 1inch Investments Fund development help 1INCH price higher?

    The 1inch Network token (1INCH) has seen an impressive 15% surge over the past week, reaching $0.2089 as of April 28, 2025.

    According to CoinMarketCap data, this includes a nearly 4% spike in the past 24 hours.

    It’s an upward movement that aligns with a broader crypto market recovery, currently seeing Bitcoin (BTC) hover above a key level.

    As 1inch price looks to break higher, other altcoins such as Casper are rallying.

    Meanwhile, BTC is bidding for an uptick towards $100k – the psychological level that could buoy altcoins in the short term.

    Currently, Bitcoin price sits around $95,218, up 1.9% in the past 24 hours and nearly 10% in the past week.

    With the overall market sentiment seeing bulls take charge, it’s altcoins like 1INCH that could ride a wave of positive momentum to go parabolic.

    Why is 1INCH surging today?

    As noted above, 1inch price has traded higher amid Bitcoin’s spike to above $95k.

    It’s an overall outlook that could continue to dictate bulls’ performance.

    However, a likely key driver behind 1INCH’s price surge is the strategic moves by 1inch’s Investment Fund.

    According to Spot On Chain, the fund recently rotated profits from Wrapped Bitcoin (WBTC) into $1INCH.

    The fund has sold 70.76 WBTC for 6.68 million USDC and then used 1.05M USDC to buy back 5.23 million 1INCH at the average buy price of $0.199.

    This move signals strong confidence in 1INCH’s future value, especially given the fund’s historical success in trading its own token. Previously, 1inch achieved a 118% profit from trading.

    Additional tailwinds for 1INCH may have come from 1inch’s announcement of a new mobile wallet feature.

    This recent update, which enhances web3 accessibility, might be a key driver of 1inch adoption, increasing demand for the native 1INCH token.

    1INCH price prediction

    From a technical perspective, 1INCH shows promising signs for continued growth.

    The Relative Strength Index (RSI) currently sits around 65, indicating that the token is nearing overbought territory but still has room before hitting extreme levels above 80.

    This suggests sustained buying pressure, though traders should watch for potential pullbacks if RSI climbs higher.

    1inch chart by TradingView


    Meanwhile, the Moving Average Convergence Divergence (MACD) displays a bullish crossover.

    As can be seen in the chart above, the MACD line is above the signal line and has a positive histogram, reinforcing the upward trend.

    The price is also hugging the upper Bollinger Band. Based on this, $1INCH could target $0.24 in the short term, a level it previously reached in 2024. If this happens, bulls may eye new highs.

    However, if overbought conditions trigger profit-taking, a dip to $0.18 might occur as a key support level.

    Source link

  • Crypto news today: Bitcoin bulls eye $100K breakout; SUI, AVAX charts show potential

    Crypto news today: Bitcoin bulls eye $100K breakout; SUI, AVAX charts show potential

    Crypto news today: Bitcoin bulls eye $100K breakout; SUI, AVAX charts show potential

    • Bitcoin gained over 10% this week, testing key resistance near $95,000 amid strong buying.
    • US Spot Bitcoin ETFs saw massive $3.06 billion weekly inflows, signaling renewed institutional interest.
    • Avalanche (AVAX) consolidates near $23.50 resistance; a breakout could target $31.73 (double-bottom).

    Bitcoin demonstrated renewed strength this week, posting gains of over 10% as determined buyers pushed the price back towards the significant overhead resistance level near $95,000.

    While consolidating below this key hurdle, the fact that buyers haven’t ceded significant ground suggests underlying bullish conviction, further supported by robust institutional inflows and optimistic analyst projections.

    ETF inflows signal renewed institutional appetite

    The sharp upward move in Bitcoin’s price has been significantly bolstered by resurgent buying activity in the US spot Bitcoin exchange-traded funds (ETFs).

    Data from Farside Investors revealed impressive weekly inflows totaling $3.06 billion into these funds.

    Commenting on this influx, Bloomberg ETF analyst Eric Balchunas highlighted on X (formerly Twitter) how notable it was to witness “HOW FAST the flows can go from 1st gear to 5th gear,” indicating a rapid acceleration in institutional demand.

    This renewed buying coincides with bullish technical and quantitative signals. 21st Capital co-founder Sina noted on X that Bitcoin had reclaimed its “power-law price,” a model suggesting considerable long-term upside.

    Sina’s Bitcoin Quantile Model projects potential targets between $130,000 and $163,000 before the end of 2025.

    Other anonymous analysts, like apsk32, hold even more ambitious short-term targets, predicting a move above $200,000 in the fourth quarter of this year.

    Bitcoin (BTC) price analysis: bulls target $100K

    The price chart reveals a tense battle unfolding near the critical $95,000 resistance.

    Technical indicators currently favor the bulls: the 20-day exponential moving average (EMA), sitting around $88,619, is sloping upwards, and the relative strength index (RSI) is positioned near overbought territory, signaling strong buying momentum.

    A decisive close above the $95,000 mark could act as a powerful catalyst, potentially propelling the BTC/USDT pair towards $100,000 and subsequently to the $107,000 region.

    However, sellers are expected to mount a strong defense in the zone between $107,000 and $109,588.

    Conversely, the 20-day EMA serves as crucial near-term support.

    A break below this level could invalidate the immediate bullish momentum and potentially pull the price back into the broader range between $73,777 and $95,000.

    Looking at the 4-hour chart, bears are actively defending the $95,000 level but have struggled to push the price decisively below the shorter-term 20-EMA.

    A rebound off this moving average would strengthen the case for an eventual breakout above $95,000, targeting $100,000.

    However, failure to hold the 4-hour 20-EMA could lead to a deeper pullback towards the 50-simple moving average (SMA), a key level bulls must defend to prevent a slide towards $86,000.

    Sui (SUI) price analysis: testing resistance, eyeing upside

    Sui (SUI) has encountered resistance near the $3.90 level.

    However, the pullback from this high has been relatively shallow, indicating that bulls are holding their positions rather than rushing to take profits.

    If the price remains above the 38.2% Fibonacci retracement level at $3.14, buyers are likely to make another attempt to push the SUI/USDT pair above $3.90.

    A successful breakout could see the price surge towards $4.25 and potentially $5.00.

    On the downside, a break below $3.14 would signal the start of a more significant correction, potentially targeting the 50% retracement level at $2.94.

    Buyers are expected to defend the zone between $2.94 and the 20-day EMA (currently around $2.69).

    The 4-hour chart shows support near the 20-EMA, but sellers remain active at higher levels.

    A break below the 4-hour 20-EMA could trigger a drop to $3.14, while a push above the
    3.81−3.90 resistance is needed to confirm the next leg up towards $4.25.

    Avalanche (AVAX) price analysis: range consolidation, breakout potential

    Avalanche (AVAX) has been consolidating within a range defined by support at $15.27 and resistance near $23.50.

    Trading within such ranges often involves buying near support and selling near resistance.

    While buyers haven’t yet managed to decisively break above $23.50, the fact they haven’t given up much ground suggests accumulation might be occurring.

    A breakout above $23.50 would complete a potential double-bottom pattern, a bullish formation with a calculated target objective near $31.73.

    However, this optimistic scenario would be invalidated if the price turns down and breaks below the moving averages, suggesting the range-bound action might persist.

    On the 4-hour chart, AVAX has been consolidating tightly between $21.60 and $23.10. This narrow range indicates bulls are holding firm, anticipating further upside.

    A break above $23.10 could trigger a move towards $25, likely overcoming the resistance at $23.50.

    Conversely, a drop below $21.60 would signal weakening bullish resolve, potentially pulling the price down towards $19.50.

    Source link

  • The Graph price prediction as GRT surges 15%

    The Graph price prediction as GRT surges 15%

    • The Graph (GRT) price was up 15% and above $0.10, rising as most altcoins gained.
    • Bitcoin’s bullish flip this past week could boost altcoins, including GRT.
    • The Graph’s price is above a key level after a breakout of a technical pattern.

    The Graph (GRT) has emerged as one of the standout performers in the latest crypto rebound, gaining over 15% as sentiment across digital assets turned sharply positive.

    The move follows Bitcoin’s rally to above $94,000, driven in part by speculation around easing trade tensions and a broader macroeconomic tailwind that lifted risk assets, including equities.

    That momentum spread to altcoins, with GRT among the top gainers within the 100 largest tokens by market capitalization.

    Notably, The Graph’s price action in the past 24 hours saw buyers break above a key technical pattern.

    It’s an outlook that mirrors the moves for Sui and Arbitrum prices.

    The Graph price jumps 15% as altcoins rise

    As noted, The Graph’s price has climbed 15% in the past day. It is also more than 31% up in the past week, which aligns with a broader altcoin rally after BTC spiked to above $94k.

    On-chain activity, including staking by Indexers and Curators, continues to grow, potentially fueling further price gains for the altcoin.

    Currently, GRT is trading at $0.102, having jumped to an intraday high of $0.103.

    The altcoin, which boasts a 24-hour trading volume of $59 million (up 44%) and market cap of $997 million, is the 71st largest among cryptocurrencies.

    Strong buying momentum, driven by renewed interest in decentralized infrastructure projects, has pushed The Graph price above a key level.

    GRT reached its all-time high of $2.88 in February 2021.

    Can GRT price break to $0.2?

    GRT recently broke through a falling wedge pattern, a bullish technical setup that often signals a trend reversal.

    In most cases, a retest of a key hurdle and subsequent explosive move adds to the intensity of a breakout.

    As an analyst points out in the chart below, The Graph price’s breakout occurred as GRT surpassed the $0.1 resistance level.

    While not a major move, it’s an area representing a key psychological and technical barrier highlighted with a falling wedge.

    In the market, analysts look at falling wedge patterns, characterized by converging trend lines and declining volume, as indicative of a potential bullish flip. Buyers step in to push prices higher.

    Recently, another analyst shared a GRT price chart showing a “perfect ABCD harmonic pattern.”

    According to Alpha Crypto Signal, the altcoin was poised for a recovery, with this scenario unfolding on the weekly time frame.

    If positive sentiment prevails, GRT price could target $0.15 and then $0.2.

    However, failure to maintain above $0.1 might see GRT retest support near $0.072.


    Source link

  • Bitcoin tests key levels near $95K as regulatory tailwinds emerge

    Bitcoin tests key levels near $95K as regulatory tailwinds emerge

    Crypto news today: Bitcoin holds firm above $93K, fueled by record ETF inflows and bullish forecast

    • Bitcoin holds steady above $93,000, showing resilience after earlier correction.
    • US Spot Bitcoin ETFs saw massive $1.2B+ weekly inflow (“Pac-Man mode”), signaling strong institutional demand.
    • US Federal Reserve joined OCC/FDIC in withdrawing previous restrictive crypto guidance for banks.

    Bitcoin continues to demonstrate significant resilience, maintaining levels above the crucial $93,000 mark after weathering a notable correction earlier this year.

    This stability is underpinned by a confluence of factors, including surging institutional interest evidenced by record ETF inflows, increasingly bullish long-term price predictions, and a potentially easing regulatory landscape.

    A primary driver of the recent strength has been the remarkable influx of capital into US-listed spot Bitcoin exchange-traded funds (ETFs).

    These investment vehicles experienced substantial demand this week, attracting nearly $1.3 billion in net inflows, according to data from SoSoValue.

    Tuesday alone saw inflows nearing the $1 billion mark, representing the strongest single day since mid-January.

    This brings the total assets under management across these spot Bitcoin ETFs to an impressive $103 billion.

    BlackRock’s iShares Bitcoin Trust (IBIT) continues to lead the pack, accumulating $2.7 billion year-to-date, including $346 million just last week.

    Observing the broad participation across ten of the eleven available funds, Bloomberg senior ETF analyst Eric Balchunas described the activity vividly, stating the ETFs had entered “Pac-Man mode.”

    This widespread buying across multiple providers, rather than concentration in just one or two, suggests a broadening base of institutional conviction.

    The total value traded across all spot Bitcoin ETFs reached $496 million, reflecting significant market activity.

    Lofty projections: ARK Invest eyes $2.4 million bitcoin

    Fueling longer-term optimism, prominent investment firm ARK Invest recently made headlines by significantly raising its 2030 price targets for Bitcoin.

    Citing institutional investment as a primary catalyst, ARK lifted its “bull case” scenario from $1.5 million to a striking $2.4 million per Bitcoin by the decade’s end.

    The firm also increased its “base” case to $1.2 million and its “bear” case to $500,000.

    ARK research analyst David Puell explained the rationale, estimating Bitcoin could achieve a 6.5% penetration rate within the massive $200 trillion global financial system in their most optimistic scenario.

    Furthermore, the firm’s model incorporates Bitcoin’s growing acceptance as “digital gold,” projecting it could capture up to 60% of gold’s approximately $18 trillion market capitalization.

    Technical picture: holding support, eyeing breakout

    From a technical analysis perspective, maintaining current levels is seen as critical.

    Analysts emphasize the importance of Bitcoin holding support above the $93,500 zone to avoid potential downward pressure.

    Crypto analyst Rekt Capital suggested BTC needs to consolidate above this level, ideally securing a weekly close above it, to “resynchronize with the former Reaccumulation range.”

    Bitcoin has demonstrated its ability to trade above this mark this week, potentially reflecting its appeal as a safe haven amid ongoing geopolitical and trade uncertainties.

    Sustaining this support could pave the way for a retest of the $100,000 barrier and potentially new all-time highs, according to expert consensus.

    Further technical indicators point towards underlying market strength.

    The amount of Bitcoin supply held in profit has reportedly surpassed the 16.7 million BTC “threshold of optimism.”

    Historical analysis suggests that when Bitcoin consistently holds above this zone (as seen in 2016, 2020, and 2024), significant price appreciation often follows within months.

    Traders like CrediBULL Crypto are looking for “one more leg on the lower timeframes” to confirm the breakout, suggesting momentum could potentially carry prices towards the $150,000 region if sustained.

    Regulatory winds shifting? Fed withdraws guidance

    Adding a potential tailwind, US banking regulators, including the Federal Reserve, recently took steps to withdraw previous crypto-specific guidance issued to banks in 2022 and 2023.

    These earlier notices had often required pre-approvals for banks engaging in crypto activities and highlighted perceived risks.

    By joining the Office of the Comptroller of the Currency (OCC) and the Federal Deposit Insurance Corp. (FDIC) in rescinding this guidance, the Fed stated the move aims to ensure its “expectations remain aligned with evolving risks and further support innovation in the banking system.”

    While not creating new rules, this withdrawal effectively places decisions on crypto engagement more firmly in the hands of bank managers and compliance teams, pending potential future legislation from Congress.

    Fed officials noted they “will instead monitor banks’ crypto-asset activities through the normal supervisory process,” potentially signaling a less prescriptive regulatory posture from these key agencies.

    The combination of strong institutional inflows, ambitious long-term outlooks, supportive technicals, and a potentially less restrictive regulatory environment paints a compelling picture for Bitcoin as it holds key levels and eyes its next potential move higher.

    Source link

  • AVAX eyes $40 after key level retest

    AVAX eyes $40 after key level retest

    • Avalanche (AVAX) recently shattered a significant resistance level, rising to highs of $23.
    • The retreat from the barrier that had previously capped its upward momentum might offer bears some hope.
    • But could bulls maintain the pressure and target the key hurdle of $40 next?

    Avalanche’s recent price action follows a period of consolidation. While optimism remains, the AVAX token has dipped to near support with price around $21.

    Notably, AVAX traded in a tight range between $18 and $20.50 after bouncing off lows of $14.5 seen earlier in the month.

    The breakout to above $23 came amid Bitcoin’s spike to $94k, aligning with broader market performance. Upside momentum completed a significant recovery and formation of a potential cup and handle pattern.

    Buyer action has been accompanied by a surge in trading volume, signaling strong upward interest.

    Potential upside drivers of Avalanche price

    Market sentiment is buoyed by Avalanche’s robust fundamentals and a return to the spotlight for decentralized finance (DeFi) and gaming tokens. The Avalanche ecosystem has benefitted from this, including recent partnerships.

    Spot crypto exchange-traded fund applications and offering of other institution-focused AVAX products has bolstered the native Avalanche token. The US Securities and Exchange Commission has added to the excitement by acknowledging VanEck’s filing for a spot AVAX ETF.

    These developments provide a strong backdrop for AVAX’s price gains, as the network’s utility and scalability remain competitive in the layer-1 blockchain space.

    On-chain data provides further insight. Whale activity has increased, with large transactions spiking over the past week, suggesting accumulation by major holders. Meanwhile, the number of active addresses on the Avalanche network has risen by 15% in the last month.

    A surge above $20 could see AVAX return to above $28 and target a nearly 100% spike to above $40.

    Technical picture for AVAX price

    Bulls have to offer sustained buying pressure to break past key levels.

    Technical indicators are however bullish. The Relative Strength Index (RSI) is approaching 60, indicating growing momentum without entering overbought territory. Additionally, the Moving Average Convergence Divergence (MACD) has shown a bullish crossover, further supporting the case for continued upward movement.

    AVAX chart by TradingView

    However, challenges remain. The $23 and $28 levels, the latter coinciding with the 200-day moving average, could be a formidable resistance area.

    Avalanche’s breakout above $23 marks a pivotal moment, with technicals and fundamentals aligning for a potential rally to $40.

    While risks persist, the combination of strong network growth, bullish indicators, and increased on-chain activity positions AVAX for further gains, provided it can overcome the next resistance hurdle.

    Weakness to $20 could see AVAX price revisit the recent lows of $14.

    Source link

  • Bitcoin decouples? Crypto gains while gold pauses amid trade uncertainty

    Bitcoin decouples? Crypto gains while gold pauses amid trade uncertainty

    Bitcoin nears $94K, eyes Breakout as gold stalls; ETF flows surge

    • Bitcoin rallied to $93,600 (+12.2% weekly) despite mixed US-China trade signals.
    • US Spot Bitcoin ETFs saw nearly $1.3 billion net inflows this week, signaling strong institutional demand.
    • Analysts suggest Bitcoin is decoupling from risk assets, acting more like “digital gold.”

    The cryptocurrency market showed renewed vigor recently, with Bitcoin pushing towards $94,000, although the rally encountered some friction Wednesday following cautious remarks from US Treasury Secretary Scott Bessent regarding the timeline for a comprehensive US-China trade deal.

    Despite this, strong institutional inflows and a potential divergence from traditional risk assets are fueling speculation about Bitcoin’s next major move.

    Bitcoin (BTC) climbed 2.6% over the preceding 24 hours and logged a 12.2% gain over the past seven days, reaching levels near $93,600 – territory not seen since early March.

    While Bitcoin led the charge, broader crypto market strength was evident.

    The CoinDesk 20 index, tracking top digital assets (excluding stablecoins, memecoins, and exchange tokens), rose 4.2% over 24 hours.

    Altcoins like Sui (SUI) posted impressive 24% gains, with Cardano (ADA) and Chainlink (LINK) also advancing around 7%.

    Crypto-related equities, after a strong start, saw gains moderate throughout the day.

    Mining firms Bitdeer (BTDR) and Core Scientific (CORZ) pared back double-digit advances to close up roughly 4%, while Coinbase (COIN) and MicroStrategy (MSTR) finished with gains of 2.1% and 1.4%, respectively.

    The backdrop for this rally included seemingly conflicting signals on the trade front. Earlier in the week, President Donald Trump suggested tariffs on China would “come down substantially” post-deal.

    However, Secretary Bessent tempered expectations on Wednesday, stating no unilateral offer to cut tariffs had been made and predicting a full resolution would likely take “two to three years to achieve.”

    Decoupling debate: Bitcoin mirrors gold amid uncertainty?

    This persistent trade uncertainty, paradoxically, might be contributing to Bitcoin’s strength relative to traditional markets. Some analysts believe the market may be moving past the initial shock of tariff threats.

    “Markets priced in the initial tough stances and tariff threats, which kept a lid on risk appetite over the past two months,” Paul Howard, director at crypto trading firm Wincent, told CoinDesk.

    “History suggests that once the opening volleys pass, more constructive developments and easing volatility typically follow,” he added, suggesting this environment could ultimately support risk assets like crypto.

    The narrative of Bitcoin acting as “digital gold” – a hedge against macroeconomic uncertainty and potential currency debasement – appears to be gaining traction.

    Institutional conviction: ETF flows surge past $1 billion this week

    Underscoring the renewed interest, particularly from larger players, has been the significant turnaround in flows for US-listed spot Bitcoin ETFs.

    According to SoSoValue data, these funds have attracted nearly $1.3 billion in net inflows so far this week alone, marking their strongest daily inflow on Tuesday since mid-January.

    “This [crypto] rally isn’t retail-driven hype—it’s institutional capital positioning ahead of what many see as a new monetary and political regime,” asserted Matt Mena, crypto research strategist at digital asset manager 21Shares.

    “More investors are turning to it not just as a speculative asset, but as a flight to safety amid rising uncertainty across traditional markets.”

    Gold pauses, bitcoin poised? Historical patterns eyed

    Adding another layer to the bullish case is the recent performance of traditional gold.

    After a remarkable run that saw it surge 35% over four months to breach $3,500 per ounce, gold prices pulled back Wednesday, down roughly 2.5% to around $3,290.

    Some analysts interpret this stalling action in gold, following its massive rally, as potentially bullish for Bitcoin.

    Charles Edwards, founder of Capriole Investments, highlighted this dynamic.

    Posting a chart on X (formerly Twitter), he noted that historically, Bitcoin’s major upward moves have often followed significant gold rallies, albeit with a lag of a few months.

    “Bitcoin is showing significant strength,” Edwards stated.

    “We have decoupled from risk assets and the market is now starting to front-run the fact that bitcoin is digital gold. If risk assets were to decay further from here, BTC is the ultimate QE [quantitative easing] hedge.”

    Eyes on $95K: resistance looms despite bullish momentum

    Despite the strong price action and positive indicators, technical hurdles remain.

    Matt Mena from 21Shares cautioned that Bitcoin faces near-term resistance around the critical $95,000 level.

    He suggested a potential pullback could occur before a decisive breakout above this zone. Successfully clearing $95,000 is seen by many traders as key to unlocking further significant upside potential.

    The combination of renewed institutional demand, the compelling “digital gold” narrative gaining traction as traditional gold pauses, and supportive historical patterns suggests Bitcoin may be gearing up for its next major leg higher, with the $95,000 level serving as the immediate gateway.

    Source link

  • AERGO price falls 12%, defies broader crypto surge

    AERGO price falls 12%, defies broader crypto surge

    • Aergo price has dived 12% as Bitcoin and top altcoins rally.
    • The AERGO token falls amid profit-taking after a staggering 300% surge.
    • Bears could eye levels below $0.20.

    Aergo price has dipped further as profit-taking holds, with the altcoin declining even as most altcoins rose in the past 24 hours.

    These losses come after a staggering 300% surge for AERGO seen earlier this month. The token has nosedived despite a major network update.

    “With AERGO 2.7.0, smart contract verification enters a new era. By embedding AI-powered auditing directly into the platform, AERGO ensures contracts are not only deployed faster but with greater confidence in their security and integrity,” the Aergo team wrote.

    The AERGO price action today

    As of April 23, 2025, the price of AERGO hovered near $0.21, down 12% per data from CoinMarketCap.

    The decline comes amid heightened volatility, with the token’s meteoric rise having given way to massive selling pressure.

    Notably, like other recent explosive tokens such as VOXEL, Aergo has seen a significant spike in concerns over potential market manipulation.

    Analysts have also pointed to potential insider selling, a 44% drop in a single day recently exacerbating the concerns.

    Market analyst Ash Crypto shared in a post on X:

    As AERGO price falls, altcoins such as Deepbook, Zerebro, and Sui have surged in the past 24 hours.

    ETH, XRP, and SOL have led the mega cap alts higher also.

    The upside follows Bitcoin (BTC) edging past key resistance levels to regain $94k.

    BTC’s surge comes amid a weaker US dollar and strong institutional buying, with news on tariffs and other factors catalysing gains.

    Spot Bitcoin exchange-traded funds have also shown strong institutional demand, aligning inflows with Bitcoin’s resilience.

    This means AERGO’s pullback stands out, including the 10% decrease in daily volume.

    AERGO price analysis

    Despite today’s dip, AERGO remained up 222% in the past month, reflecting the recent strength of the altcoin’s surge.

    However, AERGO’s price action reflects a classic post-pump correction.

    After surging to an all-time high near $0.70 on April 16, driven by Binance’s perpetual contracts and DigiFinex’s USDT trading pair listing, the token faced intense selling pressure.

    It means bulls have a lot to do to reclaim recent peaks.

    On the upside, AERGO faces resistance at $0.23 and $0.28, with a break above potentially targeting $0.42.

    The flipside has a dip below $0.20 and a retest of $0.16 and $0.12.

    If Bitcoin sustains its rally and altcoin sentiment continues to be positive, it will be interesting to watch what AERGO does. Will bulls rebound, or are concerns set to push prices lower?


    Source link