Development never stops in the fast-paced and competitive crypto sector and COTI is one project that is flashing some bullish signs.
VORTECS™ charts from Cointelegraph Markets Pro show that COTI, an enterprise-grade financial technology platform focused decentralized payments and digitization for any form of currency, could be on the verge of a breakout.
The indicator began to detect a bullish outlook for COTI after the metric hit a high of 89 on April 13.
Three reasons for the improving outlook for COTI include anticipation for the upcoming launch of MultiDAG 2.0, deeper integration with different facets of the Cardano ecosystem and an increase in adoption of the protocol’s Djed stablecoin.
Upcoming launch of MultiDAG 2.0
One of the biggest upcoming developments for Coti is the protocol’s plan to launch its MultiDAG 2.0 layer which will enable the issuance of new tokens on top of the network’s Trustchain.
Launching MultiDAG 2.0 on the COTI mainnet will also enable the creation of a governance token for COTI’s treasury, which will be the first enterprise token and a payment token on top of the COTI Trustchain.
The team currently plans to release a FoxNet for MultiDAG 2.0 in April followed by a Testnet toward the end of May. Once the Testnet is launched, COTI plans to define a new token standard and has tentatively set a goal to launch MultiDAG 2.0 on Mainnet in Q3.
Cardano ecosystem integration
A second factor helping to attract attention to COTI has been its increasing involvement with the Cardano ecosystem, which has started to see the rollout of its first decentralized applications (dApps) and DeFi protocols.
Some of the Cardano-based protocols that COTI has established working relationships with include the Cardano DeFi Alliance, Adaswap, Project Catalyst and NFT-Maker.
Another bullish development for COTI has been the adoption of its Djed stablecoin. Stablecoin issuance has been a trending tactic across the cryptocurrency market that entices investors to shovel more funds into the related ecosystem in exchange for yield.
Djed is a crypto-backed algorithmic stablecoin developed by Cardano and COTI that uses smart contracts to maintain a stable price and intended to power the Cardano DeFi ecosystem.
Once the project has been fully vetted on Testnet and has completed an external security audit, COTI plans on releasing Djed on its Mainnet by the end of Q2.
We are pleased to announce our new partnership with @RevelarEngine, Cardano’s first NFT Gaming platform. The integration of Djed will help bring a stable way to buy & sell NFT game assets to the Revelar’s system.
More than 15 strategic partnerships have been signed with DeFi and NFT protocols in the Cardano ecosystem and as there are plans for further expansion. This suggests that Djed will have adequate liquidity and application once it is fully launched and if stablecoin launches from other protocol’s can be viewed as an indicator of future performance, it’s possible that COTI could benefit from the expected boost in protocol TVL.
The views and opinions expressed here are solely those of the author and do not necessarily reflect the views of Cointelegraph.com. Every investment and trading move involves risk, you should conduct your own research when making a decision.
The cryptocurrency market has far faced an uphill battle for the larger part of 2022 due to global economic headwinds on multiple fronts, along with supply chain constraints, blistering inflation and the ongoing war in Ukraine.
Despite the weakness seen in a majority of crypto assets, several decentralized finance (DeFi) protocols have managed to strengthen their fundamentals and entice new users to enter their ecosystems.
Here’s a look at four protocols that are showing strength even as the wider crypto market struggles to gain footing.
Balancer
Balancer (BAL) is an automated market maker (AMM) on the Ethereum (ETH) blockchain that offers users a range of DeFi capabilities including the ability to stake tokens, provide liquidity, participate in governance voting and perform token swaps.
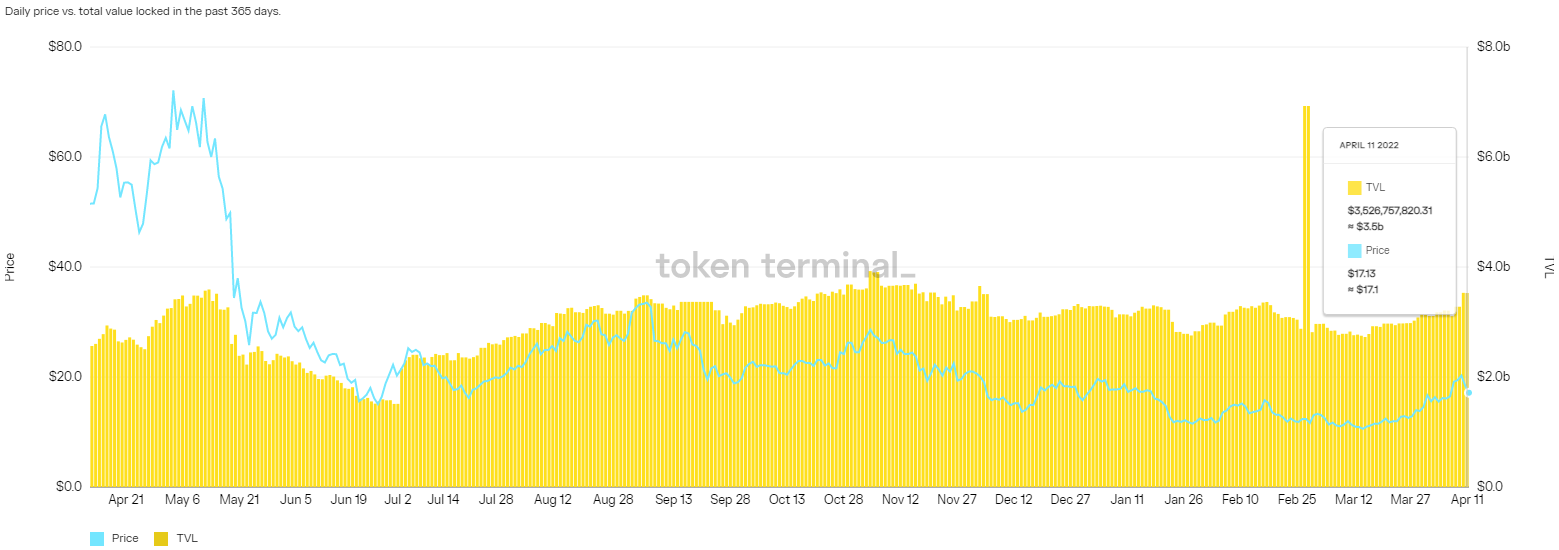
According to data from Token Terminal, the total value locked (TVL) on Balancer is currently $3.54 billion, the third-highest TVL in the history of the protocol despite falling prices across the cryptocurrency market.
Daily price vs. TVL for Balancer. Source: Token Terminal
The staying power of the Balancer TVL is due, in large part, to an increase in funds staked in stablecoin pools on the platform and a more involved governance mechanism that lets veBAL hodlers vote on which pools receive a majority of the BAL reward emissions.
DeFiChain
DeFiChain (DFI) is a DeFi protocol that was created through a fork of the Bitcoin code and operates in conjunction with the Bitcoin network to offer users access to crypto assets as well as tokenized stocks.
Data from Defi Llama shows that the TVL of DeFiChain hit a new all-time high of $901.16 million on April 5 and currently sits at $831 million following the recent pullback in prices.
Total value locked on DeFiChain. Source: Defi Llama
The price of DFI has also remained relatively resilient compared to the wider crypto market and currently trades at $4.12 after hitting a high of $4.63 on April 3.
The resiliency of DeFiChain is due, in part, to the continued development and expansion of the protocol, which recently added support for tokenized stocks for Walt Disney Co, iShares MSCI China ETF, MicroStrategy Incorporated and Intel Corporation.
NEAR Protocol
NEAR protocol (NEAR) is a layer-one blockchain network designed as a community-run cloud computing platform capable of offering high transaction speeds at a low cost.
2022 has been a good year in general for the project and the price of NEAR hit an all-time high of $20.42 on Jan. 16 and the most recent rally saw the price rebound to $19.81 on April 7.
NEAR/USDT 1-day chart. Source: TradingView
On the DeFi front, things have never been this good for the NEAR protocol as the total value locked on the network is now at a record-high of $363.72 million, according to data from Defi Llama.
Total value locked on NEAR. Source: Defi Llama
The improving fundamentals for NEAR follow the successful completion of a $350 million funding round led by the New York-based hedge fund Tiger Global and speculation that the NEAR token could soon be listed on Coinbase.
Celer’s cBrige, a multi-chain network that enables the transfer of assets across 26 different blockchain networks and layer-2 protocols, is also performing well.
According to data from Defi llama, the cBridge hit a new all-time high TVL of $765.25 million on April 11 as the wider crypto market sold off and Bitcoin fell back below $40,000.
Total value locked on cBridge. Source: Defi Llama
The steadily climbing TVL for cBridge comes as the protocol continues to expand its list of supported networks, with some of the most recent additions including Astar, Crab Smart Chain, Milkomeda Cardano and Shiden.
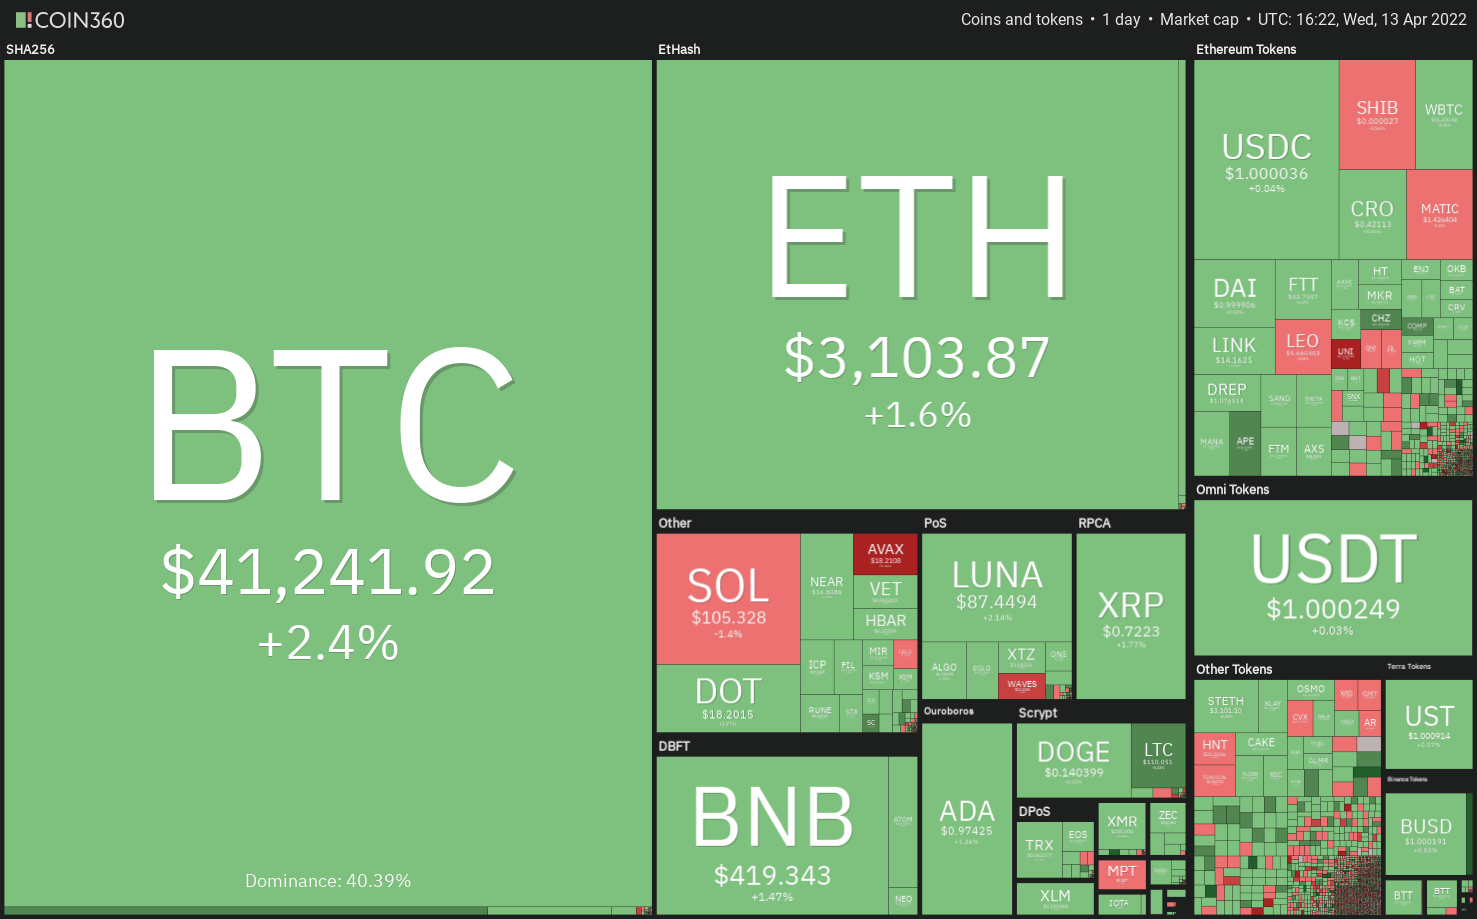
The overall cryptocurrency market cap now stands at $1.846 trillion and Bitcoin’s dominance rate is 40.9%.
The views and opinions expressed here are solely those of the author and do not necessarily reflect the views of Cointelegraph.com. Every investment and trading move involves risk, you should conduct your own research when making a decision.
Bitcoin (BTC) and major altcoins are attempting a recovery after the sharp fall on April 11. According to Glassnode’s recent weekly report, Bitcoin has witnessed a “modest volume of profit-taking by investors” since mid-February, which could “be providing sufficient headwinds to prices.”
While some investors are booking profits, the Luna Foundation Guard, the nonprofit organization attached to Blockchain protocol Terra, has continued to grow its stockpile of Bitcoin. Terra added 2,508 Bitcoin on April 13 to take its total holding to 42,406 Bitcoin, just shy of Tesla’s corporate treasury at 43,200 Bitcoin.
Larger investors do not seem to be perturbed by the volatility and sharp declines in cryptocurrencies and are taking a long-term view. Pantera Blockchain Fund, which had plans to raise $600 million, has amassed about $1.3 billion, indicating huge demand.
Will bulls be able to sustain the bounce in Bitcoin and altcoins? Let’s study the charts of the top-10 cryptocurrencies to find out.
BTC/USDT
Although Bitcoin broke below the psychological level at $40,000 on April 11, the bears could not build upon this momentum. This indicates that the bulls are buying at lower levels.
BTC/USDT daily chart. Source: TradingView
The relief rally could hit a wall at the 20-day exponential moving average (EMA) ($42,967). If the price turns down from this resistance, it will suggest that bears are selling on rallies. The downsloping 20-day EMA and the relative strength index (RSI) below 44 suggest a minor advantage to sellers.
The bears will have to sink the price below $39,200 to resume the decline. The BTC/USDT pair could then drop to the support line of the ascending channel. On the contrary, if the price continues higher and breaks above the 20-day EMA, the pair could challenge the overhead resistance at $45,400.
ETH/USDT
The bulls are attempting to arrest the decline at the 50-day simple moving average (SMA) ($2,958). Although Ether (ETH) attempted a rebound on April 12, the buyers could not sustain the higher levels.
ETH/USDT daily chart. Source: TradingView
The bulls are again attempting to extend the relief rally on April 13. The bounce is likely to face selling at the 20-day EMA ($3,172). If the price turns down from this level, the likelihood of a break below the 50-day SMA increases. If that happens, the ETH/USDT pair could decline to the uptrend line.
Contrary to this assumption, if the price breaks above the 20-day EMA, it will suggest aggressive buying by the bulls. The pair could then attempt a rally to the 200-day SMA ($3,490). The pair may then consolidate between the 50-day SMA and the 200-day SMA for a few days.
BNB/USDT
BNB plunged below the 50-day SMA ($402) on April 11 but the bears could not capitalize on this breakdown. The bulls purchased the dip aggressively and pushed the price back above the 50-day SMA on April 12.
BNB/USDT daily chart. Source: TradingView
The buyers are attempting to push and sustain the price above the 20-day EMA ($420). If they succeed, the BNB/USDT pair could rally to the 200-day SMA ($470) where the bears may mount a strong resistance. That could keep the price inside the range between the 200-day SMA and the 50-day SMA for a few days.
Conversely, if the price fails to sustain above the 20-day EMA, it will indicate selling at higher levels. The bears will then make one more attempt to sink the price below the immediate support at $391. If they manage to do that, the pair could slide to $350.
SOL/USDT
Solana (SOL) bounced off the 50-day SMA ($99) on April 12 but the bulls could not push the price above the 20-day EMA ($110). This suggests that bears are selling on rallies to the 20-day EMA.
SOL/USDT daily chart. Source: TradingView
The bears will now attempt to sink and sustain the price below the 50-day SMA. If they manage to do that, the SOL/USDT pair could drop to the strong support at $81. The bulls are expected to defend this level with all their might because a break and close below it could resume the downtrend.
Contrary to this assumption, if the price rises from the current level and breaks above the 20-day EMA, the bulls will make another attempt to clear the overhead hurdle at $122.
XRP/USDT
Ripple (XRP) bounced off the strong support at $0.69 on April 12 but the bulls could not sustain the recovery. This indicates that the bears are active at higher levels. The inside-day candlestick pattern on April 13 suggests indecision among the bulls and the bears.
XRP/USDT daily chart. Source: TradingView
The 20-day EMA ($0.77) is sloping down and the RSI is near 39, suggesting that the path of least resistance is to the downside. If the price breaks below the strong support at $0.69, the selling could pick up momentum. The XRP/USDT pair could then decline to $0.62.
Conversely, if the price continues to move up, the pair will attempt to rise above the 50-day SMA ($0.78). If that happens, it will suggest that the pair could trade inside a large range between $0.69 and $0.91 for some more time.
ADA/USDT
Cardano (ADA) attempted a relief rally on April 12 but the bulls could not clear the overhead hurdle at the psychological level at $1. This indicates that bears are attempting to flip the $1 level into resistance.
ADA/USDT daily chart. Source: TradingView
If the price once again turns down from the overhead resistance and breaks below $0.91, the correction could resume. The ADA/USDT pair could then drop to $0.86 and later to the critical support at $0.74. The 20-day EMA ($1.04) is sloping down and the RSI is in the negative zone, suggesting advantage to bears.
This negative view will be invalidated in the short term if the price turns up and breaks above the 20-day EMA. Such a move could open the doors for a possible rally to the overhead resistance at $1.26.
LUNA/USDT
Terra’s LUNA token formed an inside-day candlestick pattern on April 12 but the long wick on the day’s candlestick suggests that bears sold at higher levels. A minor positive is that the buyers are again trying to extend the recovery on April 13.
LUNA/USDT daily chart. Source: TradingView
If bulls push the price above $89, the LUNA/USDT pair could rise to the 20-day EMA ($96) where the bears are likely to mount a strong resistance. The downsloping 20-day EMA and the RSI in the negative zone indicate advantage to sellers.
If the price turns down from the overhead resistance and breaks below $80, the correction could resume and the pair may slide to the strong support at $75.
Alternatively, if the price continues to move up and breaks above the 20-day EMA, the pair could rally to the 61.8% Fibonacci retracement level at $104.
The bulls are attempting to arrest the decline in Avalanche (AVAX) at the uptrend line but the bounce is likely to encounter strong resistance from the bears near the moving averages.
AVAX/USDT daily chart. Source: TradingView
If the price fails to break above the moving averages within the next few days, the possibility of a break below the uptrend line increases. If that happens, the AVAX/USDT pair could decline to the next support at $65.
This level is likely to act as a strong support as the bulls have defended it successfully on two previous occasions. A strong rebound off it will indicate that the pair may trade inside the range between $65 and $99 for a few more days.
Alternatively, a break and close below $65 could intensify selling and the pair may drop to the critical support at $51.
DOT/USDT
Polkadot (DOT) is attempting a recovery after the sharp fall on April 11, which suggests buying at lower levels. However, the bulls are likely to face stiff resistance from the bears at higher levels.
DOT/USDT daily chart. Source: TradingView
If the price fails to rise above the immediate overhead resistance at $19, the bears will try to sink the DOT/USDT pair below the strong support at $16. If they succeed, the decline could extend to $14. The downsloping 20-day EMA ($19) and the RSI in the negative territory indicate that the path of least resistance is to the downside.
Alternatively, if the price moves up sharply and breaks above the 20-day EMA, it will suggest accumulation at lower levels. The pair could then consolidate inside the range between $16 and $23 for a few more days.
DOGE/USDT
The buyers are attempting to defend the 50-day SMA ($0.13) but the weak rebound off the strong support suggests a lack of buyers in Dogecoin (DOGE) at higher levels. This increases the possibility of a break below the 50-day SMA.
DOGE/USDT daily chart. Source: TradingView
If the price fails to sustain above the 20-day EMA ($0.14), the sellers will attempt to extend the decline by pulling the DOGE/USDT pair below the 50-day SMA. If they succeed, the pair could drop to $0.12 and then slide to the critical support at $0.10.
Contrary to this assumption, if the price turns up sharply and rises above $0.15, it will suggest strong buying at the 50-day SMA. The pair could then remain stuck between the 200-day SMA ($0.18) and the 50-day SMA for a few days.
The views and opinions expressed here are solely those of the author and do not necessarily reflect the views of Cointelegraph. Every investment and trading move involves risk. You should conduct your own research when making a decision.
Ripple’s XRP took a break from its prevailing downtrend as its price rebounded from $0.68 to $0.72 in the last three days.
Ripple scores vs. SEC
Traders returned to buying XRP after a U.S. court denied the U.S. Securities and Exchange Commission’s (SEC) request to shield internal documents related to June 2018 speech made by its former director William Hinman, wherein he said Bitcoin (BTC) and Ether (ETH) are not securities.
To recap, SEC filed a lawsuit against Ripple, a San Francisco payment services company, in 2020, alleging that it and its executives Brad Garlinghouse and Christian Larsen conducted illegal securities sales via XRP tokens.
But Hinman’s treatment of similar cryptocurrencies as utility tokens prompted Ripple’s legal team to argue that the SEC has bias toward XRP by treating it as a security token.
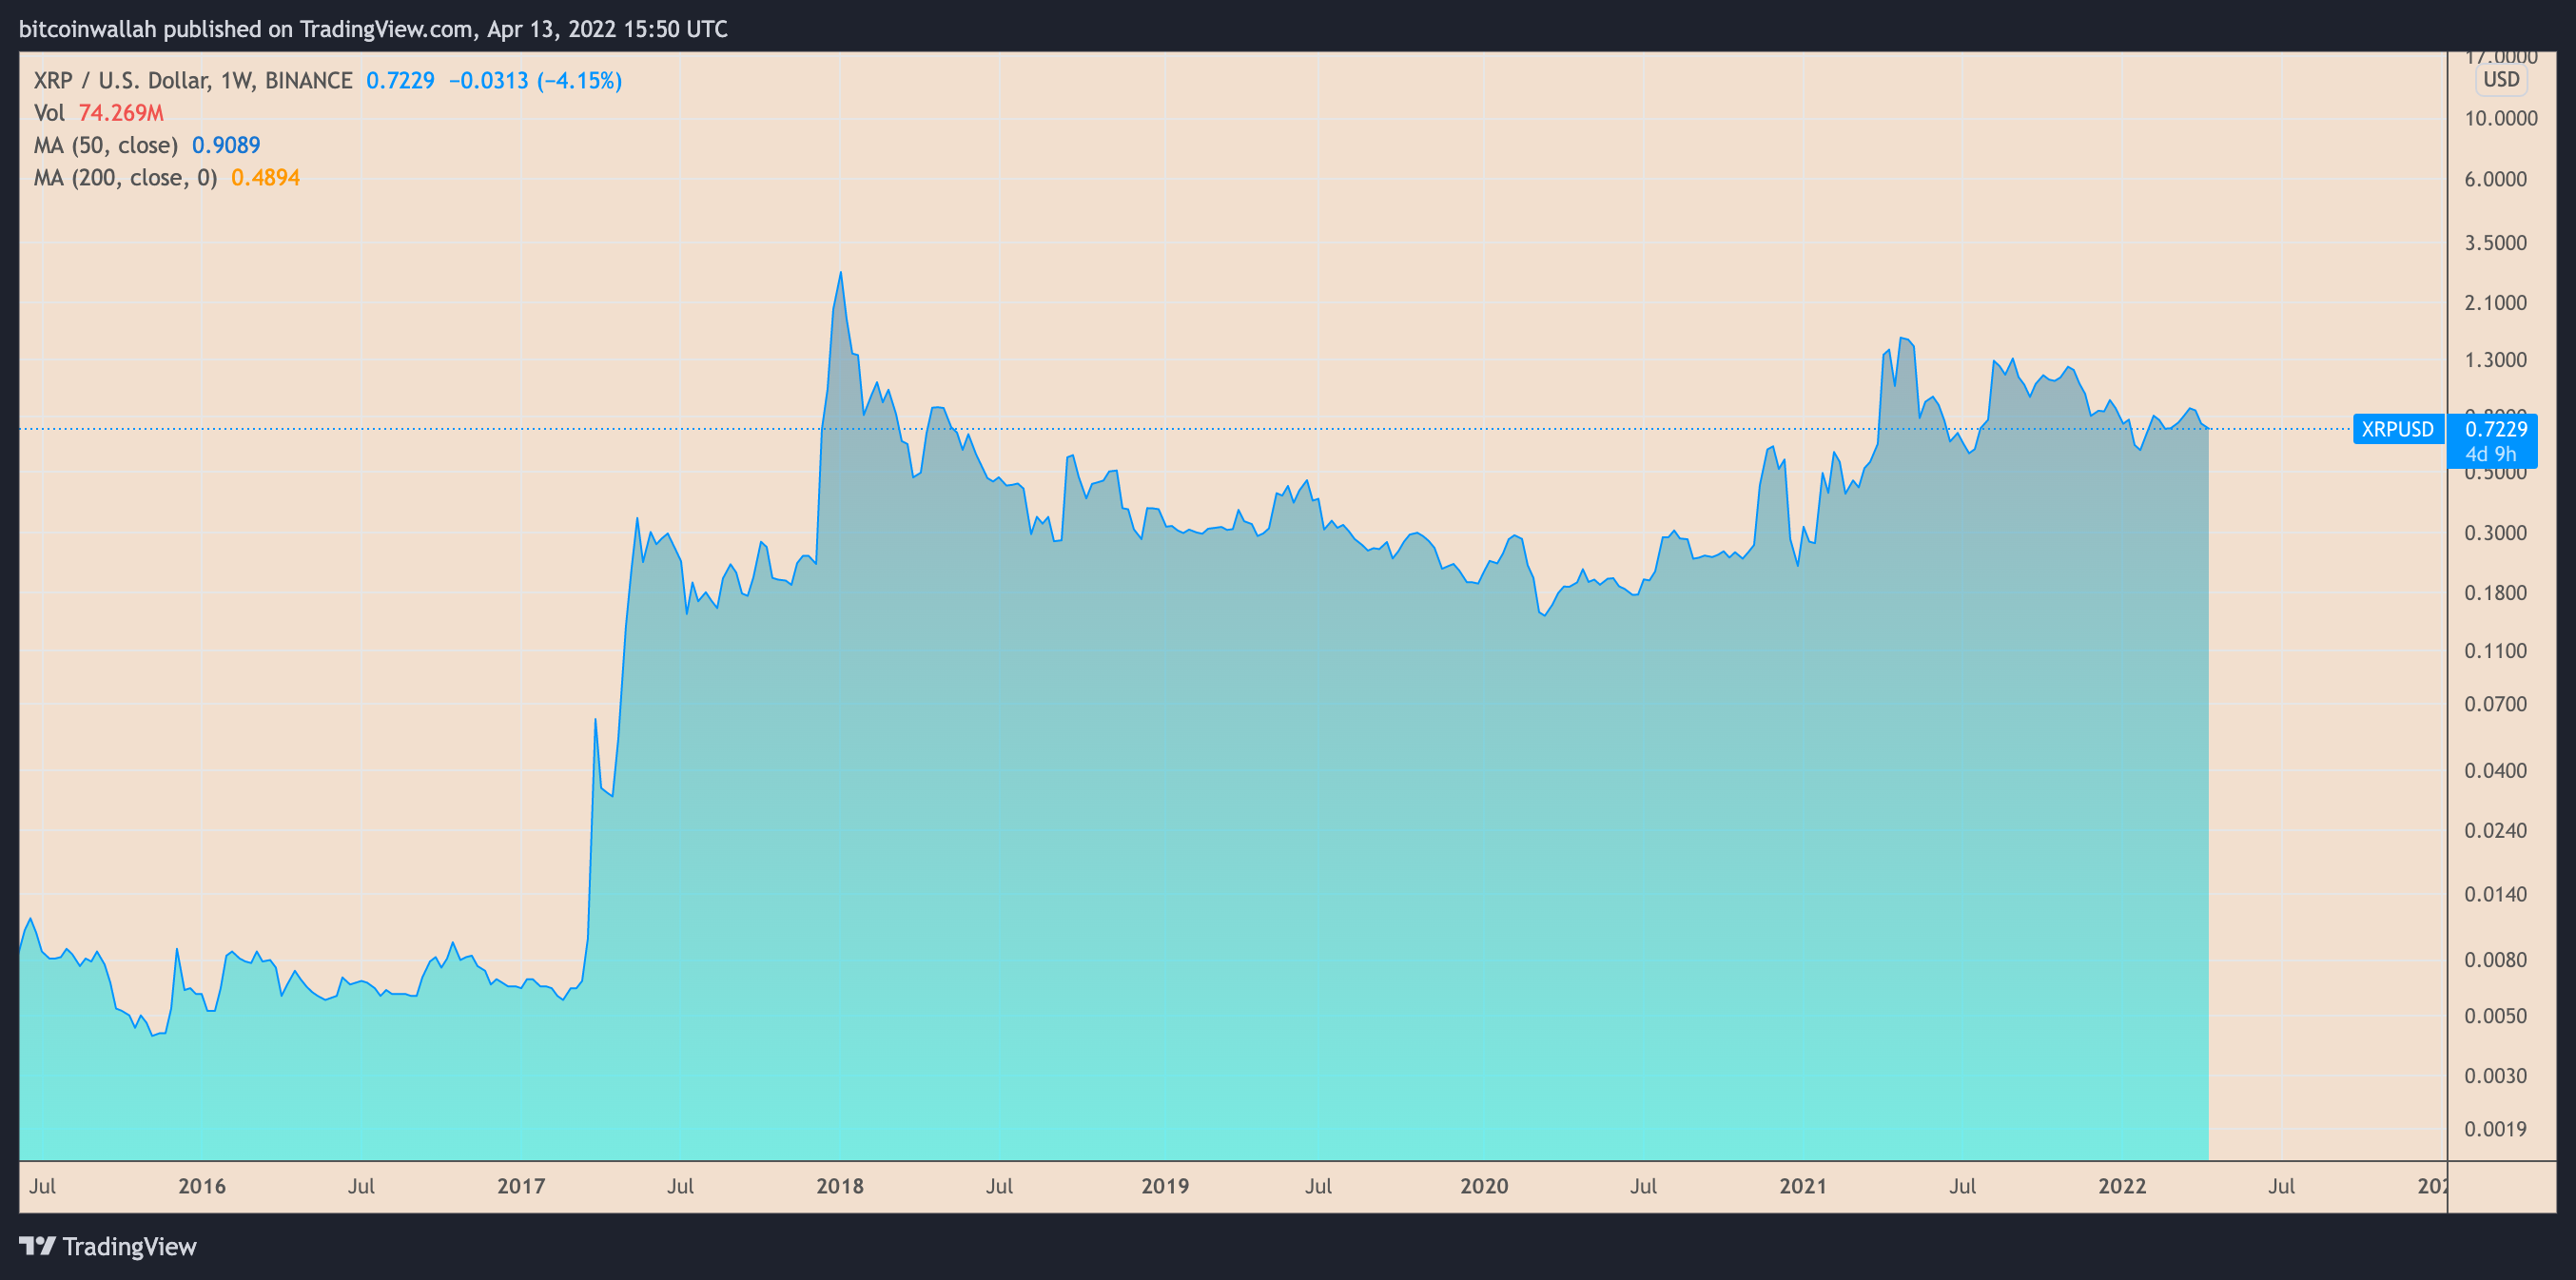
Overall, the legal battle has limited XRP’s upside to date. For instance, it remains the only top cryptocurrency that couldn’t break its all-time high of over $3 in 2018.
XRP/USD weekly price chart. Source: TradingView
But with Ripple scoring some wins against the SEC, analysts are hopeful that it would bring a sustainable buying momentum back to XRP’s market.
I hope Ripple, and if they do then yes it will pump
The latest XRP price rebound comes when it is already breaking out of a classic bearish pattern.
In detail, XRP consolidated inside an ascending triangle between Dec. 28, 2021, and April 4, 2022.
Ascending Triangles are considered continuation patterns, for they resolve after the price breaks out in the direction of its previous trend. XRP broke out of its ascending triangle pattern to the downside on April 5, as shown in the chart below.
As a rule, ascending triangle breakout targets come to be at length equal to the maximum distance between the structure’s upper and lower trendline when measured from the breakout point. In XRP’s case, the breakout point is near $0.82 while its triangle’s maximum height is around $0.32.
This puts the bearish target for XPR at near $0.50, which would be a new 2022 low.
Conversely, if XRP/USD stays above $0.69 as interim support, a rebound to the 50-day simple moving average (50-day SMA; blue wave in the chart above) near $0.78 in April is possible. Furthermore, a test of the 200-day EMA (orange wave) around $0.88 in Q2 would then be the next goal for the bulls.
The views and opinions expressed here are solely those of the author and do not necessarily reflect the views of Cointelegraph.com. Every investment and trading move involves risk, you should conduct your own research when making a decision.
ApeCoin’s (APE) market valuation could grow by nearly 250% in the second quarter of 2022 as it breaks out of a widely-tracked, classic technical pattern.
APE price “bull pennant” breakout underway
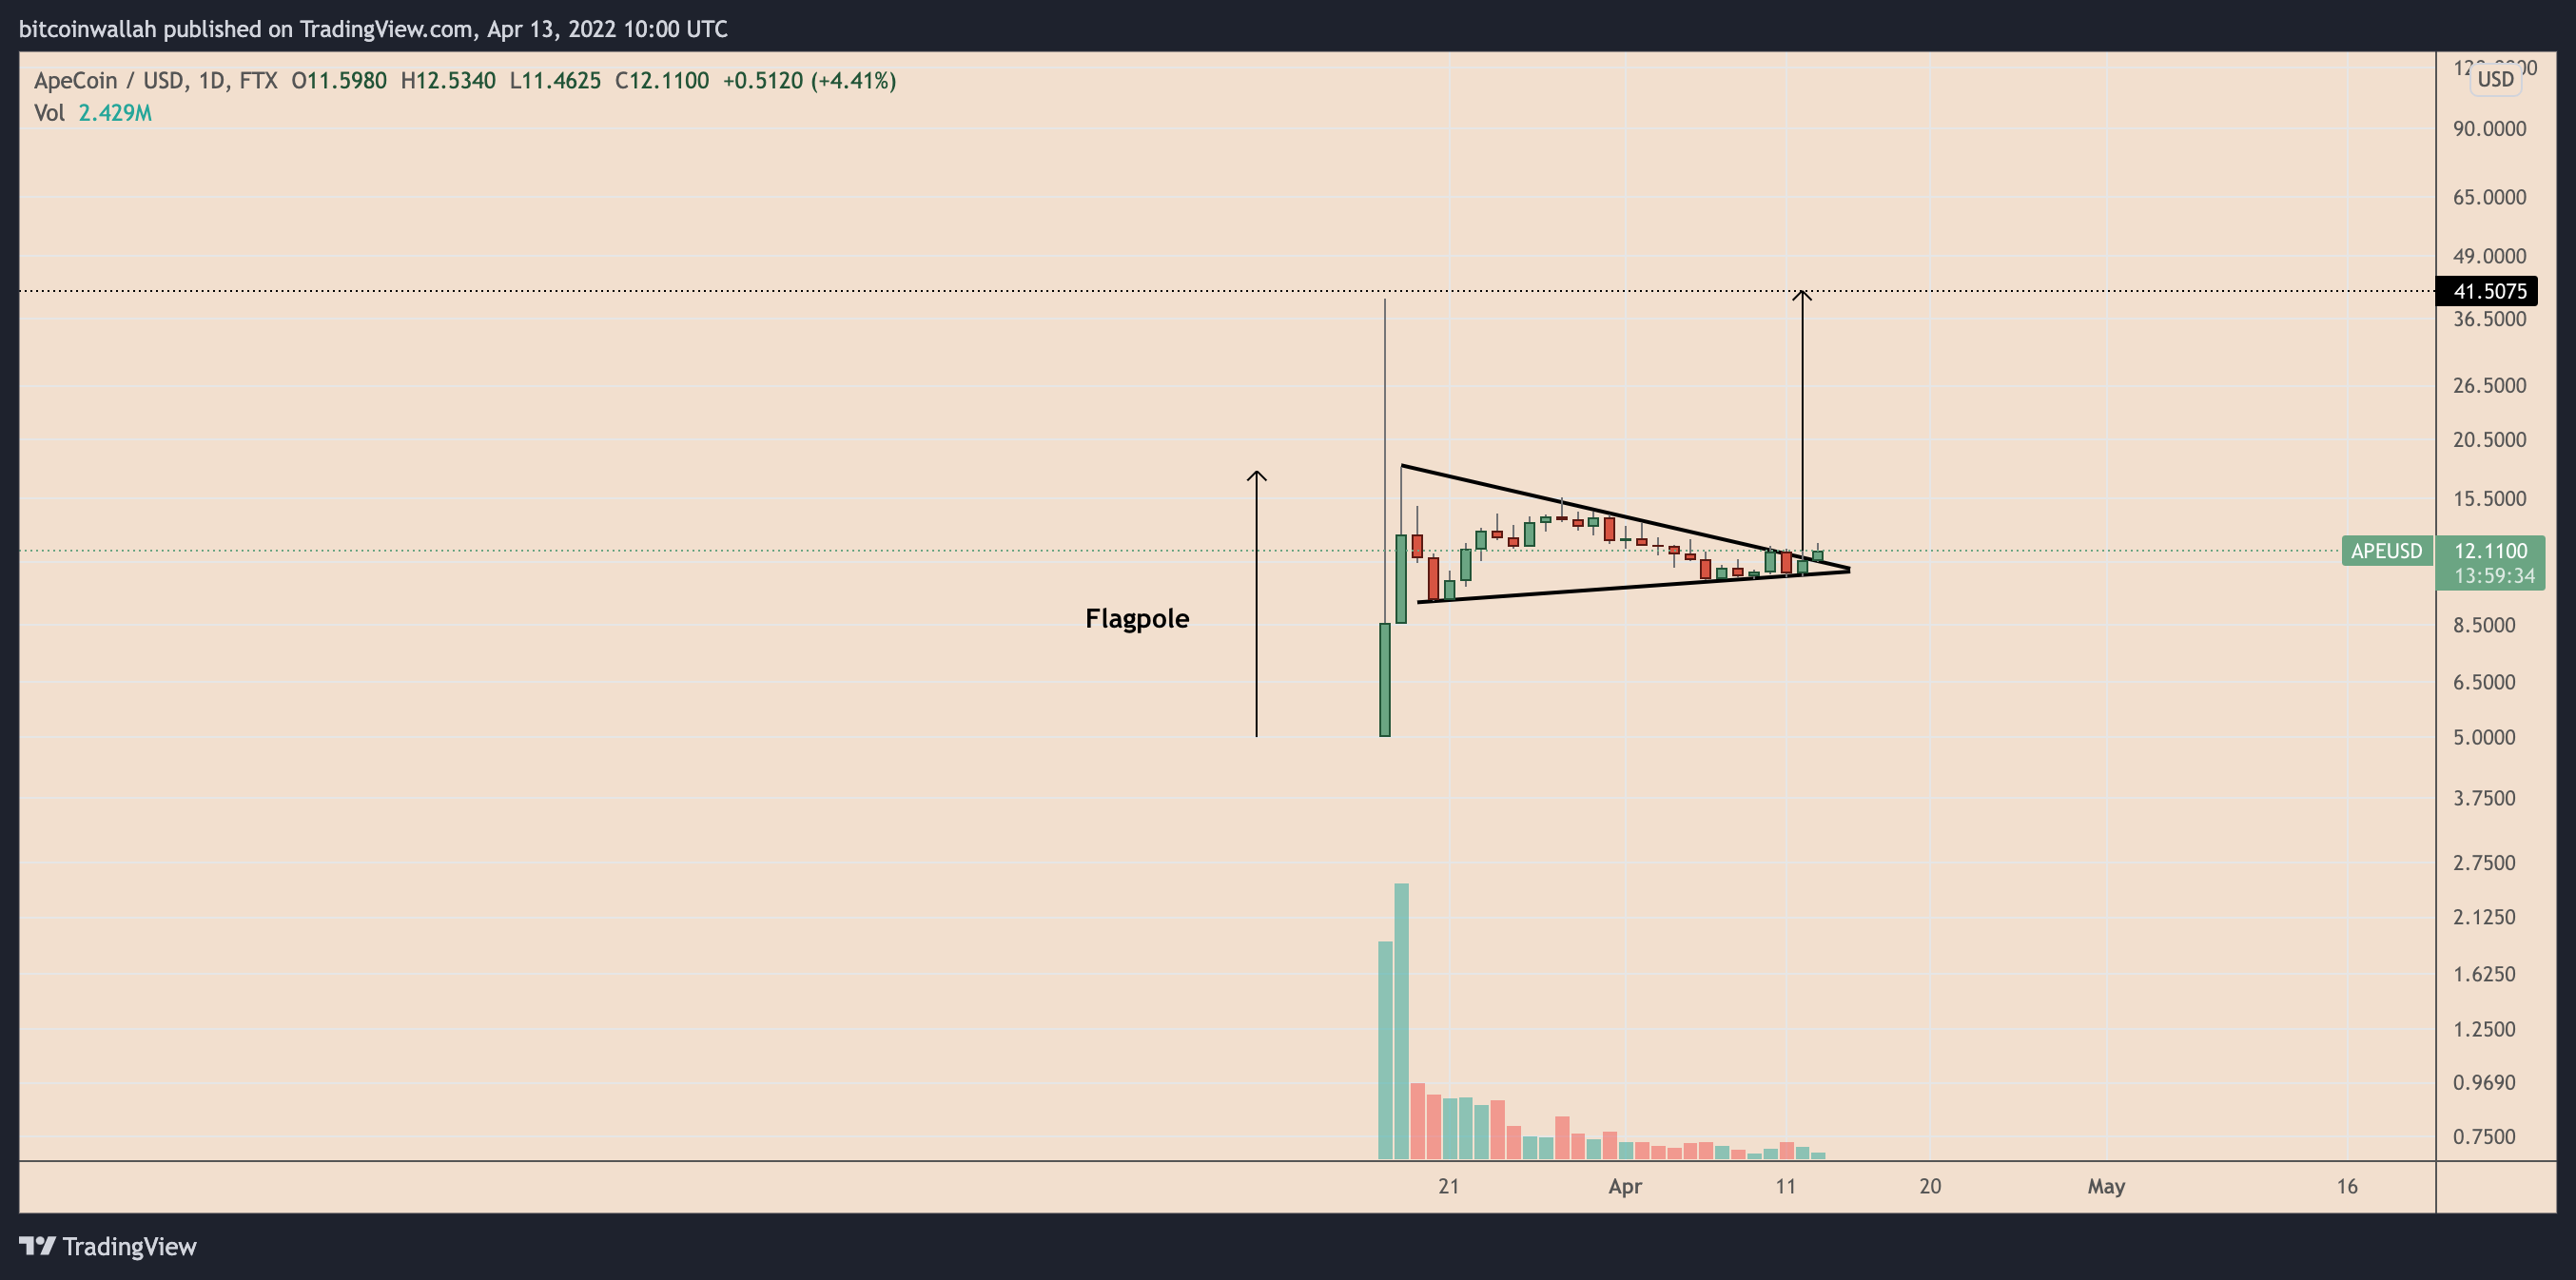
On April 13, APE’s price broke above the upper trendline of what appears to be a “bull pennant” chart pattern.
Bull pennants appear when the price consolidates inside a triangle-like structure following a strong uptrend. Many traditional analysts consider them as continuation patterns, for they typically result in the price breaking out in the direction of its previous trend.
As a rule, traders estimate a bull pennant’s upside target by measuring the size of the previous uptrend, called “flagpole,” and adding it to the breakout point. Applying the same to ApeCoin’s ongoing breakout move shows its potential for its potential for massive upside.
Therefore, if the bull pennant structure pans out as intended, APE could rise to nearly $40 in Q2/2022.
Robinhood listing?
The bullish setup for ApeCoin appears as it rebounds by nearly 17% to over $12.50 in two days, amid speculations that Robinhood, a popular retail brokerage firm, would list APE on its trading platform.
The rumors picked up momentum after Robinhood added Shiba Inu (SHIB), a Dogecoin-inspired meme cryptocurrency, alongside three other altcoins — Polygon (MATIC), Solana (SOL), and Compound (COMP) — for trading this Tuesday, leading to intraday gains across each asset.
The next crypto to be listed on Robinhood is going to be $APE.
However, Robinhood did not confirm any plans to integrate ApeCoin into its services, hinting that APE’s price gains since Tuesday might have resulted from mere speculation. Additionally, its breakout move out of the bull pennant accompanied lower volumes, suggesting a lack of upside conviction in the market.
As a result, ApeCoin’s potential to invalidate its bull pennant setup cannot be ruled out as long as it breaks above a sequence of resistance levels, as shown in the chart below, with a steady rise in volumes.
For instance, APE now eyes $13 as its next upside target while holding $11.50 as its interim support. Nonetheless, a break below the said price floor could have ApeCoin eye $10.25 as its next downside target.
The views and opinions expressed here are solely those of the author and do not necessarily reflect the views of Cointelegraph.com. Every investment and trading move involves risk, you should conduct your own research when making a decision.
Cryptocurrencies are well-known for being volatile assets, which means that experienced traders have plenty of opportunities in the space. Investors can expect to be taken on a wild ride if they plan on holding for a long time.
Stablecoins, a class of cryptocurrencies that offers investors price stability pegged to the value of fiat currencies, offer investors a safe haven when market turbulence hits but may represent missed opportunities over time.
Speaking to Cointelegraph, several experts have stated that retail investors should approach cryptocurrencies with a “pay yourself first” attitude and that an allocation of up to 5% in crypto should be relatively “safe” while allowing for “marginal return.”
Stablecoins are entirely different: No “marginal return” can be expected from simply holding an asset tied to the value of the United States dollar, although yields can reach double-digit annual percentage rates (APRs) using decentralized finance (DeFi) protocols. These protocols, however, lead to higher risk.
Different stablecoins, different risks
Not all stablecoins are created equal. The largest stablecoins on the market — USD Coin (USDC), Tether (USDT) and Binance USD (BUSD) — are backed 1:1 by cash or assets with similar value by centralized companies. This means that for every token in circulation, there’s a dollar in cash, cash equivalents or bonds in custody.
For example, other stablecoins like Dai (DAI) and TerraUSD (UST) rely on different mechanisms. DAI is crypto-collateralized and ensures it can maintain its peg by being overcollateralized. It includes economic mechanisms that incentivize supply and demand to drive its price to $1.
UST, on the other hand, is a non-collateralized algorithmic stablecoin. An underlying asset doesn’t back it, as it works through algorithmic expansion and supply contraction to maintain its peg. Terra, the blockchain behind UST, has notably been building up reserves for the stablecoin. So far, it has already purchased nearly 40,000 BTC worth over $1.6 billion and over $200 million in Avalanche (AVAX).
Marissa Kim, general partner at Abra Capital Management — the asset management arm of crypto investment firm Abra — told Cointelegraph that the firm views “USDC and other U.S.-regulated stablecoins as safe as keeping reserves in a bank account,” as these are “required to prove on a regular basis that they are fully collateralized.”
To Kim, decentralized stablecoins like DAI and UST may “pose other risks,” as volatile markets could see DAI lose its peg to USD. She added its governance “is by the MakerDAO community, and nobody knows who holds and governs this protocol and where voting power may be concentrated.”
Speaking to Cointelegraph, Adam O’Neill, chief marketing officer at cryptocurrency trading platform Bitrue, said that the “role of USDC and USDT” in the cryptocurrency space is “synonymous to the role of the U.S. dollar in the traditional financial ecosystem.”
O’Neill added that investors should use stablecoins “as a go-to hedge when trading and storing their assets.” He added:
“The security outlook of stablecoin should not be compared, as both the centralized and decentralized versions are secure in themselves. However, it is not uncommon to find hackers exploit the frailty in protocols built to offer products bothering both classes of stablecoin tokens.”
To O’Neill, how much investors should allocate to stablecoins is a decision that is up to them and depends on their investment goals. Kent Barton, tokenomics lead at ShapeShift DAO, told Cointelegraph that while every stablecoin has its own risk profile, there are a few things investors should keep in mind.
For one, centralized stablecoins like USDC and USDT can be easily converted back into USD, but the entities behind these coins could “potentially blacklist certain addresses, for instance, in response to demands from legal entities.” Barton added that while there are long-standing concerns regarding USDT’s backing, it has maintained its peg so far:
“USDT has the advantage of being time-tested: It’s the stablecoin that’s been around the longest. It has deep liquidity across centralized exchanges and many DeFi platforms.”
Decentralized stablecoins like DAI and USDT, Barton said, are more transparent because of the nature of the blockchains they are built on. Still, there are other risks out there, including volatile markets threatening DAI’s over-collateralization.
To Olexandr Lutskevych, founder and CEO of crypto exchange CEX.io, the security of each stablecoin depends on how security is defined. In terms of code, technical audits should cover the risks of more susceptible stablecoins, while in terms of reliability of moving funds from A to B, most have been known to fit the purpose.
As for stablecoins’ ability to maintain their peg against the dollar, Lutskevych said how that peg is maintained should be the main focus on investors’ minds.
Stablecoin DeFi yields: Too good to be true?
While merely holding stablecoins ensures cryptocurrency investors aren’t dealing with the market’s volatility, it also means they aren’t really making any type of return unless they put their stablecoins to work.
There are several options when it comes to stablecoins such as lending them out on centralized exchanges or blue-chip decentralized finance protocols lead to relatively small yields — often below 5% — that are relatively safe. Moving to riskier protocols, or employing complex strategies to boost yield, could lead to higher returns and imply more risk.
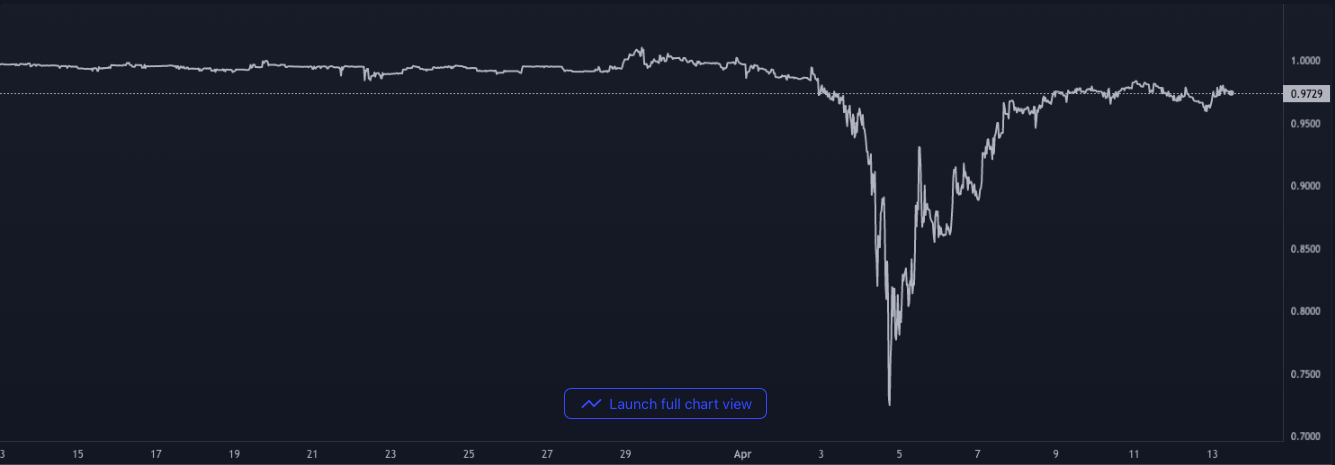
For example, it’s possible to find yields above 30% for Waves’ Neutrino USD (USDN) stablecoin, which has recently broken its peg and fallen below $0.80 before starting to recover.
When asked whether investors should lend their stablecoins or add them to decentralized exchanges’ (DEXs’) liquidity pools to earn yield, ShapeShift DAO’s Kent Barton pointed out that DeFi protocols bring in smart contract risks to the equation, which need to be considered.
One-month USDN/USDT chart showing when the token broke its peg. Source: TradingView
To Barton, protocols that have been around for “more than a few months and have a track record of protecting billions of dollars in value are fairly secure.” However, there’s “no guarantee of future security and stability.” Protocols with higher rewards, he said, tend to be riskier.
Lutskevych suggested investors should first understand exactly what they’re putting their money into:
“Just because it is DeFi, the investment principles do not change. And, one of the foundational investment principles is: Before proposing any strategy, you should thoroughly understand one’s risk preferences and individual circumstances.”
To Lutskevych, investors’ capital, time horizon, goals and risk tolerance should also be weighed when considering staying put or moving stablecoins to earn yield.
To O’Neill, it is “generally advisable that stablecoins should be deployed to harness yields from lending platforms,” although investors should also “be ready to jump at any investment opportunity.”
Stablecoins, partly thanks to the DeFi space, offer investors a plethora of opportunities across a wide number of blockchains. Using them outside of centralized exchanges may require some specific knowledge, without which investors may end up losing their funds by, for example, sending them to the wrong type of address.
Risk tolerance and sophistication
Speaking to Cointelegraph, Carlos Gonzalez Campo, research analyst at investment product issuer 21Shares, said that stablecoins provide investors with access to a “global network of value transfer similar to how the internet gave rise to a global and open network for information.”
Campos stated that February’s Consumer Price Index (CPI) data in the United States revealed a 7.9% year-over-year rise, meaning people are losing their purchasing power at a rate that hasn’t been seen in four decades.
What investors do with their stablecoins, the analyst said, depends on their risk aversion and level of sophistication as the “user experience is still lacking today” in DeFi platforms that let users earn passively on their holdings. Campos added:
“The clearest example is seed phrases, which are impractical and probably won’t achieve mass adoption. That is why leaders in the industry such as Vitalik Buterin have emphasized the need for wide adoption of social recovery wallets, which instead of relying on seed phrases, rely on guardians.”
Abra Capital Management’s Marissa Kim seemingly echoed Campos’ thoughts, as she said bugs and other exploits are possible in DeFi protocols which often pay higher yields in the protocol’s native tokens. They are “often highly volatile and may not be very liquid.”
To Marissa, some investors may be willing to take on the added risk, although others will be “more concerned with principal preservation.”
Whichever strategy investors choose to employ, it’s clear that stablecoins are a major part of the cryptocurrency ecosystem. More risk-averse investors may find they only trust the most transparent centralized stablecoins that offer limited opportunities, while more venturous investors may prefer higher yields and higher risk.
Over time, stablecoins’ influence in the cryptocurrency space is only set to keep growing, so it’s important that investors understand what they are dealing with and the risks involved with the stablecoins they choose to HODL and what they choose to do with them.
The views and opinions expressed here do not necessarily reflect the views of Cointelegraph.com. Every investment and trading move involves risk, you should conduct your own research when making a decision.
Decentralized finance (DeFi) wallet and browser extension MetaMask formed a new strategic partnership with three major crypto custodians; Gnosis Safe, Hex Trust, GK8, and Parfin.
MetaMask Institutional (MMI), the institutional version of the popular Ethereum wallet MetaMask, announced on Wednesday that the new integration will provide decentralized autonomous organizations (DAOs) with key management tools to participate in DeFi activities.
DAOs are organizations controlled by computer code and have no top-down authority, and they’ve been gaining popularity as a fundraising mechanism and administration tool for cryptocurrency projects.
According to the announcement, MMI provides institutions with access to DeFi and Web3 while meeting their compliance needs. Custodians, or custodial wallets, are services that store private keys and facilitate transaction approval and signing. They are crucial to organizations in securely obtaining and securing crypto assets.
Cointelegraph reached out to Harriet Browning, Europe, the Middle East and Africa business lead at Consensys. She told Cointelegraph:
“It’s enabling crypto needed funds, exchanges, traditional institutions, enterprise, DAOs, a whole host of different user profiles, enabling them to engage on a secure, well-managed risk-managed framework.”
The distinction between MetaMask Institutional and the company’s primary browser and wallet plugin is how assets are managed. Browning explained that assets held in MetaMask’s primary product are non-custodial, while assets managed through MMI are custodial. She noted:
“For retail user security, we’ve taken the hardware wallet and replaced it with a custodial institution. It’s essential that assets are secured by the institution.”
John Ennis, the safe ecosystem lead for Gnosis, said, “DAOs and crypto institutions want the gold standard of Defi integration, whilst still maintaining the industry’s security standard when it comes to safeguarding digital assets from operational and security risks.”
MetaMask has been actively expanding its offerings this year. In late March, the firm rolled out an integration with Apple Pay and a series of payment updates, including the ability to buy crypto through the application with debit or credit cards.
Cronos has partnered with the blockchain intelligence firm Chainalysis to enable real-time transaction monitoring tools for the Cronos (CRO) token and all CRC-20 tokens running on the Cronos network, according to an announcement shared with Cointelegraph on Wednesday.
The new compliance integration aims to enable institutions, cryptocurrency exchanges and digital asset funds to track transactions of CRC-20 tokens, allowing users to trace large volumes of activity and identify high-risk transactions. The partnership specifically allows institutions and exchanges to focus on the most urgent issues and properly report suspicious activity.
The integration is yet another milestone in the development and institutional adoption of the Cronos blockchain and digital assets deployed on Cronos. “Application builders and service providers will have access to the most advanced tools and services. The Chainalysis data platform is one of these essential foundations,” Cronos’ managing director Ken Timsit said.
As previously reported, Cronos mainnet launched in November 2021, aiming to provide greater interoperability between the Cosmos and Ethereum Virtual Machine (EVM) ecosystems. Designed to support decentralized finance (DeFi), nonfungible tokens (NFT) and GameFi applications, Cronos has amassed more than 450,000 DeFi and NFT users, inking partnerships with about 200 firms and institutions so far.
Launched in 2016, Crypto.com is one of the world’s largest cryptocurrency exchanges, with daily trading volumes averaging at $3.3 billion at the time of writing, according to data from CoinGecko.
In March 2021, Crypto.com launched its own decentralized open-source blockchain, the Crypto.org Chain, alongside its native token, Crypto.org Coin (CRO). Just about three months after launching Cronos mainnet, Crypto.org rebranded the Crypto.org Coin to the Cronos token in February 2022.
Cronos’ new compliance partner, Chainalysis, is one of the world’s largest crypto and blockchain intelligence firms, known for cooperation with major government agencies and financial institutions in the United States and worldwide.
Last month, Chainalysis partnered with the American financial services organization Cross River to ensure safe cryptocurrency trading and compliance amid the institution expanding its crypto services. The firm previously collaborated with platforms like the crypto-friendly trading app Robinhood and provided its compliance tools to the CryptoKitties game creator Dapper Labs.
Cronos, the Ethereum-compatible blockchain network backed by the major global cryptocurrency exchange Crypto.com, is moving to ensure compliance with a new partnership.
The company behind the Firefox internet browser Mozilla is attempting to appease its environmentally-conscious community by accepting only Proof-of-Stake (PoS) crypto donations.
The company initially halted all crypto donations in January, but has now opened them back up after a review period to assess community sentiments and to conduct research on crypto energy usage.
An update to our policy on accepting cryptocurrency donations.
Mozilla announced in a blog that after a review, it was changing its donations policies to come in line with its “climate commitments”. It said that: “Mozilla will no longer accept ‘Proof-of-Work’ cryptocurrencies, which are more energy intensive.
“Proof-of-Work cryptocurrencies can significantly increase our GHG [greenhouse gas] footprint due to their energy intensive nature.”
The company also said that the move was made based on its self-imposed Jan. 2021 climate commitments which aim for it to “significantly reduce our greenhouse gas footprint year over year” until it becomes carbon-neutral.
“Mozilla’s decision not to accept Proof-of-Work donations ensures that our fundraising activities remain aligned with our emissions commitment.”
By rejecting all non-PoS crypto, Mozilla is blocking both Bitcoin (BTC), the largest cryptocurrency by market cap, and Ether (ETH) — at least until the Merge occurs in the coming months and that blockchain adopts PoS.
Mozilla stated that it would release a list of accepted cryptocurrencies by the end of Q2, 2022. Some native coins from the most popular PoS chains include BNB Chain (BNB), Solana (SOL), and Avalanche (AVAX).
Among the mosvocal detractors of Mozilla’s new crypto donations policy was Mozilla’s own founder, Jamie Zawinski. He tweeted on Jan. 4 that those at Mozilla who are complicit with accepting Bitcoin “should be witheringly ashamed” to partner with the “planet-incinerating ponzi grifters.” Zawinski stopped working at Mozilla in 1999.
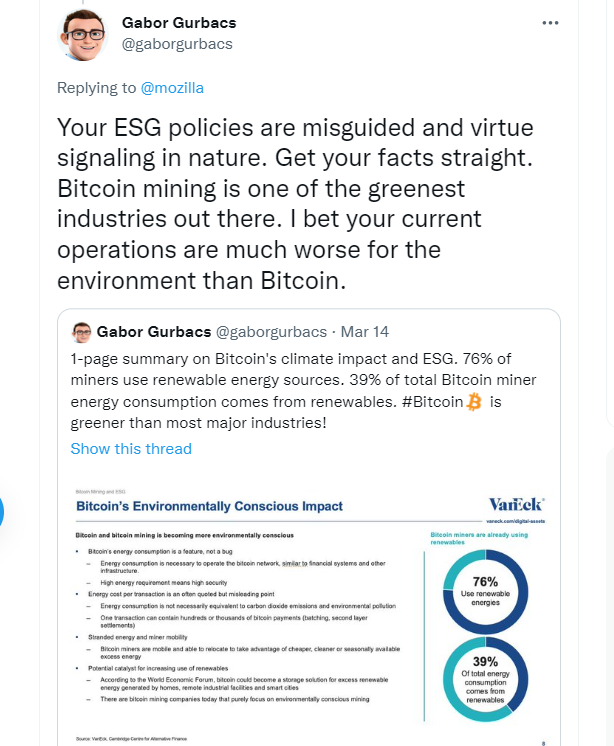
Director of Digital Strategy at American investment firm VanEck Gabor Gurbacs had harsh criticism for Mozilla’s decision to block Bitcoin donations. In an Apr 12 tweet, he called the move “misguided and virtue signaling in nature,” adding that “Bitcoin is one of the greenest industries out there.”
While Bitcoin annually consumes about 204.5 Terawatt hours (TWh) of energy according to data from blockchain researchers at Digiconomist, the actual effect on the climate is much more contested. Proponents contest that miners that secure the network are helping to strengthen energy grids and improve carbon efficiency while operations themselves are increasingly switching to renewable energy.
As reported by Cointelegraph last month, flexible data centers can be used for Bitcoin mining. Flexible data centers can switch between self-generated green energy and tapping into the public grid to reduce the overall environmental impact and stress on the public energy grid.
Crypto storage company Blockstream and Jack Dorsey’s Bitcoin development firm Block Inc announced on Apr 8 that they would work with Elon Musk’s Tesla to build a solar-powered BTC mining facility in Texas, the new hotbed of clean energy mining operations.
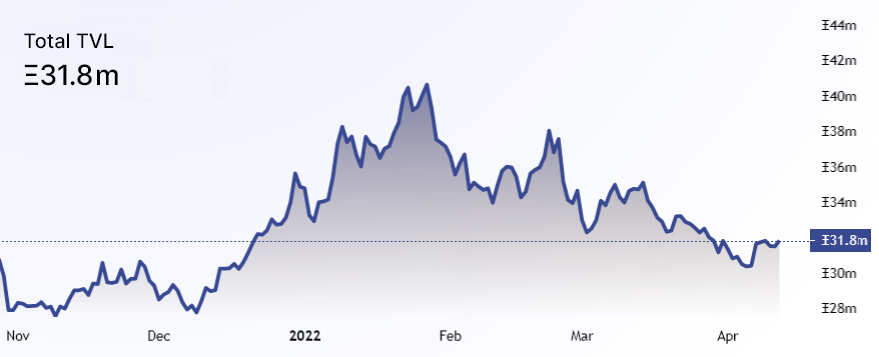
Ether (ETH) lost the critical $3,000 psychological support level on April 11 after a 16% weekly negative performance. Bulls were definitively caught by surprise as $104 million in leveraged long futures got liquidated on April 11. Ether’s downturn also followed a decline in the total value locked (TVL) in Ethereum smart contracts.
Ethereum network TVL in ETH. Source: Defi Llama
The metric peaked at 40.6 million Ether on Jan. 27, and has since dropped by 22%. This indicator could partially explain why Ether could not withstand the adversity brought by Bitcoin’s (BTC) 13% weekly negative move.
However, the leading altcoin has catalysts of its own because Ethereum developers implemented the network’s first-ever “shadow fork” on April 11. The testnet update created an area for developers to stress-test their assumptions around the network’s complex shift to proof-of-stake.
More importantly, one needs to analyze how professional traders are positioning themselves and there’s no better gauge than derivatives markets.
The futures premium is back to bearish levels
To understand whether the current bearish trend reflects top traders’ sentiment, one should analyze Ether’s futures contracts premium, also known as a “basis.” Unlike a perpetual contract, these fixed-calendar futures do not have a funding rate, so their price will differ vastly from regular spot exchanges.
A trader can gauge the market sentiment by measuring the expense gap between futures and the regular spot market. A neutral market should present a 5% to 12% annualized premium (basis) as sellers request more money to withhold settlement longer.
The above chart shows that Ether’s futures premium stood above the 5% neutral threshold between March 25 and April 6, but later weakened to 3%. This level is typically associated with fear or pessimism because futures market traders are reluctant to open leveraged long (buy) positions.
Long-to-short data confirms worsening conditions
The top traders’ long-to-short net ratio excludes externalities that might have impacted the longer-term futures instruments. By analyzing these whale positions on the spot, perpetual and futures contracts, one can better understand whether professionals effectively become bearish.
Exchanges’ top traders Ether long-to-short ratio. Source: Coinglass
Firstly, one should note the methodological discrepancies between different exchanges, so the absolute figures have lesser importance. Yet, since April 5, there has been a considerable decline in the long-to-short ratio of every major derivatives exchange.
Data signals that whales have been increasing their bearish bets over the past week. For instance, the Binance whales held a 1.05 long-to-short ratio on April 5, but gradually reduced it to 0.88. Furthermore, the OKX top traders moved from a 2.11 favoring longs to the current 1.35.
From the perspective of the metrics discussed above, there might not be an indicator pointing to extreme bearishness but the futures basis rate and the top traders’ long-to-short ratio worsened over the past week.
Furthermore, the TVL in Ethereum smart contracts signals a decline in use. The constant delays in the proof-of-stake migration could be pulling investors’ attention away and driving decentralized finance (DeFi), gaming, and nonfungible (NFT) projects to competing networks. In turn, traders have been focusing their attention on more promising altcoins and consequently diminishing the demand for Ether.
The views and opinions expressed here are solely those of the author and do not necessarily reflect the views of Cointelegraph. Every investment and trading move involves risk. You should conduct your own research when making a decision.