As Bitcoin (BTC) finally broke out of the $46,000 resistance on March 27, traders were quick to conclude that the bearish trend was gone for good. Even as the price hit its highest level in 84 days, derivatives metrics and Asia’s Tether premium still show a lack of bullish sentiment.
While analysts will struggle to find a rationale for the modest 5.8% 24-hour gain that pushed Bitcoin above $48,500, we still have to account for the daily 3.8% average volatility.
For instance, over the past 12 months, BTC presented a daily swing higher than 5.8% in 44 instances, ranging from a negative 14.4% on May 19, to a 14.6% price increase on Feb. 28.
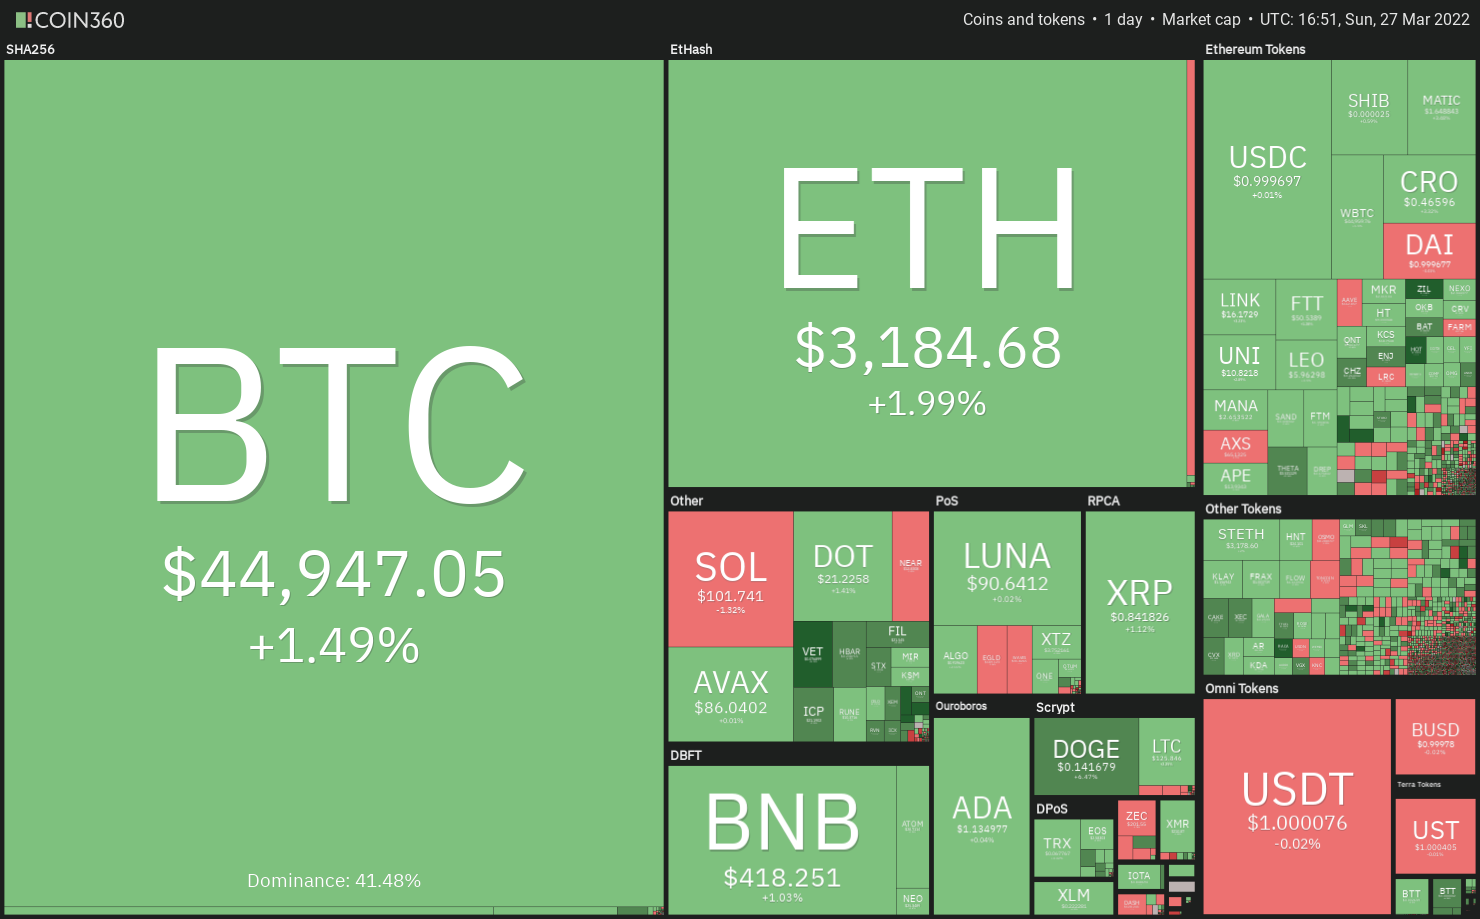
Bitcoin’s rally caused the broader crypto market capitalization to hike 15.3% over the past week, reaching $2.2 trillion. Curiously, Bitcoin gained 15.7% and Ether (ETH) 15.8%, pretty much in line with the altcoin’s average.
Still, they were no match for the altcoin rally that followed. Below are the top gainers and losers among the 80 largest cryptocurrencies by market capitalization.
Weekly winners and losers among the top-80 coins. Source: Nomics
Zilliqa (ZIL) announced a partnership with payments infrastructure provider Ramp, and is expected to release its metaverse project called Metapolis which will be built on unreal gaming engine, the same 3D technology behind Fortnite and PlayerUnkown’s Battlegrounds, or PUBG.
Axie is also expected to launch the Origin game over the next couple of weeks, which includes a reimagined storyline and the addition of active cards for eye and ear body parts.
Tether premium indicates weak retail demand
The OKX Tether (USDT) premium is a good gauge of China-based retail trader demand for crypto. It measures the difference between China-based USDT peer-to-peer trades and the official U.S. dollar currency.
Excessive buying demand tends to pressure the indicator above fair value, which is 100%. On the other hand, Tether‘s market offer is flooded during bearish markets, causing a 4% or higher discount.
Tether (USDT) peer-to-peer vs. USD/CNY. Source: OKX
Currently, the Tether premium stands at 99.9%, which is neutral. Thus, data shows retail demand is not picking up despite the price improvement, which is odd considering that the total cryptocurrency capitalization jumped 15.3%.
Funding rates show undecided traders
Perpetual contracts, also known as inverse swaps, have an embedded rate that is usually charged every eight hours. Perpetual futures are retail traders‘ preferred derivatives because their price tends to track regular spot markets perfectly.
Exchanges use this fee to avoid exchange risk imbalances. A positive funding rate indicates that longs (buyers) demand more leverage. However, the opposite situation occurs when shorts (sellers) require additional leverage, causing the funding rate to turn negative.
Weekly winners and losers among the top-80 coins. Source: Nomics
Notice how the accumulated seven-day funding rate is uneventful in most cases. This data indicates a balanced leverage demand between longs (buyers) and sellers (shorts).
For example, Solana’s (SOL) positive 0.20% weekly rate equals 0.8% per month, which is not a burden for traders building futures positions. Typically, when there‘s an imbalance caused by excessive optimism, that rate can easily surpass 5% per month.
Some might say that the Bitcoin price hike above $47,000 was the nail in the coffin for the bears because the cryptocurrency displayed strength during global macroeconomic uncertainty.
At the moment, there are no signs of bullishness from Asian retail traders, as measured by the CNY Tether premium and there is no indication of pressure from leverage longs (buyers) on futures markets. Therefore, the overall crypto market sentiment is neutral.
The views and opinions expressed here are solely those of the author and do not necessarily reflect the views of Cointelegraph. Every investment and trading move involves risk. You should conduct your own research when making a decision.
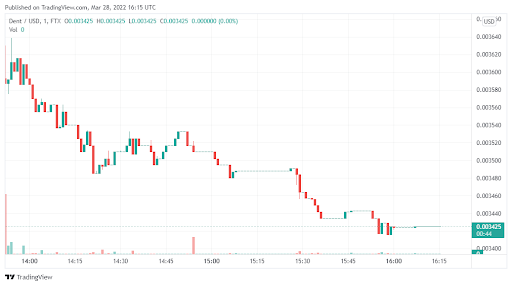
As the crypto market rallies at the start of the week, coins like Dent (DENT) have posted double-digit daily gains with weekly rallies of over 30% or so. But as with every bullish run, a pullback is always around the corner. For DENT, there seems to be a capped upward potential. Here is what you need to know:
The coin has rallied by 11% in the last 24 hours
Dent is also up by around 30% over the last 7 days.
The recent upswing is likely to continue before capping at a crucial resistance.
Data Source: Tradingview
Dent (DENT) – Why is upward momentum capped?
After gaining nearly 30% over the last 7 days, it seems like DENT still has some room to grow. However, we do not expect the coin to truly trend upwards for long. At the moment, DENT is trading at $0.034. There are two important resistance zones to watch.
The first one is the $0.035 mark, and the second is the $0.41. As of now, it seems like DENT is testing the first resistance zone but is yet to break through. In fact, in 24-hour trading, we saw some significant pullback from the morning sessions, where daily gains dropped from 15% to around 11%.
This could suggest that weakness at $0.35 is coming, and DENT may as well fail to surge past that first hurdle. If indeed this happens, DENT is likely to fall sharply before the end of the week. But if bulls can rally above $0.35, then $0.41 will be next.
Is DENT worth buying?
There is no momentum right now, to be fair. Yes, the coin has pushed up in the last 7 days, but we expect it to trade mostly sideways in the coming days as bulls try to smash past the crucial resistance we have talked about above. It would therefore be better to wait until the price has pulled back slightly.
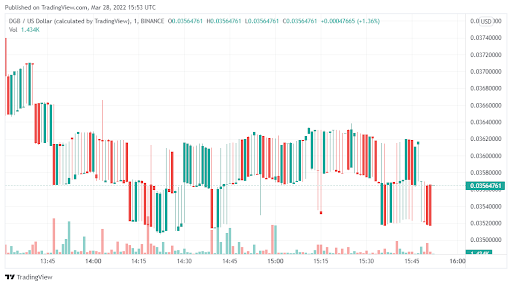
DigiByte (DGB) has surged over the last 24 hours in what appears to be a decisive bullish breakout. The coin has also been rising over the past month and has reclaimed a lot of losses seen this year. But how much momentum does it actually have? More details are below but first, here are some important points:
DGB is up around 90% over the last 30 days and over 100% in 14 days.
The coin had managed to post 30% gains in 24-hour intraday trading.
There however remains a serious risk of a sell-off
Data Source: Tradingview
DigiByte (DGB) – Analysis of this uptrend
For the most part of 2022, DigiByte remained largely on a downtrend with a few bursts upwards here and there. But in the last 14 days, it seems the coin has just shot up, gaining nearly 90%. DGD is now testing $0.4. The last time it did this was in June last year.
The $0.4 mark will be a decisive resistance level. We expect investors to start locking in profits at around that price and as such, it is highly unlikely that DGB will cross over. Also, looking at the 3-day chart, the coin is poised for a significant pullback.
While this may not happen in a few days, overall, we expect DGB to be firmly rejected at $0.4 and will firmly fall towards $0.28 in the near term. This will be a downswing of more than 30%.
Is DigiByte (DGT) worth buying now?
The momentum that DGB has built over the last 14 days is about to slow. The coin is currently at $0.36. We believe the upside based on the chart is capped at $0.4. It wouldn’t, therefore, make any sense to buy now.
However, please watch the rejection at $0.4. DGB is likely to fall back by at least 30% to around $0.28. This would be the best price to enter once more.
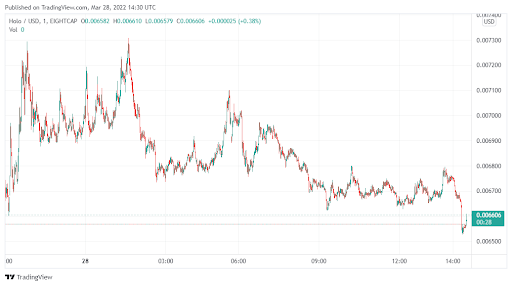
Holo Chain (HOT) has trended strongly upwards over the last few days. The coin has managed to post gains over the last three trading sessions in a row. As such, it has now turned bullish. But how far can it actually rise? We’ll discuss this more but first, some important facts:
The recent rally now means that HOT has smashed past its 30-day high
The coin has also regained over 50% from its lowest level this year.
HOT was also up by around 15% over the last 24 hours
Data Source: Tradingview
Holo Chain (HOT) – price prediction and analysis
Holo was already surging the past week. New announcements on the ecosystem last week had pushed 7-day gains to over 30%. However, for most analysts, the key to watch during that rally was the overhead resistance of $0.6.
Based on the price action today, it seems HOT has smashed that threshold. As a result, HOT is expected to keep the uptrend going and is likely to test $0.01 in the near term. This will represent gains of around 50% from the current price now.
Besides, HOT has also pushed above the average trading price of the last 30 days by over 50%. This indicates that investors are bullish about the coin and the recent gains we have seen are bound to continue. The only way this bullish momentum slows is if bulls fail to keep the price above $0.06.
Why Could Holo Chain (HOT) be perfect?
In the short term, we expect HOT to run a bit further. In fact, gains of at least 30% appear likely in the week ahead. But for long-term investors, the fact that HOT still has a market cap of less than $1 billion means that there is quite some potential. It is likely the coin will hit $0.03 before the end of the year.
Bitcoin (BTC) and several altcoins surprised many with their newfound strength during the weekend. Bitcoin’s rally easily sliced through the $45,900 level, which according to Glassnode was an area of resistance because several investors had purchased near that level when Bitcoin was declining after hitting its all-time high in November.
Bitcoin’s strength may have attracted buying in several altcoins, which are still languishing below their 52-week high. The rally in Bitcoin and the bottom fishing in altcoins has boosted investor sentiment, pushing the Crypto Fear and Greed Index into the “greed” territory.
Interestingly, the crypto markets have held a large part of their gains despite the tepid performance of the U.S. stock markets on March 28. This suggests that the crypto markets may be in the early stages of decoupling from the equity markets.
Could buyers sustain the momentum and clear the overhead resistance levels? Let’s study the charts of the top-10 cryptocurrencies to find out.
BTC/USDT
Bitcoin hesitated on March 26 as seen from the inside-day candlestick. This indicated indecision among the bulls and the bears. This uncertainty resolved to the upside on March 27 as the bulls regrouped and propelled the price above the overhead resistance at $45,400.
BTC/USDT daily chart. Source: TradingView
The sharp rally of the past few days has pushed the relative strength index (RSI) into the overbought zone for the first time since October 2021. This suggests that the momentum favors the buyers.
The bears may attempt to stall the up-move at the resistance line of the ascending channel but if bulls overcome this barrier, the BTC/USDT pair could rally to the psychological level at $50,000 and later to $52,000.
If the price turns down from the resistance line, the buyers will try to flip $45,400 into support. If they succeed, it will suggest that the up-move may continue. The bears will have to pull and sustain the price below $45,400 to weaken the bullish momentum.
ETH/USDT
Ether (ETH) broke above the symmetrical triangle on March 25 but the bulls could not sustain the higher levels. However, the buyers did not cede ground to the bears and resumed their purchase on March 26.
ETH/USDT daily chart. Source: TradingView
The momentum picked up on March 27 and the ETH/USDT pair has reached $3,411 where the bulls may encounter a minor resistance. If bulls bulldoze their way through, the ETH/USDT pair could rally toward the psychological level at $4,000.
Alternatively, if the price turns down from $3,411, the pair could retest the breakout level from the triangle. If the price rebounds off this level, it will suggest strong buying on dips. The bulls will then again try to resume the up-move.
The bears will have to pull and sustain the price inside the triangle to suggest that the bullish momentum may have weakened.
BNB/USDT
BNB continued its northward march and has reached the overhead resistance at $445. The bears are likely to defend this level with vigor.
BNB/USDT daily chart. Source: TradingView
The rising 20-day exponential moving average (EMA) ($402) and the RSI near the overbought zone indicate that bulls are in control. If buyers thrust the price above $445, the BNB/USDT pair could rally toward the psychological level at $500. This level could again act as a strong resistance.
If the price turns down from $500 but does not break below $445, it will suggest that the bulls have flipped the level into support. That will increase the likelihood of a break above the overhead resistance.
Contrary to this assumption, if the price turns down from $445, the pair could drop to the 20-day EMA.
XRP/USDT
Ripple (XRP) turned up on March 26, indicating that bulls are buying on minor dips. The buyers pushed the price above the strong resistance at $0.86 but are facing resistance near $0.91.
XRP/USDT daily chart. Source: TradingView
Both moving averages are sloping up and the RSI is in the positive zone. If buyers do not allow the price to slide below $0.86, the prospects of a break above $0.91 increase. If that happens, the XRP/USDT pair could rally to the psychological level at $1.
This positive view will be invalidated if the price turns down from the current level or the overhead resistance at $0.91 and plummets below the moving averages. Such a move could pull the price to the strong support at $0.70.
ADA/USDT
Cardano (ADA) has continued its recovery and the price has reached the overhead resistance at $1.26 where the bears are likely to mount a strong defense.
ADA/USDT daily chart. Source: TradingView
The rising 20-day EMA ($1) and the RSI in the overbought zone suggest that bulls are in control. If the price turns down from overhead resistance but the bulls do not give up much ground, it will increase the possibility of a break above $1.26.
If that happens, the ADA/USDT pair could rally to $1.60 and then march higher toward $1.80. This bullish view will invalidate if the price turns down from the overhead resistance and breaks below the psychological level at $1.
LUNA/USDT
Terra’s LUNA token has been stuck in a tight range between the overhead resistance at $96 and the support at the 20-day EMA ($90). This tight-range trading could soon lead to a sharp trending move.
LUNA/USDT daily chart. Source: TradingView
The rising 20-day EMA and the RSI in the positive territory suggest that the path of least resistance is to the upside. If buyers propel and sustain the price above $96, the LUNA/USDT pair could retest the all-time high at $105.
This level is likely to act as a major obstacle but if bulls overcome it, the uptrend may resume. The pair could then rally to $125. This positive view will invalidate in the short term if the price turns down and breaks below the 20-day EMA. That could open the gates for a possible decline to $82.
SOL/USDT
After trading near the overhead resistance at $106 for a few days, Solana (SOL) broke and closed above the level on March 27. The moving averages have completed a bullish crossover and the RSI is near the overbought zone, indicating an advantage to buyers.
SOL/USDT daily chart. Source: TradingView
If bulls sustain the price above $106, the SOL/USDT pair could rise to $122. The bears are expected to defend this level aggressively. If the price turns down from this level and breaks below $106, it will suggest that the pair may remain range-bound for a few more days.
The bulls will have to clear the overhead hurdle at $122 to signal the start of a new potential uptrend. The pair could then start its up-move, which could reach the overhead resistance zone between $158 and $163.
Avalanche (AVAX) rebounded off the 20-day EMA ($83) on March 26, indicating that bulls are buying on dips. The buyers will now try to sustain the price above the immediate resistance at $92.
AVAX/USDT daily chart. Source: TradingView
If they succeed, the AVAX/USDT pair could rally to the overhead resistance zone at $98 to $100. This is an important zone for the bears to defend because a break and close above it could extend the rally to $120.
If the price turns down from the overhead zone, the bears will try to pull the pair to the moving averages. If the price rebounds off this level, the pair may remain stuck between the moving averages and the overhead zone for a few days.
DOT/USDT
Polkadot (DOT) picked up momentum on March 27 and has reached the stiff overhead resistance at $23. The upsloping 20-day EMA ($20) and the RSI near the overbought zone suggest that bulls have the upper hand.
DOT/USDT daily chart. Source: TradingView
If bulls drive and sustain the price above $23, the DOT/USDT pair could rally to $28. If bulls succeed in clearing this hurdle, the up-move may extend to $30 and later to $32.
Alternatively, if the price turns down from the overhead resistance, the bears will try to pull the pair to the 20-day EMA. A strong rebound off this support will suggest that bulls continue to buy on dips. That will increase the possibility of a break above the overhead barrier.
This positive view will invalidate if the price breaks below the moving averages. That could extend the consolidation between $16 and $23 for a few more days.
DOGE/USDT
The bulls flipped the 50-day simple moving average (SMA) ($0.13) into support on March 25. This attracted strong buying in Dogecoin (DOGE), putting it on the path to a possible rally to $0.17.
DOGE/USDT daily chart. Source: TradingView
The moving averages are on the verge of a bullish crossover and the RSI is near the overbought zone, indicating that buyers have the upper hand. If bulls drive the price above $0.17, the DOGE/USDT pair could rise to $0.22.
If the price turns down from $0.17 but does not give up much ground, it will suggest that the traders expect the recovery to continue.
Conversely, if the price turns down sharply from the current level or the overhead resistance, it will signal that the pair may remain range-bound between $0.12 and $0.17 for a few more days.
The views and opinions expressed here are solely those of the author and do not necessarily reflect the views of Cointelegraph. Every investment and trading move involves risk. You should conduct your own research when making a decision.
“Stargate Finance” has been trending on Twitter for the past week and while it’s too early to call for a full-blown DeFi bull market, traders have been shoveling funds into the project, which claims to be a “composable omni-chain native asset bridge.”
Data from Cointelegraph Markets Pro and TradingView shows STG was listed on exchanges on March 17 and its price has climbed 438% from a low of $0.665 to a high of $3.58 on March 25.
STG/USDC 1-hour chart. Source: TradingView
Here’s a look at some of the developments with the protocol that have attracted DeFi users and boosted the price of STG ahead of its initial community auction.
Cross-chain composability
Interoperability has been a growing theme across the cryptocurrency ecosystem and this theme continues to expand as investors realize that the future Metaverse will be comprised of multiple interconnected blockchains.
While many of the older DeFi protocols have yet to develop a plan to integrate the most popular chains, Stargate was designed with cross-chain composability as its main feature. This allows a cross-chain transfer to be composed with smart contracts on the destination chain.
According to Startgate Finance, this helps to simplify the swap process and maximizes the degree of flexibility by making the process more convenient for users and opening new opportunities for cross-chain applications.
The project also offers instant guaranteed finality, which ensures that any transfer request committed on the course chain will also be committed on the destination chain as well. Unified liquidity eliminates the need for intermediate tokens as each supported chain has a pool of liquidity for the supported native assets.
The networks currently supported by Stargate F include Ethereum (ETH), BNB Smart Chain (BSC), Polygon (MATIC), Avalanche (AVAX), Arbitrum, Optimism and Fantom (FTM).
Hype builds over community auctions
A community auction begins on March 30 and users that obtained pre-approval for their wallets or bonded funds before March 17 are eligible for SGT tokens at a price of $0.25. Tokens bought during the auction include a one-year lock-up, followed by a linear unlock period that lasts six months.
Pre-approved accounts are able to purchase a maximum of 18,657 STG, while those that bonded can obtain up to 4,668 STG. Any tokens that remain after Round 1 will be split equally and made available to buy in Round 2 for those who obtained the maximum eligible amount during Round 1.
A third factor helping to attract attention and users to Stargate Finance are the attractive stablecoin farming yields across its supported networks.
Top yielding stablecoin farms on Stargate. Source: Stargate
The high yields on stablecoins have already managed to attract $2.95 billion in liquidity locked on the protocol, according to data from Defi Llama, which makes Stargate Finance the thirteenth largest DeFi protocol by TVL.
Total value locked on Stargate. Source: Defi Llama
While it’s still too early to tell how Stargate Finance will perform in the long term and whether its token price can hold its recent gains, it appears as though interoperability and a focus on stablecoin liquidity are the two key factors required for DeFi protocols looking for longevity in the crypto ecosystem.
The views and opinions expressed here are solely those of the author and do not necessarily reflect the views of Cointelegraph.com. Every investment and trading move involves risk, you should conduct your own research when making a decision.
Please be aware that some of the links on this site will direct you to the websites of third parties, some of whom are marketing affiliates and/or business partners of this site and/or its owners, operators and affiliates. We may receive financial compensation from these third parties. Notwithstanding any such relationship, no responsibility is accepted for the conduct of any third party nor the content or functionality of their websites or applications. A hyperlink to or positive reference to or review of a broker or exchange should not be understood to be an endorsement of that broker or exchange’s products or services.
Risk Warning: Investing in digital currencies, stocks, shares and other securities, commodities, currencies and other derivative investment products (e.g. contracts for difference (“CFDs”) is speculative and carries a high level of risk. Each investment is unique and involves unique risks.
CFDs and other derivatives are complex instruments and come with a high risk of losing money rapidly due to leverage. You should consider whether you understand how an investment works and whether you can afford to take the high risk of losing your money.
Cryptocurrencies can fluctuate widely in prices and are, therefore, not appropriate for all investors. Trading cryptocurrencies is not supervised by any EU regulatory framework. Past performance does not guarantee future results. Any trading history presented is less than 5 years old unless otherwise stated and may not suffice as a basis for investment decisions. Your capital is at risk.
When trading in stocks your capital is at risk.
Past performance is not an indication of future results. Trading history presented is less than 5 years old unless otherwise stated and may not suffice as a basis for investment decisions. Prices may go down as well as up, prices can fluctuate widely, you may be exposed to currency exchange rate fluctuations and you may lose all of or more than the amount you invest. Investing is not suitable for everyone; ensure that you have fully understood the risks and legalities involved. If you are unsure, seek independent financial, legal, tax and/or accounting advice. This website does not provide investment, financial, legal, tax or accounting advice. Some links are affiliate links. For more information please read our full risk warning and disclaimer.
Bitcoin (BTC) is attempting to notch its second successive weekly gains and end at the highest weekly closing price year-to-date. According to on-chain data from Glassnode, the recovery in Bitcoin’s price was driven by demand in the spot markets. This is likely to cheer the bulls because history suggests that spot market demand leads to sustained upside.
Another positive sign is the strong demand for the ProShares Bitcoin Strategy exchange-traded fund (BITO) in the past two weeks, which pushed its exposure to a record high. Arcane Research said the strong inflows “suggest that Bitcoin appetite through traditional investment vehicles is increasing.”
Along with Bitcoin, the broader crypto space is also attracting investors. According to research firm Fundstrat, venture capital buyers pumped $4 billion into the crypto space in the last three weeks of February.
Could buyers sustain the momentum and extend the relief rally in Bitcoin and altcoins? Let’s study the charts of the top-5 cryptocurrencies that may outperform in the short term.
BTC/USDT
The long wick on Bitcoin’s March 25 candlestick shows that the bears are defending the overhead resistance at $45,400. A minor positive is that the bulls have not given up much ground, suggesting that the traders are not closing their positions in a hurry.
BTC/USDT daily chart. Source: TradingView
The 20-day exponential moving average ($42,025) has turned up and the relative strength index (RSI) is in the positive territory, indicating that bulls are in command. If buyers drive the price above $45,400, the BTC/USDT pair could rise to the resistance line of the ascending channel.
This level may again act as an obstacle, but if bulls overcome it the pair could rally to the psychological level at $50,000.
Contrary to this assumption, if the price turns down from $45,400, the bears will try to pull the pair to the strong support at $42,594. This is an important level to watch on the downside because if bulls flip it to support, the possibility of a break above $45,400 increases.
The bears will have to pull and sustain the price below the moving averages to signal that the bulls have been pushed to the back foot.
BTC/USDT 4-hour chart. Source: TradingView
The 4-hour chart shows that the price turned down from the overhead resistance but the bulls did not allow the pair to break below the 20-EMA. This suggests that traders are buying on every minor dip.
The rising moving averages and the RSI near the overbought zone suggest that the path of least resistance is to the upside. This positive view will invalidate in the short term if the price breaks and sustains below the 20-EMA. In that case, the pair may drop to $42,594.
ADA/USDT
Cardano (ADA) has been sustaining above the critical level at $1 for the past few days. This indicates that bulls who may have purchased at lower levels are not booking profits aggressively as they expect the recovery to continue.
ADA/USDT daily chart. Source: TradingView
The moving averages have completed a bullish crossover and the RSI is in the positive zone, indicating that bulls have the upper hand. If buyers push and sustain the price above $1.26, the bullish momentum may pick up and the ADA/USDT pair could rally to the next critical resistance at $1.60.
Alternatively, if the price turns down from $1.26 but rebounds off $1, it will suggest that the pair may remain range-bound between the two levels for a few more days. The bears will have to sink and sustain the price below the moving averages to invalidate the bullish view.
ADA/USDT 4-hour chart. Source: TradingView
The 4-hour chart shows that the bears are aggressively defending the overhead resistance at $1.20 but a minor positive is that the bulls have not allowed the price to sustain below the 20-EMA. If the price rises from the current level, the bulls will again try to clear the hurdle at $1.20 and push the pair to $1.26.
Alternatively, if the price turns down and breaks below the 20-EMA, it will suggest that the bullish momentum has weakened. The pair could then gradually decline toward the strong support at $1.
AXS/USDT
Axie Infinity (AXS) has been trading between $72 and $44 for the past few days. The buyers pushed the price above the overhead resistance on March 25 but could not sustain the higher levels. This indicates that the bears are defending the level with vigor.
AXS/USDT daily chart. Source: TradingView
The moving averages have completed a bullish crossover and the RSI is in the positive territory, suggesting advantage to buyers.
If the price turns up from the current level or rebounds off the 20-day EMA ($56), the bulls will again try to thrust the AXS/USDT pair above $72. If they manage to do that, the up-move may pick up momentum and the pair may rally to $100.
This positive view will invalidate if the price continues lower and breaks below the 20-day EMA. That could keep the pair range-bound for a few more days.
AXS/USDT 4-hour chart. Source: TradingView
The 4-hour chart shows that the bulls pushed the price above the overhead resistance at $72 but could not sustain the higher levels. This may have attracted profit-booking by the short-term traders which pulled the price below the 20-EMA.
If the price turns up from the current level and breaks above $68, it will suggest accumulation on dips. The buyers will then try to clear the obstacle at $72 and start a new up-move.
Contrary to this assumption, if the price sustains below the 20-EMA, the correction could extend to the 50-simple moving average.
Chainlink (LINK) has been trading inside a massive range between $13 and $36 for the past several months. Although bears pulled the price below the support of the range, they could not sustain the breakdown. This suggests that the markets rejected the lower levels.
LINK/USDT daily chart. Source: TradingView
The moving averages have completed a bullish crossover and the RSI is in the positive territory, suggesting that the buyers have the upper hand. The rally may face resistance at the downtrend line but if this barrier is crossed, the LINK/USDT pair could rally to $20.
Alternatively, if the price turns down from the current level, the moving averages are likely to act as strong support. If the price rebounds off it, the possibility of a break above the downtrend line could increase. This positive view will invalidate if the bears pull the price below the moving averages. That could open the doors for a possible drop to $13.
LINK/USDT 4-hour chart. Source: TradingView
The bears are mounting a strong defense at $16.50 but a minor positive is that the buyers have not allowed the price to slip below the 50-SMA. If the price rises from the current level or rebounds off the moving averages, the bulls will try to propel the pair above $16.50. If they succeed, the pair could rally to $17.50.
Contrary to this assumption, if the price breaks below the 50-SMA, it will suggest that the short-term bulls may be closing their positions. There is a minor support at $15 but if it gives way, the pair could slide to $14.
FTT/USDT
FTX Token (FTT) broke and closed above $49 on March 24, completing an ascending triangle pattern. Although buyers pushed the price above the psychological resistance at $50 on March 25, they could not sustain the higher levels.
FTT/USDT daily chart. Source: TradingView
This suggests that the bears have not yet given up and they continue to sell at higher levels. The bears will now try to pull and sustain the price back below $49. If they manage to do that, the aggressive bulls who purchased the breakout from the triangle may get trapped. This could sink the FTT/USDT pair to the 20-day EMA ($45).
If the price rebounds off this level, the buyers will again try to clear the overhead resistance zone between $49 to $52 and resume the up-move.
Conversely, if the price slips below the moving averages, it will suggest that bears are attempting a strong comeback. A break and close below the uptrend line of the triangle will invalidate the bullish pattern. The pair may then decline to $39.
FTT/USDT 4-hour chart. Source: TradingView
The rally above $51 pushed the RSI deep into the overbought territory. Usually, such moves are followed by a sharp correction or consolidation. If bears pull the price below $49, the pair could decline further to the 50-SMA.
If the price rebounds off this level, the buyers will again try to push the pair above $52 and resume the up-move. On the other hand, if bears pull the price below the 50-SMA, the selling could intensify and the pair may drop to $45.
The views and opinions expressed here are solely those of the author and do not necessarily reflect the views of Cointelegraph. Every investment and trading move involves risk, you should conduct your own research when making a decision.
We ask the buidlers in the blockchain and cryptocurrency sector for their thoughts on the industry… and throw in a few random zingers to keep them on their toes!
This week, our 6 Questions go to Mitch Liu, co-founder and CEO of Theta Labs — a decentralized video streaming platform powered by users and built on a new blockchain.
Theta Labs is the organization behind the Theta Network — a fast, green blockchain designed from the bottom up for media and entertainment. In 2019, Mitch launched Theta.tv, a decentralized livestreaming platform that makes use of tokenized bandwidth-sharing to make video content delivery faster and cheaper than mainstream alternatives. Most recently, Mitch and his team launched ThetaDrop, an NFT marketplace powered by the Theta Network.
Mitch has been an investor and entrepreneur in the tech space since 2007. He received a BS in computer science engineering from MIT, conducted research at MIT Media Lab’s “Interactive Cinema” group and received an MBA from the Stanford Graduate School of Business.
1 — What has been the toughest challenge you’ve faced in our industry so far?
I think convincing stakeholders in legacy industries that blockchain and Web3 technologies have a place in their industry’s future. Understandably, this wasn’t as hard with the tech folks — new technologies and new ideas are kind of their bread and butter. But you’d be surprised at how even people in those spaces can be wedded to an older way of doing things. It’s hard to totally reimagine your industry. I don’t blame anyone for that.
In media and entertainment, it has been a little more difficult. The transition from television, radio and Web1 to social media and Web2 seemed pretty intuitive. We’re traveling from a one-directional kind of media to a shared, more collaborative model. Web3 and distributed ledger technology are the same but turbocharged, and a little harder to wrap your head around. But we’ve started to see a shift in the attitudes of media companies. Once people realize how, for example, sharing computer power and bandwidth to reduce cost and energy consumption in video streaming works, the concept clicks for them pretty quickly. One day, Web3 will seem just as intuitive as the TV. I really believe that.
2 — What does decentralization mean to you, and why is it important?
To me, decentralization means taking back control and sharing power with the people and the broader community. Over the last couple of decades, we have sleepwalked into an internet — a society even — that has placed far too much power in the hands of too few people and organizations. Tech giants like Facebook (or Meta) are starting to realize that, and they’re now trying to innovate and change their narrative to convince users that they are still valued.
3 — When you tell people you’re in the blockchain industry, how do they react?
I’m quite lucky. Most of my contemporaries are familiar with what I do and react really well to our work in the blockchain space. I also have an easier answer I can use if I want because, in so many respects, Theta is in the business of media and entertainment, and it’s easier to understand. Blockchain is just the technology that allows us to add new value to the media industry, not necessarily replacing the entire industry.
4 — Which two superpowers would you most want to have, and how would you combine them for good… or evil?
I would have to pick one for practical reasons and one for fun. As much as I like to sleep, it can be such an inconvenience when you have so many plans. I’d love to be able to spend more time on Theta. We have so many exciting projects in the works, and instead of spending my nights with my head on the pillow, it would be great to turn that into productive time — I’d have no distractions!
My second superpower would have to be the ability to fly. Sure, it has a practical transportation element (is that cheating?), but it would also be the greatest adrenaline rush.
5 — If you didn’t need sleep, what would you do with the extra time?
I’d like to spend as much time as possible with my friends and family. Life is too short, and it’s only after a hard week at your desk that you realize how little time there is for the good things in life. To relax and unwind with the people you love is one of life’s blessings, and I’d love to spend more quality time doing it.
6 — What should we be teaching our kids?
Things are almost never as hard as they first appear to be.
Unless you’re blessed with unnatural confidence, taking on a new challenge is always difficult. But I have lost track of all the times in my life when a task seemed impossible yet I ended up either doing better than expected or learning from the experience. And this has nothing to do with my natural ability at any given thing. From what I can see, this is universal. Try your best, and it will be infinitely easier the next time.
A wish for the young, ambitious blockchain community:
I would like to wish them the best of luck in this space… and tell them to keep on innovating! It is them who will lead us to global adoption. We’ll get there… it’s just about when.
Whether you consider cryptocurrency trading as art, science or a game of skill, one thing is beyond dispute: Those who excel at it are not the traders who maintain the longest series of lucky one-offs but those who establish sustainable trading processes yielding consistent returns.
Ask a sample of seasoned pros if they would prefer to catch one obscure token’s 300%-in-a-day brush with fame or learn a strategy that systematically generates a 3% return on investment. You will be surprised how many of them (likely close to 100% of the sample) prefer modest yet systematic profits.
How does one make their trading processes more systematic? One way is to rely on automated data analytics tools with a proven track record of consistent performance. One such tool is the VORTECS™ Score, an artificial intelligence (AI)-powered algorithm exclusively available to the subscribers of Cointelegraph Markets Pro. Its job is to compare the current combination of trading and social metrics around each crypto asset to past ones, giving traders a heads-up when historical conditions begin to look ripe for a rally.
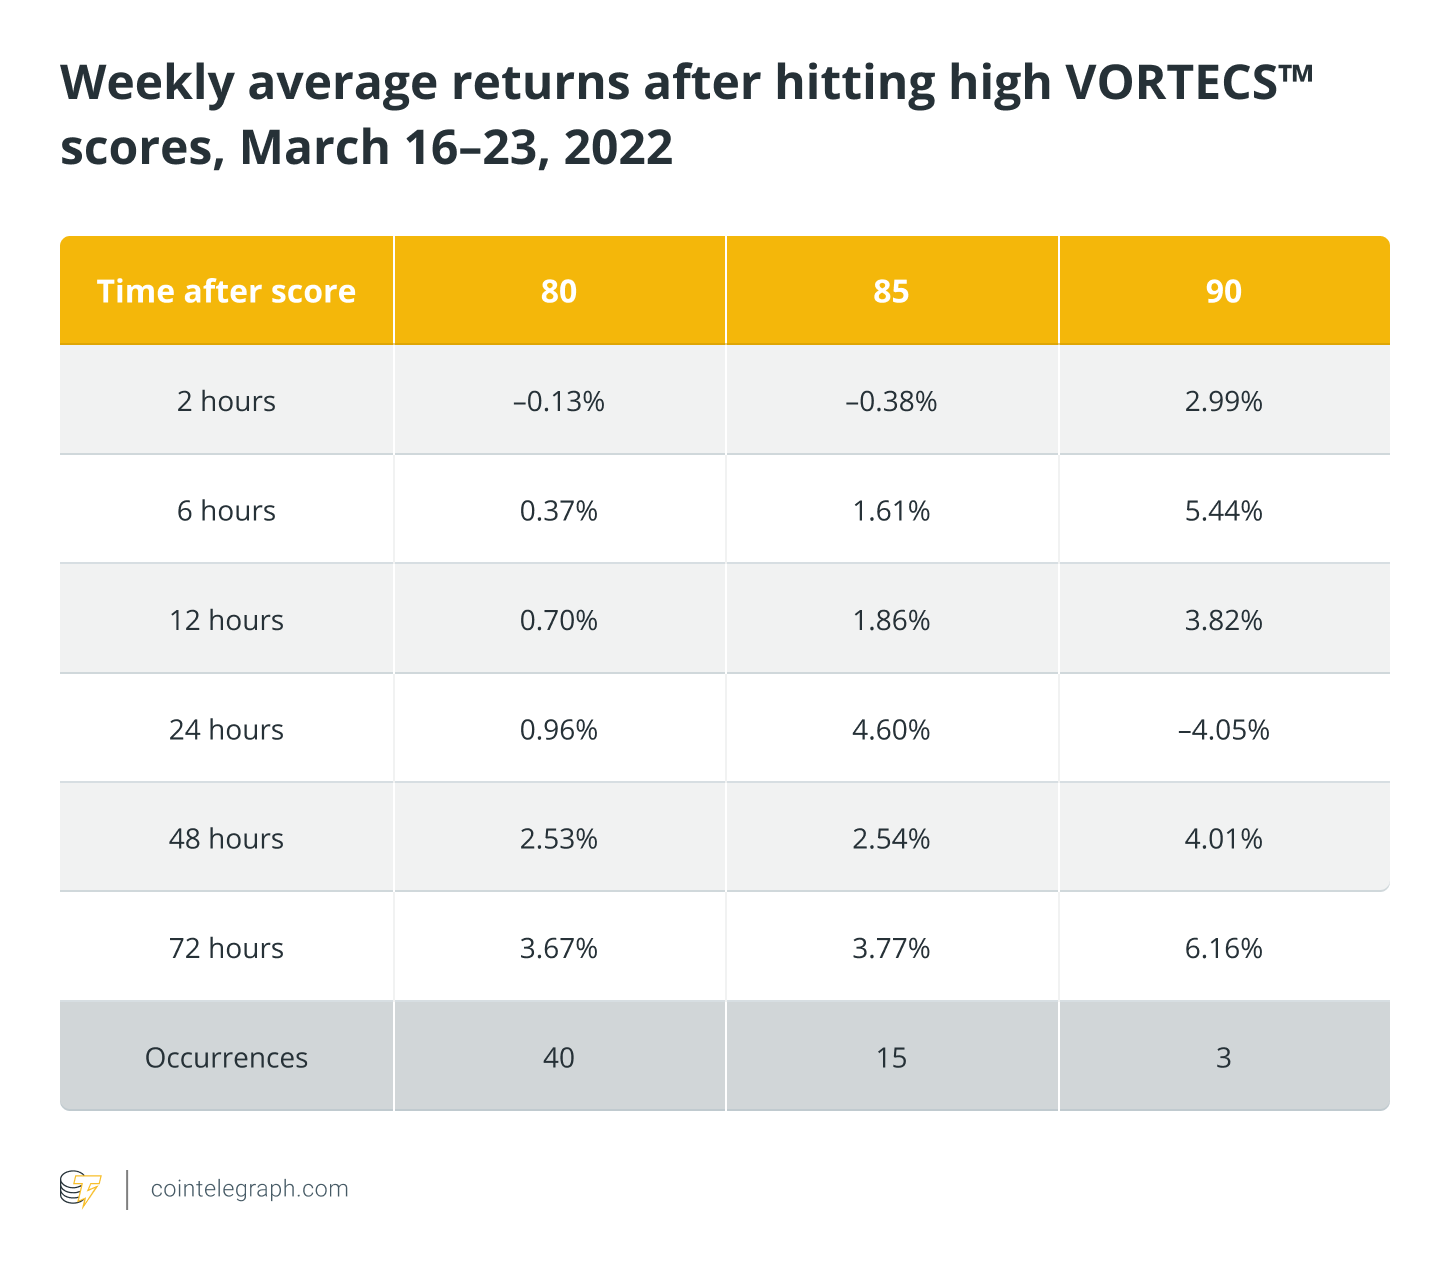
Here are some numbers from an average week in the March sideways market. To understand what they mean, you only need to wrap your head around two simple notions. First, the higher the token’s VORTECS™ Score, the more favorable its outlook is, historically speaking. Scores of 80 and above are conventionally considered to be strongly bullish. Meanwhile, Scores above 90 indicate the algorithm’s extreme confidence that, in the past, similar patterns consistently showed up ahead of massive rallies.
Second, the algorithm is designed to detect patterns of trading activity and social sentiment that in the past preceded big upsides by 12 to 72 hours. On average, assets tend to perform better after longer times from hitting high Scores.
The data from this week largely supports this observation. As the table shows, forty coins that hit the VORTECS™ Score of 80 added an average of 2.53% of value 48 hours after reaching the threshold and 3.67% after 72 hours. The average gains generated by the assets that hit the Score of 90 are less reliable because they are based on only three observations: nineties occur way less frequently than eighties. Nevertheless, in most weeks, nineties outperform eighties, as was the case this week.
This week’s average returns are representative of the broader picture of how the VORTECS™ algorithm performs. Over one year between January 2021-2022, crypto assets that reached the Score of 80 delivered an average gain of 2.45% after 72 hours. The 90-hitters yielded 4.46% after 72 hours.
While these numbers may look modest, more than a year’s worth of observations speak to their consistency. This makes the VORTECS™ Score a sound addition to the arsenal of those who wish to make their trading strategies more systematic.
Cointelegraph is a publisher of financial information, not an investment adviser. We do not provide personalized or individualized investment advice. Cryptocurrencies are volatile investments and carry significant risk including the risk of permanent and total loss. Past performance is not indicative of future results. Figures and charts are correct at the time of writing or as otherwise specified. Live-tested strategies are not recommendations. Consult your financial adviser before making financial decisions.