The volatility of the crypto market can be very dangerous for short-term trades. However, it is possible to get very decent returns on capital if you decide to focus solely on long-term plays. In fact, most coins in the market will always deliver value over time. Here is what to look for in long term coins:
Check the underlying business structure and product.
The project needs to have deep-pocketed and serious investors or backers
Ensure the coin also has some trade volume as well.
With that said, we thought it would be nice to pick out at least 3 coins that could help you unlock long-term value in crypto. Here they are:
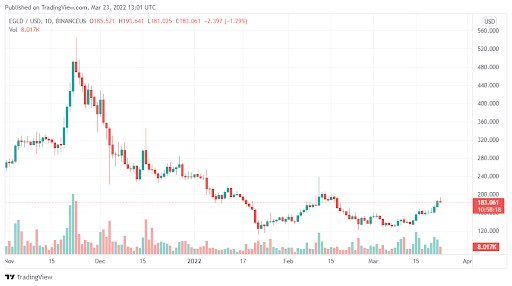
Elrond (EGLD)
Elrond (EGLD) is a promising blockchain designed to address the key challenges associated with older chains like Ethereum and Bitcoin. The platform offers fast, low-cost, and highly efficient transactions.
Data Source: Tradingview
It is seen as one of the main challengers to Ethereum’s dominance. Over the last few months, Elrond has been getting a lot of investment and ecosystem funds to help expand its reach. It is an asset that has the capacity to offer incredible long-term value.
Harmony (ONE)
Harmony (ONE) is also another blockchain project that was built to help facilitate the creation of innovative DAPPs. It is designed to promote low gas fees, faster speeds, and ease of use among the community. The Harmony project has been around for several years and still remains a high potential coin for the long term.
Compound Finance (COMP)
DeFi is expected to become a very central part of the blockchain industry. Compound Finance (COMP) is one of the newer, more promising projects in DeFi that has the potential of going even further. It’s one of those coins that you buy and hold for a few years. The value unlocked here will be quite impressive.
Development across the cryptocurrency ecosystem continues to move forward despite the day-to-day whipsaw price movements and this progress is furthering the public’s awareness of Web3 and the value of blockchain technology.
One project that has been climbing the charts amid a marketing push to develop better brand recognition is Fetch.ai, a protocol focused on building a token-based decentralized machine learning network capable of supporting the smart infrastructure being built around the digital economy.
Data from Cointelegraph Markets Pro and TradingView shows that the price of FET has climbed 43.13% over the past two days, rallying from a low of $0.322 on March 21 to an intraday high at $0.46 on March 23 as its 24-hour trading volume underwent a five-fold increase.
FET/USDT 4-hour chart. Source: TradingView
Three reasons for the building interest in Fetch.ai are the launch of a $150 million development fund, plans to further integrate the project into the Cosmos ecosystem and the recent launch of a large-scale marketing campaign.
Fetch.ai launches a $150 million development fund
The biggest news to come out of the Fetch ecosystem was the March 22 launch of a $150 million ecosystem development fund, in conjunction with MEXC Global, Huobi and Bybit, that is aimed at attracting developers and established projects to the Fetch.ai ecosystem.
Ecosystem development funds have become a popular theme across the cryptocurrency community as projects have found them to be a useful way of attracting new projects and users to their protocols in a field that is becoming increasingly crowded and difficult in which to gain traction.
Deeper integration with Cosmos
A second major development bridging increased attention to Fetch.ai has been its ongoing integration with the Cosmos ecosystem and Interblockchain Communication Protocol.
A new governance proposal is live!
This proposal seeks to upgrade the @Fetch_ai chain to Cosmos SDK v0.45 & IBC v2.2.0. With this, we can be enabled on Osmosis DEX/allow IBC transfers between us and other chains like @osmosiszone@cosmos
Fetch officially joined the list of projects that were launching within the interoperability-focused Cosmos ecosystem in February and it is currently in the process of upgrading the Fetch.ai chain to allow IBC transfers between supported networks.
Cosmos has been one of the most active and growing ecosystems over the past six months despite the weakness in the wider cryptocurrency market, which has the potential to benefit Fetch by bringing increased token liquidity and access to a greater pool of investors.
The third factor helping to increase the awareness of Fetch has been an increased focus on marketing the project to the wider public, including a partnership with Formula 1 driver Alex Albon.
On top of this Formula 1 sponsorship, marketing for Fetch has also begun to appear in highly visible areas, including digital billboards in Times Square, New York, and subway and bus terminal advertisements.
Fetch.ai has also begun to recruit crypto influencers to help increase awareness and it has benefited from being listed on the Voyager app on March 18.
VORTECS™ data from Cointelegraph Markets Pro began to detect a bullish outlook for FET on March 21, prior to the recent price rise.
The VORTECS™ Score, exclusive to Cointelegraph, is an algorithmic comparison of historical and current market conditions derived from a combination of data points including market sentiment, trading volume, recent price movements and Twitter activity.
VORTECS™ Score (green) vs. FET price. Source: Cointelegraph Markets Pro
As seen in the chart above, the VORTECS™ Score for FET hit a high of 80 on March 21, around one hour before the price increased 42.56% over the next two days.
The views and opinions expressed here are solely those of the author and do not necessarily reflect the views of Cointelegraph.com. Every investment and trading move involves risk, you should conduct your own research when making a decision.
Please be aware that some of the links on this site will direct you to the websites of third parties, some of whom are marketing affiliates and/or business partners of this site and/or its owners, operators and affiliates. We may receive financial compensation from these third parties. Notwithstanding any such relationship, no responsibility is accepted for the conduct of any third party nor the content or functionality of their websites or applications. A hyperlink to or positive reference to or review of a broker or exchange should not be understood to be an endorsement of that broker or exchange’s products or services.
Risk Warning: Investing in digital currencies, stocks, shares and other securities, commodities, currencies and other derivative investment products (e.g. contracts for difference (“CFDs”) is speculative and carries a high level of risk. Each investment is unique and involves unique risks.
CFDs and other derivatives are complex instruments and come with a high risk of losing money rapidly due to leverage. You should consider whether you understand how an investment works and whether you can afford to take the high risk of losing your money.
Cryptocurrencies can fluctuate widely in prices and are, therefore, not appropriate for all investors. Trading cryptocurrencies is not supervised by any EU regulatory framework. Past performance does not guarantee future results. Any trading history presented is less than 5 years old unless otherwise stated and may not suffice as a basis for investment decisions. Your capital is at risk.
When trading in stocks your capital is at risk.
Past performance is not an indication of future results. Trading history presented is less than 5 years old unless otherwise stated and may not suffice as a basis for investment decisions. Prices may go down as well as up, prices can fluctuate widely, you may be exposed to currency exchange rate fluctuations and you may lose all of or more than the amount you invest. Investing is not suitable for everyone; ensure that you have fully understood the risks and legalities involved. If you are unsure, seek independent financial, legal, tax and/or accounting advice. This website does not provide investment, financial, legal, tax or accounting advice. Some links are affiliate links. For more information please read our full risk warning and disclaimer.
Bitcoin (BTC) and select altcoins broke above their immediate resistance levels but are struggling to sustain the higher levels, indicating that bears are not ready to give up.
It is speculated that the spike in Bitcoin’s price on March 22 may have been caused by reports that Terra had sent 125 million USDT to Binance on March 21.
While this news could provide a short-term spike, it is unlikely to alter the main trend. Bitcoin remains strongly correlated with the S&P 500, which rallied sharply between March 15 to 22. Crypto traders are likely to take cues from the performance of the S&P 500 in the next few days.
Could bulls clear the overhead hurdle and start an up-move in Bitcoin and select altcoins? Let’s analyze the charts of the top-10 cryptocurrencies to find out.
BTC/USDT
Bitcoin broke above the immediate resistance at $42,594 on March 22 but the bulls could not sustain the higher levels. This suggests that bears continue to defend this level aggressively.
BTC/USDT daily chart. Source: TradingView
A minor positive is that the bulls did not give up much ground from the overhead resistance on March 23. This suggests that traders are not closing their position near the resistance as they anticipate the up-move to continue.
If buyers push and sustain the price above $42,594, the BTC/USDT pair could pick up momentum and rally to $45,400 where the bears may again mount a strong defense.
This positive view will invalidate if the price turns down and breaks below the moving averages. If that happens, the pair could extend its stay inside the $37,000 to $42,594 range for a few more days.
ETH/USDT
Ether (ETH) broke above the psychological level at $3,000 and reached near the resistance line of the symmetrical triangle on March 22. The long wick on the candlestick indicates that bears are defending the resistance line.
ETH/USDT daily chart. Source: TradingView
The bears will now attempt to pull the price down to the moving averages. If the price rebounds off this support, it will increase the possibility of a break above the triangle. If that happens, the ETH/USDT pair could start a new up-move. The pair could first rally to $3,500 and then march toward the pattern target at $3,907.
This bullish view will be negated in the short term if the price breaks below the moving averages. Such a move will indicate that the pair may spend some more time inside the triangle.
BNB/USDT
BNB bounced off the 20-day exponential moving average (EMA) ($389) on March 21, indicating buying on dips. The bulls pushed the price above the overhead resistance at $407 on March 22 but could not sustain the higher levels.
BNB/USDT daily chart. Source: TradingView
The 20-day EMA has started to turn up gradually and the RSI is in the positive territory, indicating advantage to buyers. The bulls will try to push and sustain the price above the $407 to $410 resistance zone. If they manage to do that, the BNB/USDT pair could attempt a rally to $445.
Conversely, if the price turns down from the current level, the pair could drop to the moving averages. This is an important support to watch out for because if the bears pull the price below the moving averages, the pair could decline toward $350.
On the other hand, if the price rebounds off the moving averages, it will suggest that bulls are accumulating at lower levels. The buyers will then again attempt to push the pair to $445.
XRP/USDT
Ripple (XRP) broke and closed above the downtrend line on March 21 but the bulls are finding it difficult to continue the up-move. This indicates that demand dries up at higher levels.
XRP/USDT daily chart. Source: TradingView
The price has turned down and the bears are attempting to pull the XRP/USDT pair below the downtrend line. If they manage to do that, the pair could drop to the moving averages.
A strong rebound off the moving averages will suggest that traders continue to buy at lower levels. The bulls will then again try to push the price toward $0.91.
On the contrary, if the price breaks below the 50-day simple moving average (SMA) ($0.76), it will suggest that the break above the downtrend line may have been a bull trap. The pair could then decline to $0.68.
LUNA/USDT
Terra’s LUNA token rose above the overhead resistance at $96 on March 21 but the bulls could not sustain the higher levels. This suggests that bears are defending this level aggressively.
LUNA/USDT daily chart. Source: TradingView
However, a positive sign is that the bulls have not given up much ground from the resistance. This indicates that traders are not closing their positions in a hurry as they anticipate a move higher.
If the price breaks and closes above $96, the LUNA/USDT pair could rally to the all-time high at $105. A break and close above this level could indicate the resumption of the uptrend.
This positive view will invalidate in the short term if the price turns down and breaks below the 20-day EMA ($88). The pair could then decline to $82 and later to $75.
ADA/USDT
Cardano (ADA) broke above the 50-day SMA ($0.94) on March 22 and reached the overhead resistance at $1. Strong buying on March 23 has pushed the price above the overhead resistance, signaling that the downtrend may be ending.
ADA/USDT daily chart. Source: TradingView
If bulls sustain the price above $1, the ADA/USDT pair could further pick up momentum. The pair could then rally to $1.26. The bears may pose a strong challenge at this level but if bulls overcome this resistance, the pair could extend its rally to $1.60.
Contrary to this assumption, if the price turns down and slides below $1, it will suggest that bears continue to sell aggressively at higher levels. The pair could then drop to the 20-day EMA ($0.89), which is an important level to keep an eye on.
A strong rebound off this level could suggest that bulls are accumulating on dips while a break below the 20-day EMA will indicate that the break above $1 may have been a bull trap.
SOL/USDT
Solana (SOL) has been sandwiched between the moving averages for the past few days. The bears are selling near the 50-day SMA ($93) while the bulls are buying at the 20-day EMA ($88).
SOL/USDT daily chart. Source: TradingView
This tight range trading is unlikely to continue for long. If bulls propel and sustain the price above the 50-day SMA, the descending triangle pattern will be invalidated. That could attract buying and the SOL/USDT pair may rally to the overhead resistance at $122.
Contrary to this assumption, if the price turns down and breaks below the 20-day EMA, the bears will try to pull the price to the strong support zone at $81 to $77. A break below this zone will complete the bearish setup, indicating the resumption of the downtrend.
Avalanche (AVAX) has been sustaining above the descending channel for the past few days but the bulls have not been able to resume the up-move by pushing the price above $93. This indicates selling at higher levels.
AVAX/USDT daily chart. Source: TradingView
If the price breaks below the moving averages, the bears could pull the AVAX/USDT pair to the uptrend line. Such a move will indicate that the break above the channel may have been a bull trap.
Conversely, if the price rebounds off the current level, it will suggest that bulls continue to buy on dips. The bulls will then again try to clear the hurdle at $93 and push the pair to the psychological level at $100. A break and close above this level could indicate the start of a new uptrend.
DOT/USDT
Polkadot (DOT) bounced off the moving averages and closed above the overhead resistance zone at $19 to $20 on March 22. This suggests that the bulls are attempting a comeback.
DOT/USDT daily chart. Source: TradingView
The DOT/USDT pair could now rally to the overhead resistance at $23 where the bears may mount a strong defense. If the price turns down from $23, the pair could drop to the moving averages and consolidate in a range for a few more days.
If bulls push and sustain the price above $23, the pair could pick up momentum and rally toward $30. Alternatively, if the price turns down and breaks below the moving averages, the pair could slide to the strong support at $16.
DOGE/USDT
Dogecoin (DOGE) has been hovering near the 20-day EMA ($0.12) for the past few days, indicating a tough tussle between the bulls and the bears.
DOGE/USDT daily chart. Source: TradingView
The flattish 20-day EMA and the RSI near the midpoint suggest a balance between supply and demand. This balance could tilt in favor of the buyers if they can push and sustain the price above the 50-day SMA ($0.13). Such a move will signal a likely change in trend and clear the path for a potential rally to $0.17.
Conversely, if the price turns down from the current level or the 50-day SMA and breaks below the March 20 intraday low, the DOGE/USDT pair could drop to the strong support at $0.10.
The views and opinions expressed here are solely those of the author and do not necessarily reflect the views of Cointelegraph. Every investment and trading move involves risk. You should conduct your own research when making a decision.
A lot of people have made millions from meme coins. These are crypto assets that have gone from zero to billions of dollars in market cap in a very short time. It’s therefore understandable if you are thinking of investing in meme coins. These coins typically have the following features:
Largely speculative assets that have very little underlying value.
Meme coins are prone to high levels of volatility.
Anyone can literally launch a meme coin from anywhere.
In case you would like to become rich from meme coins, there are a few coins that you can check out right now.
Floki Inu (FLOKI)
Floki Inu (FLOKI) is a meme coin that appears to be just boiling under the surface. It is one of those meme coins that also looks like it has a lot of potential for success.
Besides, when you look at the price action, you see a very undervalued meme coin that continues to gain a lot of coverage on social media. At the time of writing, FLOKI was trading at $0.00003295 with a market cap of $300 million.
SafeMoon (SAFEMOON)
Although it has been around for some time, SafeMoon (SAFEMOON) has not achieved the potential we believe it can. Instead, the coin has largely remained steady. But there is a chance it could blow up in the future.
Right now, SafeMoon is trading at a market cap of around $350 million. While we are not saying it could hit $20 billion like Shiba Inu and others, there is still so much room there to bring in more gains. It is definitely one to watch.
Looser coin (LOWB)
With a market cap of just $2.7 million, Loser Coin (LOWB) is a very high potential meme coin. The only way is up for this coin, and there is a huge chance that LOWB could grow 10x in the near term. It is currently trading at $0.00004425.
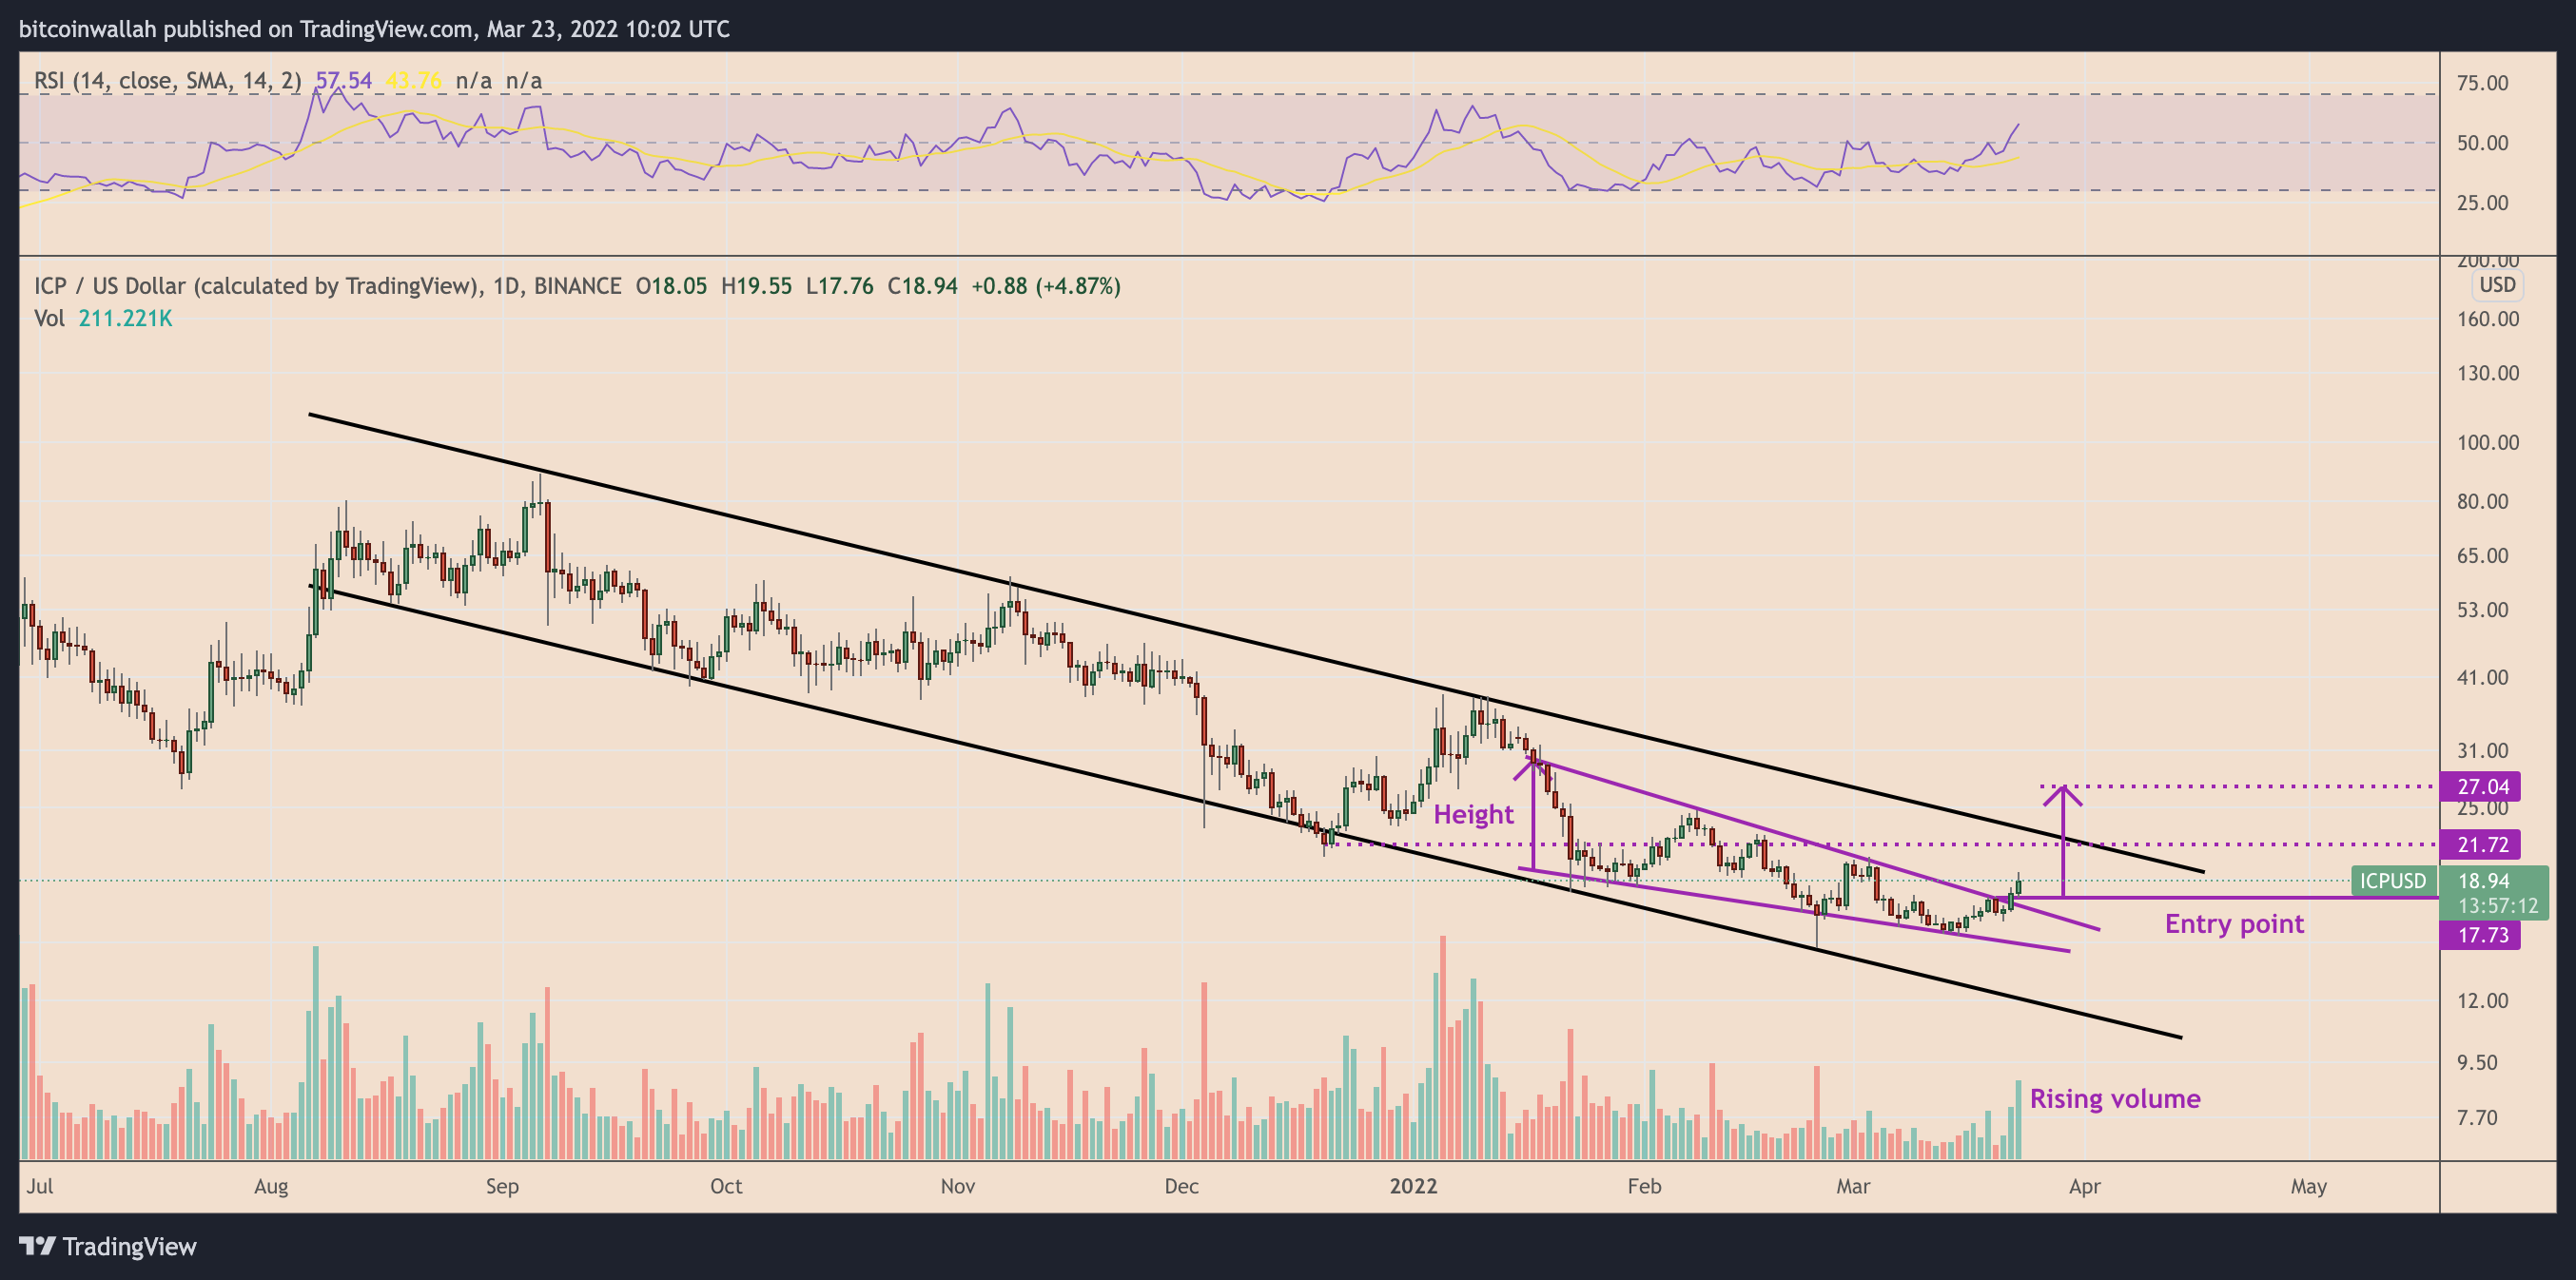
The price of Internet Computer (ICP) reversed directions after falling to its record low near $14.50 on Feb. 24 and has rebounded by more than 30% ever since. And now, it appears the 35th-largest digital asset by market capitalization has more room to grow in the coming weeks.
ICP breaks out of ‘falling wedge’
ICP’s daily chart shows a falling wedge pattern — a setup consisting of two descending, converging trendlines connecting lower highs and lower lows. The intersecting nature of the two lines indicate a weakening bearish momentum. As such, traditional analysts anticipate a breakout out of a wedge to be bullish.
For ICP/USD, the wedge hurdle was near $17.75, as shown in the chart below. It broke above it on March 22, and kept on rising in the next daily session, accompanied by an increase in trading volumes. On the whole, it shows a convincing falling wedge breakout in action.
In a “perfect” scenario, breaking out of a falling wedge pattern — to the upside — can see a subseqeunt price rally by as much as the maximum distance between the wedge’s upper and lower trendline. That may put ICP en route to over $27 — by almost 50% — sometime by April.
Nonetheless, there is also a possibility that ICP’s breakout mode exhausts midway near $20, a level that coincides with the resistance trendline of its multi-month descending channel. Still, it would leave the Internet Computer token with a potential 20% upside setup before the next pullback occurs.
Bearish risks remain for ICP price
Falling wedges are poor performers when it comes to predicting bullish chart patterns, according to Tom Bulkowski, a veteran stock market investor, who noted that they work well when predicting a “downward breakout in a bear market.”
ICP has been in a bear market since its launch in May 2021 across the crypto exchanges, with its price plunging more than 90% from its debut rate of around $240 (data from Binance). The token dropped amid allegations that its founding company, DFINITY, dumped billions of dollars worth of Internet Computer tokens while simultaneously barring its early investors from exiting their positions.
Additionally, a correction across the Bitcoin (BTC) and the rest of the cryptocurrency markets also weighed down the ICP’s bullish prospects.
Notably, the correlation between Bitcoin and Internet Computer has been mostly positive since the ICP’s trading debut on exchanges. In other words, ICP typically sees downside moves when BTC experiences a correction.
ICP/USD daily price chart. Source: TradingView
Despite logging a falling wedge breakout, ICP still eyes further bullish confirmation as it trades below its 50-day exponential moving average (50-day EMA; the red wave) near $19, a strong resistance level since September 2021.
Failure to mark a break above the 50-day EMA could have ICP retest its record low near $14, down over 20% from today’s price.
The views and opinions expressed here are solely those of the author and do not necessarily reflect the views of Cointelegraph.com. Every investment and trading move involves risk, you should conduct your own research when making a decision.
Mina has raised $92 million from investors, money that will go towards expanding its ecosystem.
Mina is looking to become a leader in the Zero-Knowledge smart contracts space.
Mina is currently on an uptrend as investors bet on higher prices after the current funding round.
Mina MINA/USD is one of the most promising projects at the moment. It is one of the cryptocurrencies that are working towards privacy-focused smart contracts. This is a big deal because as Web 3.0 comes alive, privacy will become one of the most important things that people will focus on. It’s only logical considering that part of the biggest issues with Web 2.0 is the centralization of power in the hands of a few big corporations and the commercialization of personal data.
Besides taking on one of the biggest aspects of the crypto market, Mina now has the resources to move ahead with its plans. On March 17th, Mina announced that it had raised $92 million in a round of funding led by crypto heavyweights such as FTX Ventures, Three Arrows, and other investors.
Mina intends to use this money to actualize its goal of becoming the number one blockchain in developing Zero-Knowledge Smart Contracts.
This move seems to have excited investors, which is reflected in its price action. Mina has been up by 36% in the past week, making it one of the best performers in the week. Mina continues gaining upside momentum, an indicator that investors expect it to hit even higher prices in the short to medium term.
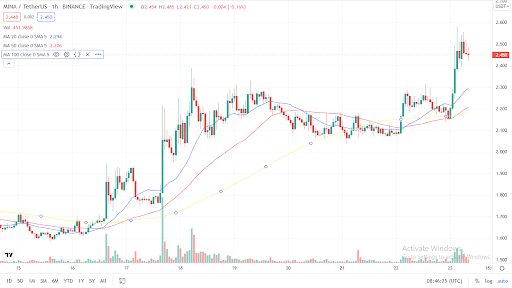
Moving averages point to more gains
Source: TradingView
In the past 24-hours, Mina has been trending up. In this period, the 20-day MA has been outpacing the 50, and 100-day moving averages. This is an indicator that the price is rising at an accelerated pace. If buying volumes increase in the entire crypto market, MINA could easily test prices above $3 in the short term.
Summary
Mina is gaining upside momentum at the moment. The moving averages are all turning bullish, indicating that MINA could test higher prices in the short term. This price action has been triggered by news that MINA had raised $92 million from investors, which will use to grow its ecosystem.
The global supply chain continues to struggle to get back on track following a tumultuous three years that have witnessed clogged shipping ports and a breakdown of the just-in-time delivery system.
One blockchain project looking to help solve some of these issues while also facilitating the transition to Web3 is OriginTrail (TRAC), a logistics and supply chain management-focused blockchain protocol aiming to become the world’s first decentralized knowledge graph (DKG).
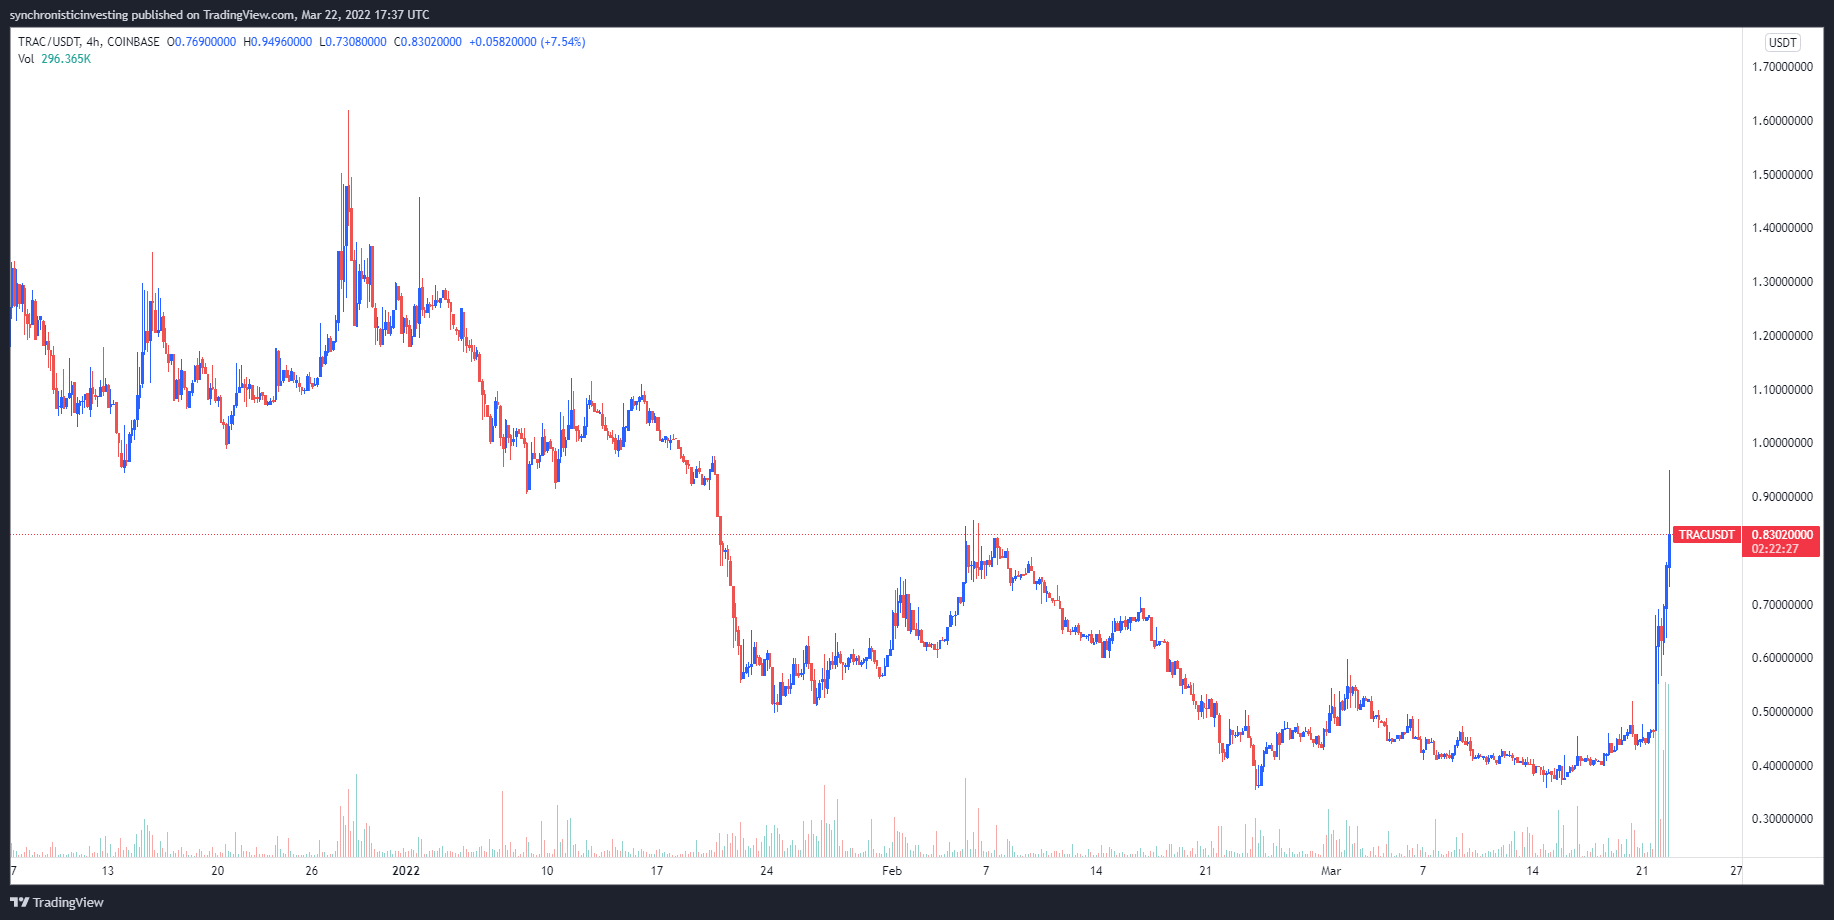
Data from Cointelegraph Markets Pro and TradingView shows that the price of TRAC has increased 162% in the past week, going from a low of $0.36 on March 15 to a daily high of $0.95 on March 22 amid a 1,070% increase in trading volume over the past 24 hours.
TRAC/USDT 4-hour chart. Source: TradingView
There are three underlying reasons behind the sudden spike in TRAC’s price and trading volume: the ongoing rollout of OriginTrail v6, the launch of AidTrust and the migration to Web3.
OriginTrail v6
The most significant development helping to boost the outlook for TRAC is the ongoing rollout of OriginTrail v6, which is currently running on the testnet.
The @origin_trail v6 testnet is growing into a beast! This week we reached a new record of 156k publishings measured in 24h, which is ~500x improvement over the highest seen number on previous DKG versions. And we are only getting started 1/4 https://t.co/2ZVXuFwSNU
— Brana Rakic – OriginTrail (@BranaRakic) March 18, 2022
According to the team at OriginTrail, v6 is part of the next evolution of the DKG that will help improve the performance of the network by several orders of magnitude. It will also introduce new capabilities like Universal Asset Locators and driving interoperability with legacy knowledge graphs such as the Google Knowledge Graph.
Users who are interested in contributing to the community now have the opportunity to set up a v6 node to earn TRAC while also helping support the overall functioning of the OriginTrail network.
Launch of AidTrust
A second element bringing attention to OriginTrail has been the launch of AidTrust, a joint product released in conjunction with BSI UK to bring visibility and trust to pharmaceutical supply chains.
AidTrust, a joint @TraceLabsHQ & @BSI_UK product that uses @origin_trail DKG to provide visibility & trust in pharmaceutical supply chains is currently being rolled out to 80+ treatment centers across India .
AidTrust combines the capabilities of the DKG with BSI’s extensive supply chain experience to help ensure that donated medicine reaches the intended patients in a timely manner.
Using AidTrust, NGOs and pharmaceutical manufacturers are able to monitor the movement of donated products through the supply chain, identify any potential risks and make real-time decisions based on secure data.
AidTrust is currently in the process of being implemented in over 80 treatment centers in India and there are plans to roll out the platform to more than 40 additional countries worldwide.
The ongoing rise and transition to Web3 is a third factor providing some lift for TRAC as its Decentralized Knowledge Graph can help monitor, organize and verify both physical and digital assets and make them discoverable on the blockchain.
As blockchain technology is slowly integrated into the underlying infrastructure of the internet, projects like OriginTrail that help with data tracking will be an important piece of the overall architecture as data is the commodity that powers the digital world.
OriginTrail is also in the process of integrating with the Polkadot ecosystem through the creation of an OriginTrail parachain that will give oracle functionalities to any Polkadot parachain interested in DKG integration.
The views and opinions expressed here are solely those of the author and do not necessarily reflect the views of Cointelegraph.com. Every investment and trading move involves risk, you should conduct your own research when making a decision.
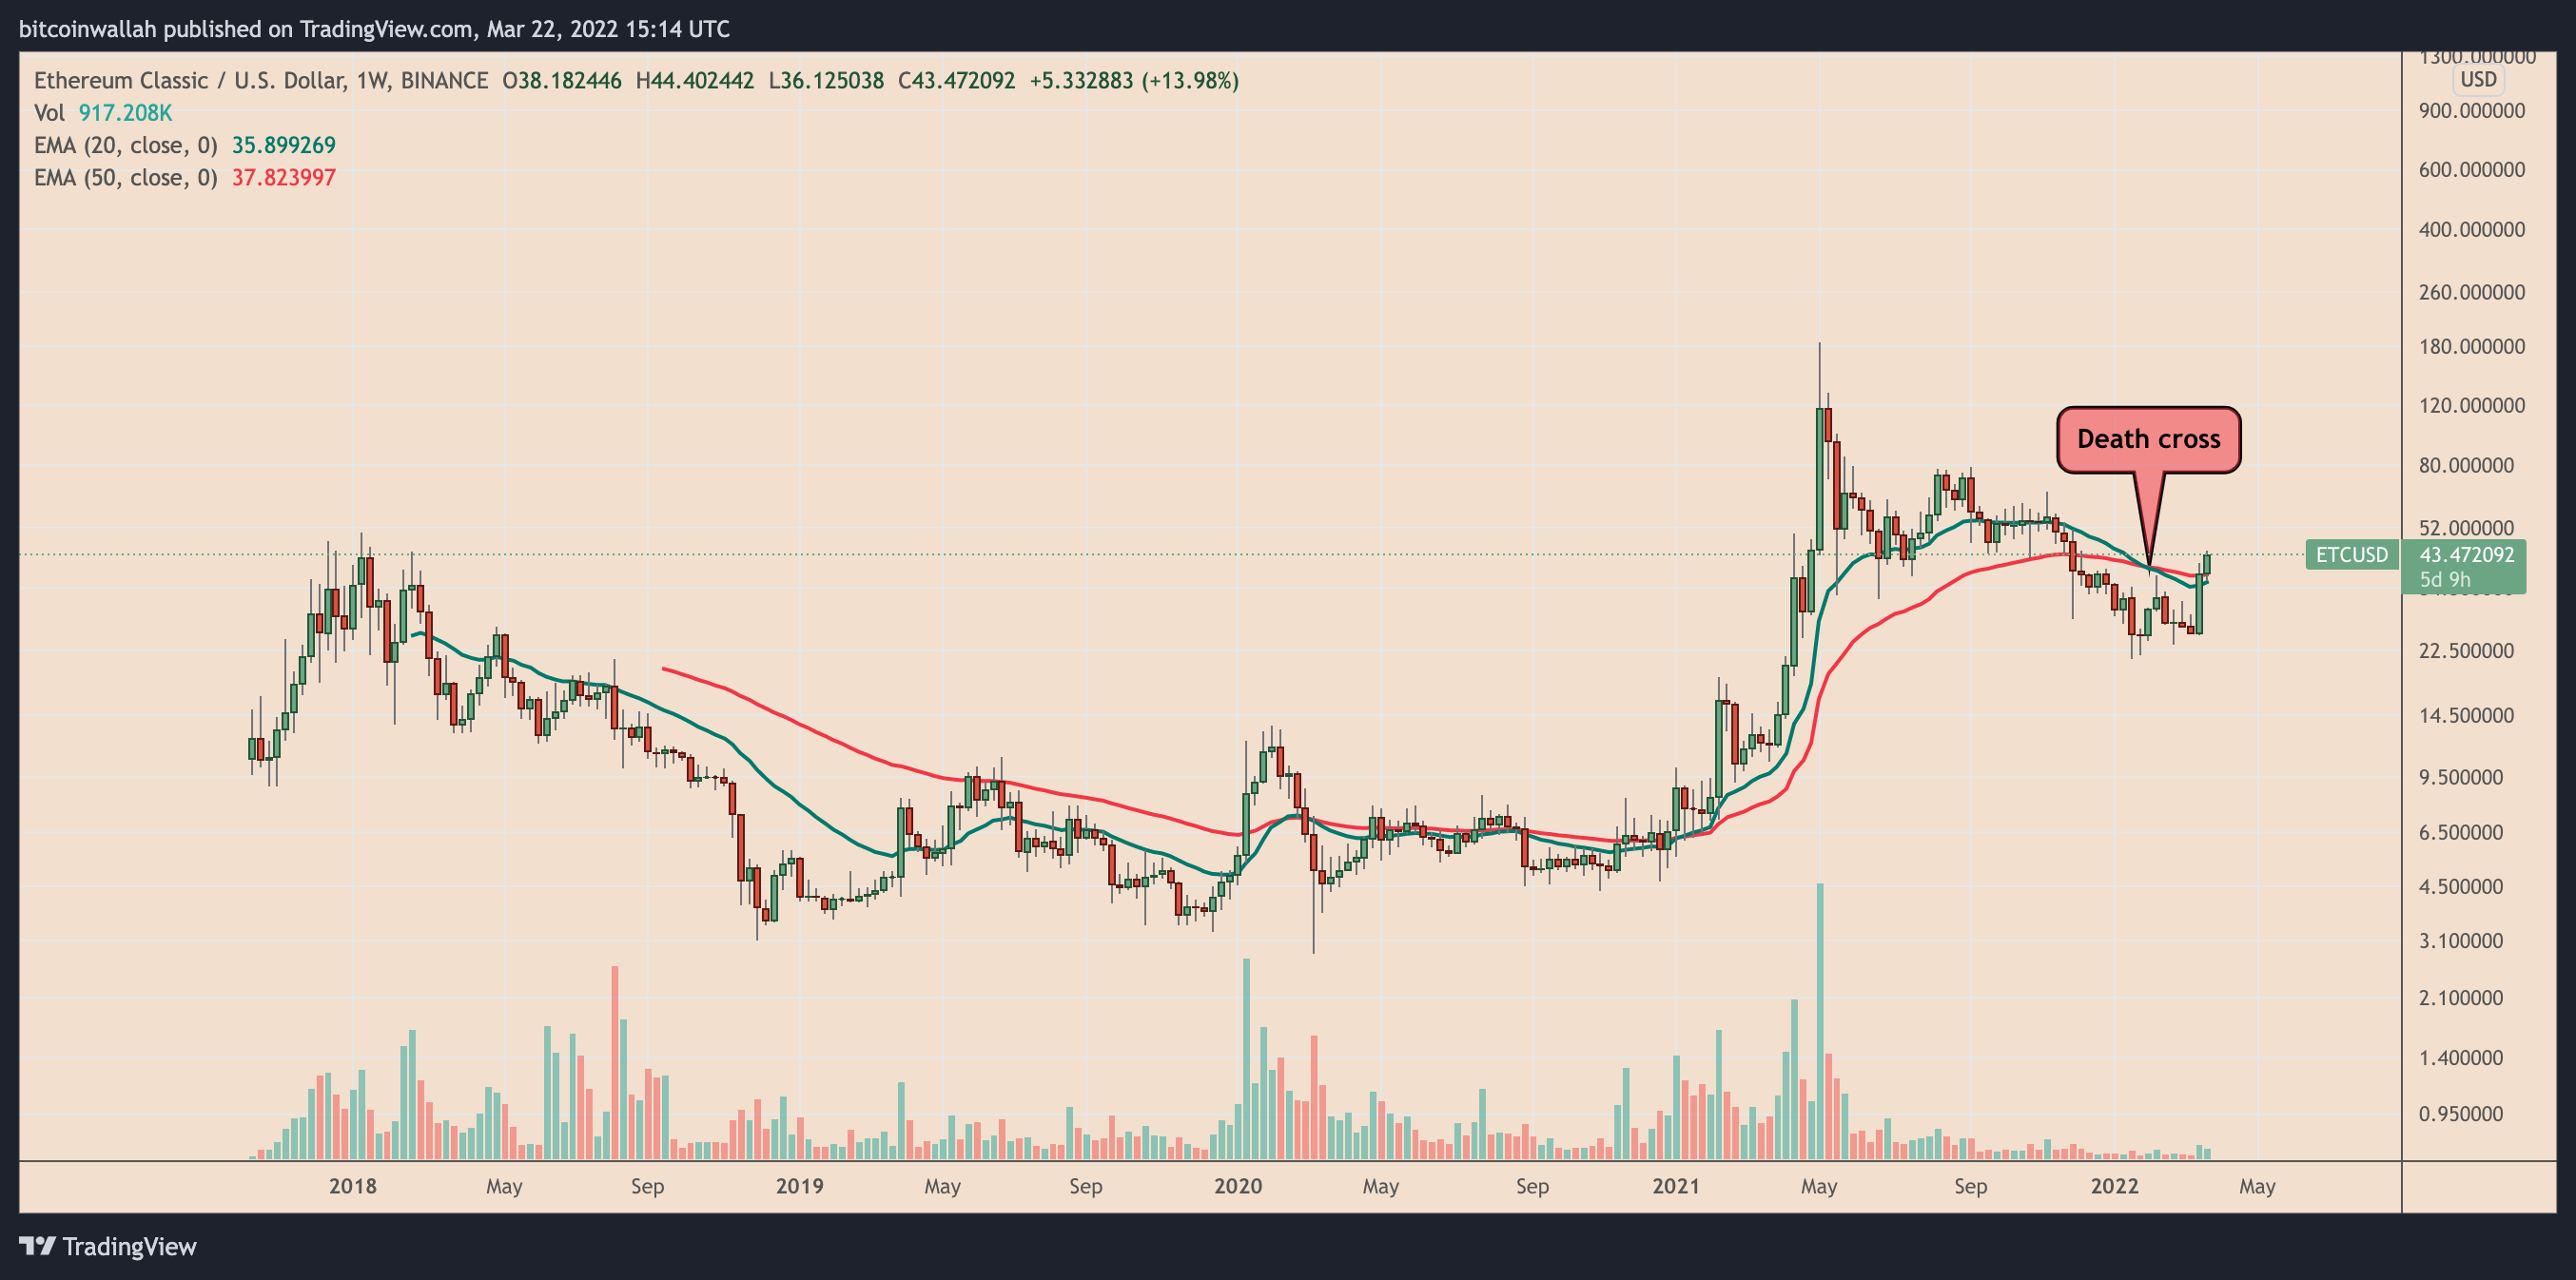
Ethereum Classic (ETC) price climbed on March 22, ignoring a deadly “death cross” on the weekly chart, as traders raised their bets on its potential to become a haven for miners fleeing the rival Ethereum blockchain.
ETC’s price jumped over 15.5% to reach $44 a token for the first time since Dec. 9, 2021. The coin’s intraday gains came as a part of a broader rebound move that saw its price rallying more than 75% eight days after bottoming out near $25.
ETC/USD daily price chart. Source: TradingView
Most of ETC’s course to the upside saw it tracking general crypto market trends. For instance, the Ethereum Classic token showed an extremely higher correlation with Bitcoin (BTC), the leading cryptocurrency by market cap, reaching 0.98 on multiple occasions.
A correlation coefficient reading of 1 between the two assets show that they move completely in lockstep.
ETC/USD versus BTC/USD correlation coefficient. Source: TradingView
But ETC’s 75%-plus gains in the last eight days largely outperformed BTC’s 15.5% returns in the same period. That may have to do with speculations about Ethereum Classic’s ability to attract miners from its rival, Ethereum.
In December 2020, Cardano founder Charles Hoskinson announced that his firm, IOHK, initiated the Mantis project to upgrade Ethereum Classic and support its community.
Last year, the cooperative noted that “Ethereum’s move to proof-of-stake and sharding may disrupt many in the community who prefer proof-of-work and a strong base-layer approach to blockchain security,” adding:
“This is where #EthereumClassic becomes a viable alternative for #Ethereum projects to migrate to.”
As ETC rallies in March, the hash rate has not risen to new all-time highs, suggesting that miners aren’t jumping over just yet. Nevertheless, social media has started to take up the miner exodus mantra, as shown in the tweets below.
ETC is rising because its tech. indicators turned bullish on 3/18. Also, $ETH will go #PoS in few months, hence #ETC stands to benefit from increased hashrate and security, as miners look for alternatives.
ETC’s price also surged in the run-up to its third block reward reduction, or “fifthening,” expected to arrive on April 15, 2022 at block 15,000,000.
In detail, the Ethereum Classic’s block rewards get cut periodically by 20% every five million blocks (roughly every 2.5 years), following the improvement proposal ECP-1017, launched in 2017.
The last of such events occurred on March 16, 2020, which followed up with ETC rising by more than 350% to date.
Technically, ETC appears oversold due to its daily relative strength index rising above 70, a sell signal. The ETC/USD pair now tests $44 as its interim resistance, a level with a history of acting as a strong support between July 2021 and December 2021.
ETC/USD daily price chart. Source: TradingView
As a result, ETC may correct towards its 200-day exponential moving average (200-day EMA) near $37 next. Conversely, a decisive move above $44 could have it eye $50 — a psychological resistance level — as its interim upside target.
The views and opinions expressed here are solely those of the author and do not necessarily reflect the views of Cointelegraph.com. Every investment and trading move involves risk, you should conduct your own research when making a decision.