In a move that may suggest growing institutional interest in cryptocurrencies and nonfungible tokens (NFTs), Nomura Holdings has announced it is establishing a new digital assets team to look into possible opportunities in the asset class.
The company, which deals in retail, wholesale and investment businesses, has said that it was restructuring its Future Innovation Company into a brand new Digital Company, which will begin operations in April. The main objective of the new company will be to increase clients’ use of digital assets and provide related services. Nomura Group president and CEO Kentaro Okuda said:
“The new Digital Company will lead deeper collaboration among internal and external stakeholders, accelerate our uptake of digital technologies, and enhance our client services.”
The corporate giant, which has about 120 trillion yen ($1 trillion) in assets under management, stated that it aims to increase digital adoption across all of its operations. The new division will reportedly explore opportunities in cryptocurrencies and NFTs, among other digital assets.
Source: stevepb, Pixabay
NFTs are becoming increasingly popular in Japan, despite having some of the most stringent crypto rules. The Japanese financial services conglomerate Nomura Holdings is the latest major player in the country to look at NFTs. Last week, major Japanese e-commerce firm Rakuten announced the launch of its own NFT trading platform, dubbed Rakuten NFT.
Last month, Japan’s largest financial conglomerate, Mitsubishi UFJ Financial Group (MUFG), announced it would terminate its three-year-old blockchain payment project to focus on stablecoins.
The speculation regarding the U.S. Federal Reserve’s tightening cycle and recent geopolitical developments may have resulted in panic selling by short-term traders. Analysis from Glassnode suggested that traders who had purchased Bitcoin (BTC) near the November 2021 high liquidated their positions in the past two and half months. This supply was absorbed by high conviction investors, which resulted in a redistribution from weak hands to strong hands.
The crypto market, due to its resilience, continues to attract erstwhile naysayers to its fold. The latest popular figure to have a change of heart is Ken Griffin, founder of American multinational hedge fund and financial services company Citadel. In an interview with Bloomberg, Griffin said that Citadel will “engage in making markets in cryptocurrencies” over the next few months.
Voyager Digital co-founder and CEO Stephen Ehrlich told Cointelegraph that the firm’s recent quarter was its “best ever, so I certainly feel it’s a great time to be in crypto.” Along with businesses, Ehrlich believes that crypto investors are likely to be rewarded in the long term.
Will the demand remain intact at higher levels and could the recovery extend further in the next few days? Let’s analyze the charts of the top-10 cryptocurrencies to find out.
BTC/USDT
Bitcoin’s recovery has reached the overhead resistance zone between $45,821 and the resistance line of the ascending channel. The bears are expected to defend the zone with vigor.
BTC/USDT daily chart. Source: TradingView
The 20-day exponential moving average ($40,797) (EMA) has started to turn up and the relative strength index (RSI) is in the positive territory, indicating an advantage to buyers. If the bulls arrest the next dip at the 20-day EMA, it will increase the possibility of a break above the channel. If that happens, the BTC/USDT pair could rally to $52,088.
Contrary to this assumption, if the price turns down and breaks below the moving averages, it will suggest that the pair could remain stuck inside the channel for a few more days. The pair may then drop toward the support line of the channel.
ETH/USDT
Ether (ETH) broke and closed above the 50-day simple moving average (SMA) ($2,860) on Feb. 28, indicating that bulls are attempting a comeback. The moving averages are close to completing a bullish crossover and the RSI is in the positive territory, indicating that the path of least resistance is to the upside.
ETH/USDT daily chart. Source: TradingView
If the price rebounds off the 20-day EMA ($2,824), it will suggest that the bulls are buying on every minor dip. The ETH/USDT pair could then rise to the resistance line of the symmetrical triangle pattern. The bears are likely to defend this level aggressively but if bulls surpass this barrier, the pair could start a new uptrend.
Alternatively, if the price slips below the 20-day EMA, the pair could drop to the support line of the triangle. A break and close below the triangle could suggest the resumption of the downtrend. The price action inside the triangle is likely to remain volatile.
BNB/USDT
BNB broke above the 50-day SMA ($406) on March 1 but the long wick on the candlestick indicates selling at higher levels. The bulls again pushed the price above the 50-day SMA on March 2 but are struggling to sustain the higher levels.
BNB/USDT daily chart. Source: TradingView
This indicates that the bears are trying to defend the 50-day SMA. If the price turns down from the current level but does not break below the 20-day EMA ($391), it will suggest that bulls are buying on dips.
That will improve the prospects of a break and close above the 50-day SMA. If that happens, the BNB/USDT pair could rally to the overhead resistance at $445. This positive view will invalidate in the short term if the price breaks and sustains below the 20-day EMA.
XRP/USDT
Ripple (XRP) rose to the downtrend line on Feb. 28 where the bears are mounting a strong defense. The price has turned down from the downtrend line and could now drop to the 50-day SMA ($0.72).
XRP/USDT daily chart. Source: TradingView
The flattish moving averages and the RSI near the midpoint suggest a balance between supply and demand. This balance will shift in favor of the buyers if the XRP/USDT pair rises and sustains above the downtrend line. The pair could then rally to $0.85 and later to $0.91.
Conversely, if the price slips below the 50-day SMA, it will suggest that higher levels continue to witness strong selling. The pair could then drop to $0.68 and if this level also cracks, the next stop may be the Feb. 24 intraday low at $0.62.
LUNA/USDT
The bulls have been trying to sustain Terra’s LUNA token above the overhead resistance at $94 for the past two days but the bears have not allowed that to happen.
LUNA/USDT daily chart. Source: TradingView
The moving averages have completed a bullish crossover, indicating advantage to buyers. However, the RSI in the overbought territory suggests that the rally may be extended in the short term. The failure to push and sustain the price above $94 could attract profit-booking from short-term traders.
That could pull the price toward $80. If the price rebounds off this level, it will suggest that sentiment remains positive and traders are buying on dips. The bulls will then again attempt to clear the overhead hurdle at $94. If they succeed, the LUNA/USDT pair could retest the all-time high at $103.
Alternatively, a break and close below $80 could suggest a deeper correction to the 20-day EMA ($68).
SOL/USDT
Solana (SOL) broke above the 20-day EMA ($95) on Feb. 28 and successfully held the retest on March 1. The bulls are striving to push the price above the 50-day SMA ($106). If they succeed, the rally could extend to $122.
SOL/USDT daily chart. Source: TradingView
The 20-day EMA has flattened out and the RSI has risen into the positive zone, indicating that bulls are on a comeback. If bulls push and sustain the price above $122, the SOL/USDT pair will complete a double bottom pattern. The pair could then rally to $163.
This bullish view will invalidate in the short term if the price turns down and breaks below the 20-day EMA. Such a move will suggest that demand dries up at higher levels. That could keep the pair range-bound between $81 and $122 for a few days.
ADA/USDT
Cardano (ADA) has reached the breakdown level at $1. This is an important level for the bears to defend because a break and close above it will suggest that the markets have rejected the lower levels.
ADA/USDT daily chart. Source: TradingView
The flattish moving averages and the RSI just below the midpoint suggest that the bears may be losing their grip. If bulls push and sustain the price above $1, the ADA/USDT pair could rally to the resistance line of the channel.
A break and close above the channel will suggest a possible change in trend. The pair could then rise to the overhead resistance at $1.60. This bullish view will invalidate if the price turns down sharply from the current level. In that case, the pair may retest the support at $0.82.
Avalanche (AVAX) broke above the moving averages on Feb. 28 and reached the downtrend line of the descending channel on March 1. The bears are attempting to defend this level as they have done on three previous occasions.
AVAX/USDT daily chart. Source: TradingView
If the price dips from the current level but does not break below the moving averages, it will suggest that the sentiment may have changed from sell on rallies to buy on dips.
The bulls will then make one more attempt to push and sustain the price above the channel. If they succeed, it will signal a possible change in trend. The AVAX/USDT pair could then rally to $100.
On the contrary, if the price breaks and slips below the moving averages, it will suggest that bears continue to sell aggressively. The pair could then drop to $64.
DOT/USDT
Polkadot (DOT) broke and closed above the 20-day EMA ($18) on Feb. 28 but the bulls have not been able to clear the overhead hurdle at the 50-day SMA ($20). This indicates that bears continue to sell at higher levels.
DOT/USDT daily chart. Source: TradingView
The 20-day EMA has flattened out and the RSI is just above the midpoint, indicating a possible range-bound action in the near term. If buyers push the price above the 50-day SMA, the DOT/USDT pair could rally to $23.
Contrary to this assumption, if the price turns down from the current level and breaks below the 20-day EMA, the pair could retest the strong support zone at $16 to $14. The bears will have to pull the price below this zone to resume the downtrend.
DOGE/USDT
Dogecoin (DOGE) sharply rebounded off the $0.12 support on Feb. 28, indicating that the bulls are aggressively defending the level.
DOGE/USDT daily chart. Source: TradingView
The relief rally is facing resistance at the 20-day EMA ($0.13), suggesting that the bears have not yet given up and they continue to sell on rallies.
If the price turns down from the moving averages, the DOGE/USDT pair could drop to $0.12. This is an important level for the bulls to defend because a break below it could pull the pair to the psychological support at $0.10.
Conversely, if the price breaks above the moving averages, the pair could rally to the overhead resistance at $0.17. The bullish momentum could pick up above this level.
The views and opinions expressed here are solely those of the author and do not necessarily reflect the views of Cointelegraph. Every investment and trading move involves risk. You should conduct your own research when making a decision.
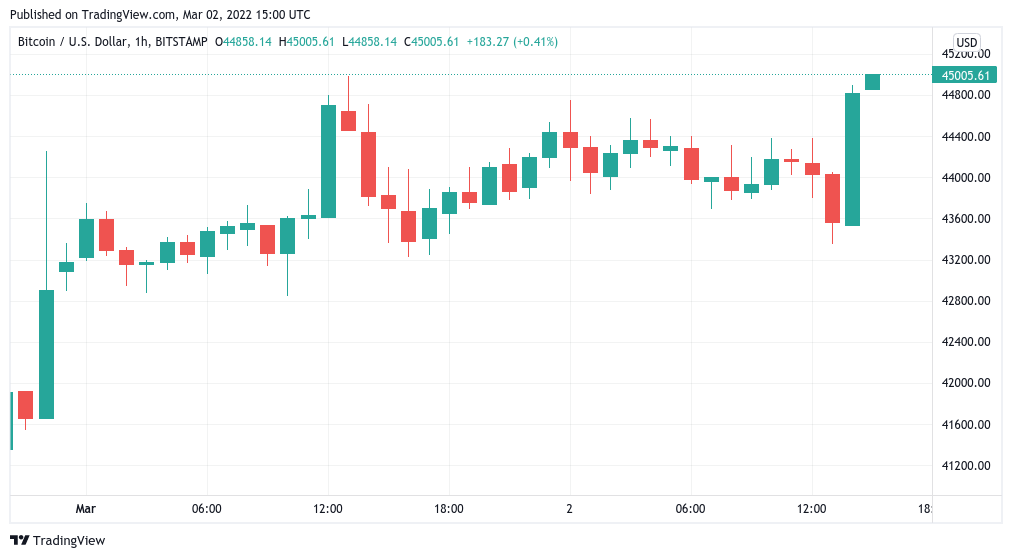
A recovery ensued as trading began, however, with the pair already back above $45,000 at the time of writing.
The volatility followed the release of a new statement from Fed Chair Jerome Powell, who for the first time gave concrete notice of a key rate hike coming this month.
“Our monetary policy has been adapting to the evolving economic environment, and it will continue to do so,” he commented.
“We have phased out our net asset purchases. With inflation well above 2% and a strong labor market, we expect it will be appropriate to raise the target range for the federal funds rate at our meeting later this month.”
Long priced in by the markets, questions nonetheless remained as to the extent of the hike, and how many could follow in 2022. The Russia-Ukraine conflict, Powell added, threatened “highly uncertain” consequences for the U.S. economy.
Bitcoin nonetheless shook off any nervousness over the news, climbing to near local highs just under $45,000.
For trader and analyst Rekt Capital, there was cause for optimism, as in terms of order books, BTC/USD was now in something of a “gap” which could trigger a run towards $48,000 — the next area of sell-side resistance.
Of interest, too, was whether the 50-day exponential moving average (EMA) could be flipped to support.
#BTC continues to hover below the blue 50-week EMA
Breaks beyond this EMA have preceded immense upside
“A scenario could be that we’re going upwards again on Bitcoin to trap the shorts, take the liquidity and go back down towards $42 thousand,” Cointelegraph contributor Michaël van de Poppe continued in a separate forecast on the day.
“Next to that, we also have a massive resistance at the $46,000 region which I doubt we’ll break in one go.”
LUNA gains signal return to $100 all-time highs
Elsewhere, altcoins were stable, with Ether (ETH) looking to retake the $3,000 mark once again.
Terra (LUNA) was the standout in the top ten cryptocurrencies by market cap, continuing a winning streak set to see it reach $100 after its initial rejection at the start of the year.
“The total value locked in the entire crypto ecosystem is actually doing really well,” Van de Poppe added.
“It only lost approx. 10%–15% in $USD value in the past months, while the entire market has been dropping down heavily. The next wave of the bull phase will probably be led by DeFi.”
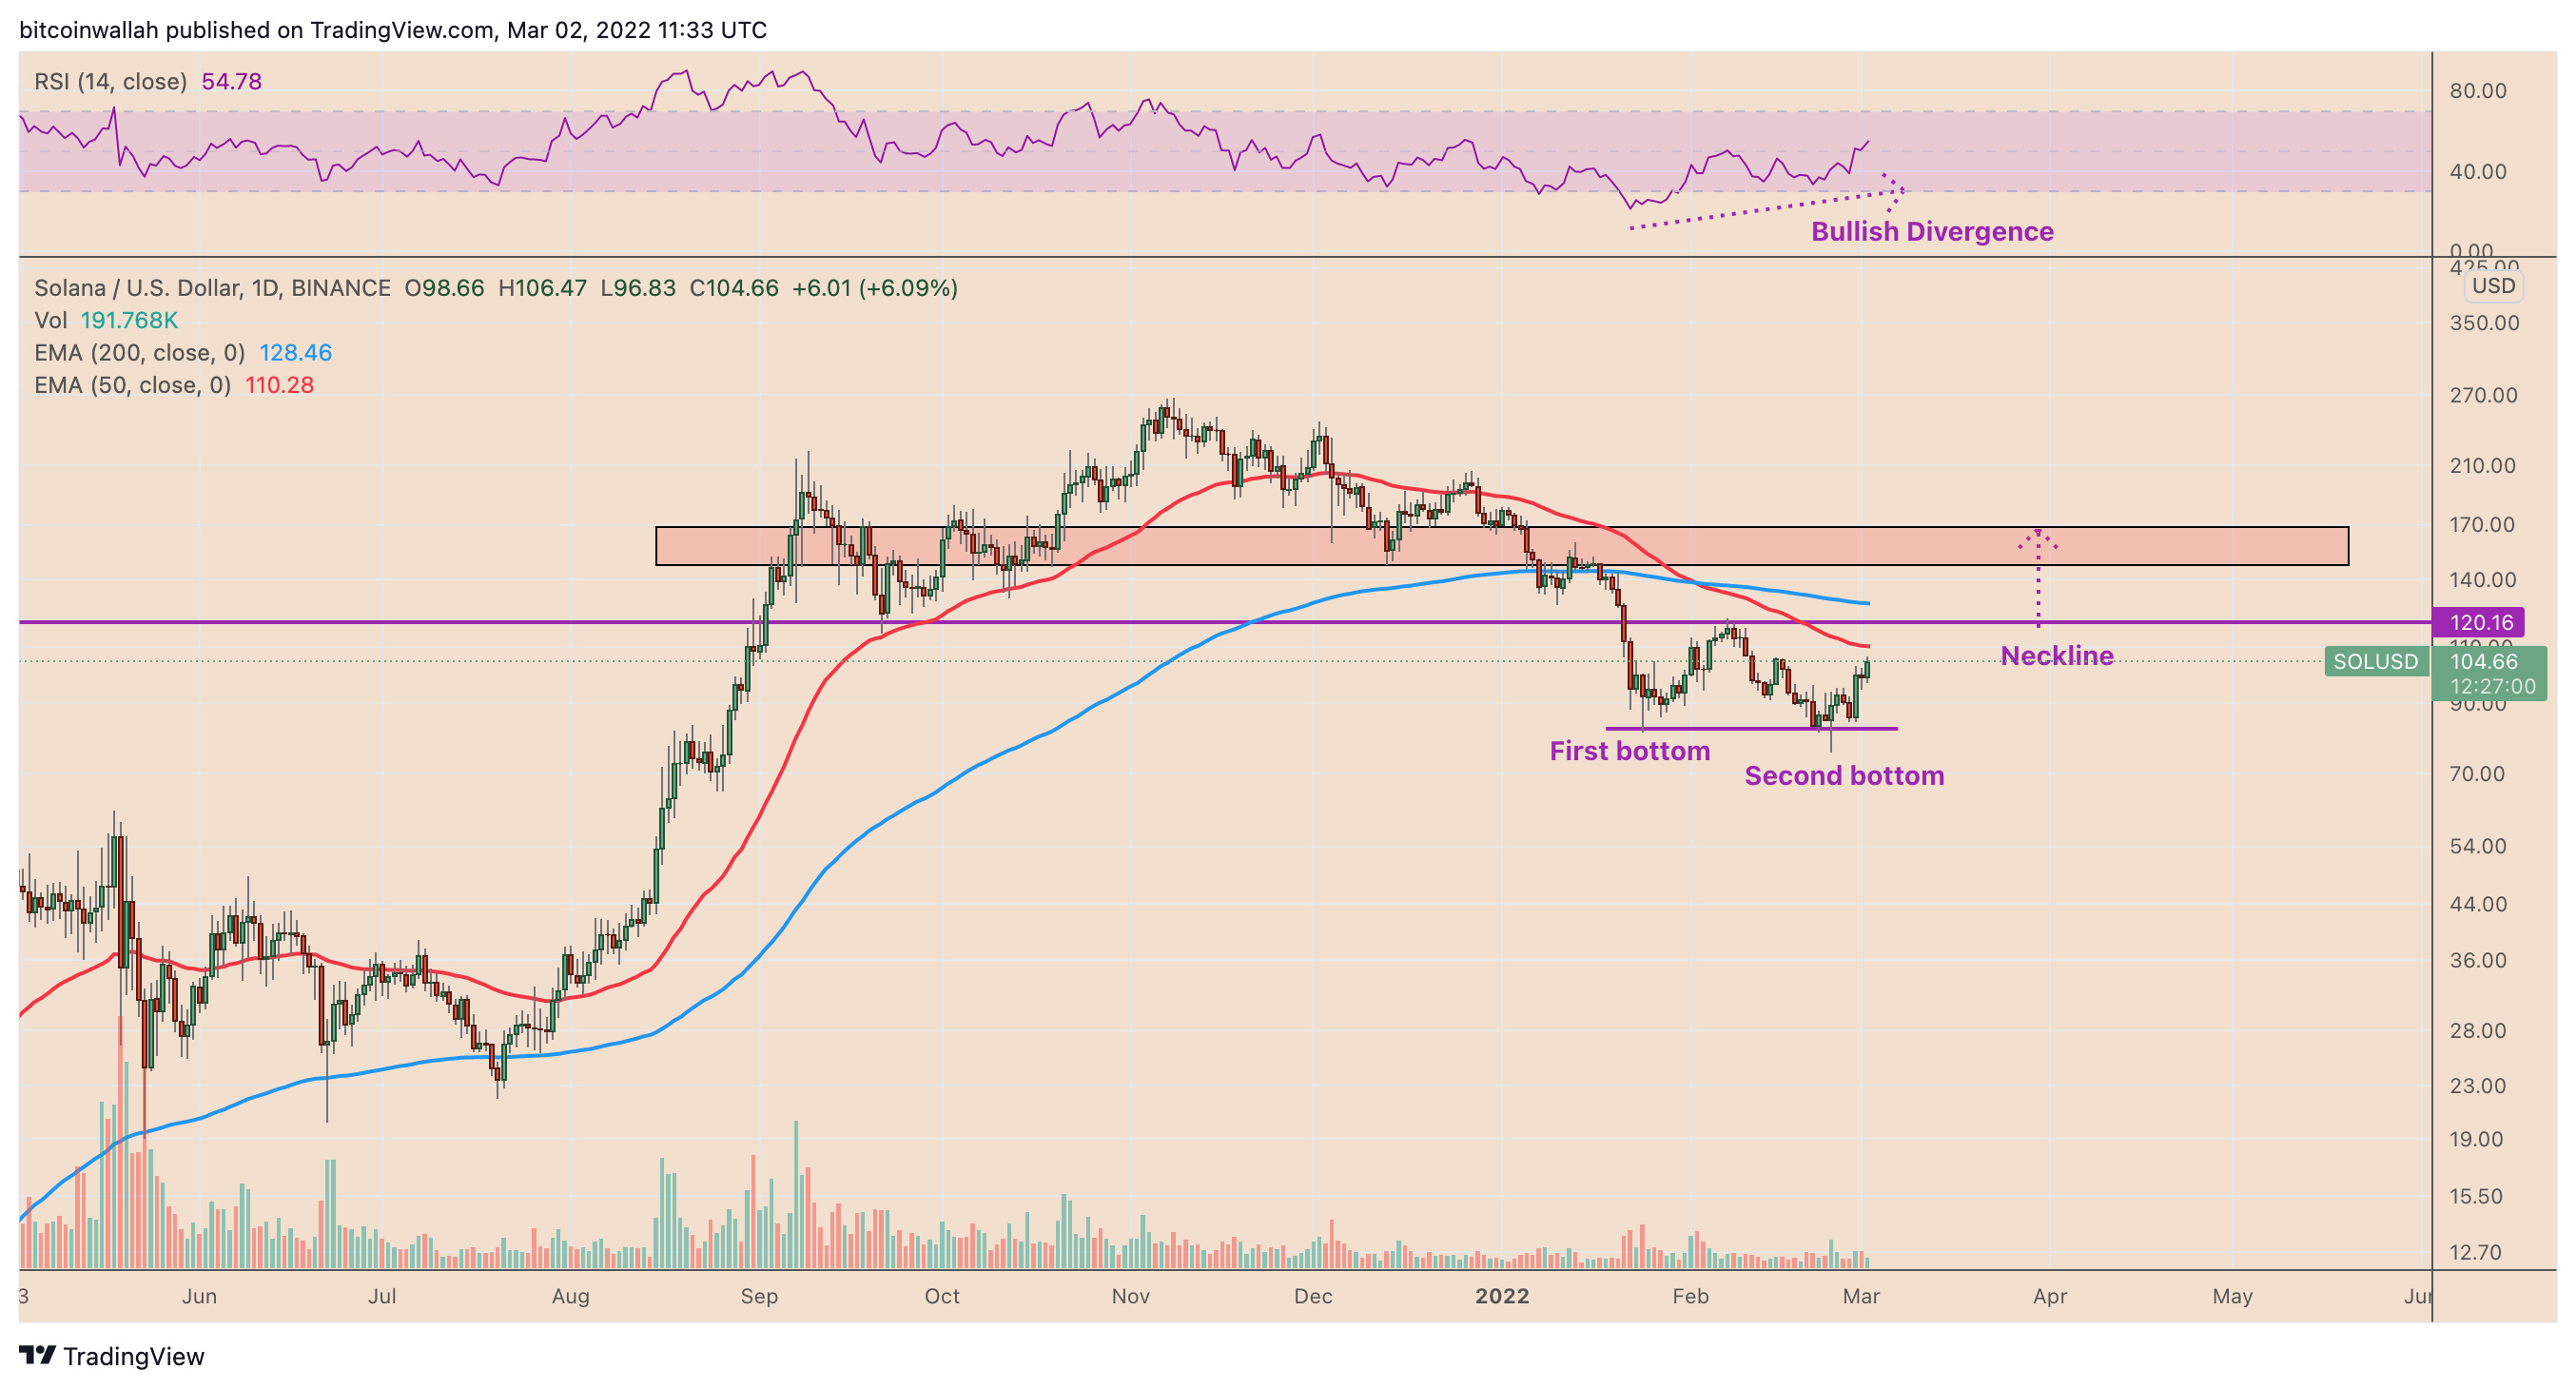
The price of Solana (SOL) may rise by over 45% in the coming weeks as the cryptocurrency intends to complete a double-bottom chart pattern against the United States dollar.
A $150 SOL ahead?
Double-bottoms typically appear at the end of a downtrend when the price falls to a low, rebounds, and returns to the level near the previous low. With bears unable to push the price to a newer low, the selling sentiment becomes exhausted, leading to a sharp upside retracement and a breakout move afterward.
SOL has been somewhat painting a similar pattern since Jan. 24, especially after extending its rebound move by rising 25% week-to-date to reach above $100.
Additionally, a visible bullish divergence between SOL’s price and relative strength index trends indicates a high probability of a double-bottom breakout.
Nonetheless, a bullish confirmation might come if SOL’s price breaks above the double-bottom neckline near $120 with a rise in trading volume. As it happens, SOL’s upside target could be at length equal to the maximum distance between the double-bottom pattern’s lowest point and its neckline.
That would put SOL en route to at least $150, with a possibility of continuing the bullish move toward $170, marked in red in the chart above.
Bull-trap risks
As double-bottom envisioned SOL at $150 or above, popular market analyst Capo warned about a potential bull trap in the Solana market, noting that altcoins, on the whole, would resume their downtrends.
The pseudonymous analyst presented $120, the double-bottom neckline, as a solid resistance level that would most likely limit SOL’s ongoing upside retracement. He also applied the popular Elliott Wave Theory to hint about the beginning of Solana’s next bearish wave cycle, as tagged with “c” in the chart below.
“It’s impossible to me to be bullish here, after the break of all the bullish MS + correctives moves to the upside,” Capo said on March 1, adding:
“You can enjoy the LTF pumps while they last, but don’t get too comfy.”
The bearish outlook lined up with a CoinShares report published last week showed most altcoin-based investment vehicles witnessing negative investor sentiment, including BNB, Polkadot (DOT), Cardano (ADA), XRP and Litecoin (LTC).
Flow by asset in the week ending Feb. 25. Source: Bloomberg/CoinShares
Solana also suffered as the week ending Feb. 25 saw SOL investment products losing $2.6 million in capital outflows.
In contrast, all the digital asset investment products combined attracted $36 million in the same period, with multi-asset portfolios injecting the highest capital — of $14 million, followed by Bitcoin’s (BTC) 17.3 million.
The views and opinions expressed here are solely those of the author and do not necessarily reflect the views of Cointelegraph.com. Every investment and trading move involves risk, you should conduct your own research when making a decision.
2021 was a roller coaster of a year for THORChain (RUNE), which saw its price top out at $20.31 only to come crashing down below $4 as a series of hacks and declining interest in decentralized finance had the token limping into 2022.
Data suggests that investors could be taking a closer look at Rune and a few potentially bullish factors could include the protocol’s recent integration with the Terra and Cosmos ecosystem, an upcoming mainnet launch and the attractive yields offered to liquidity providers.
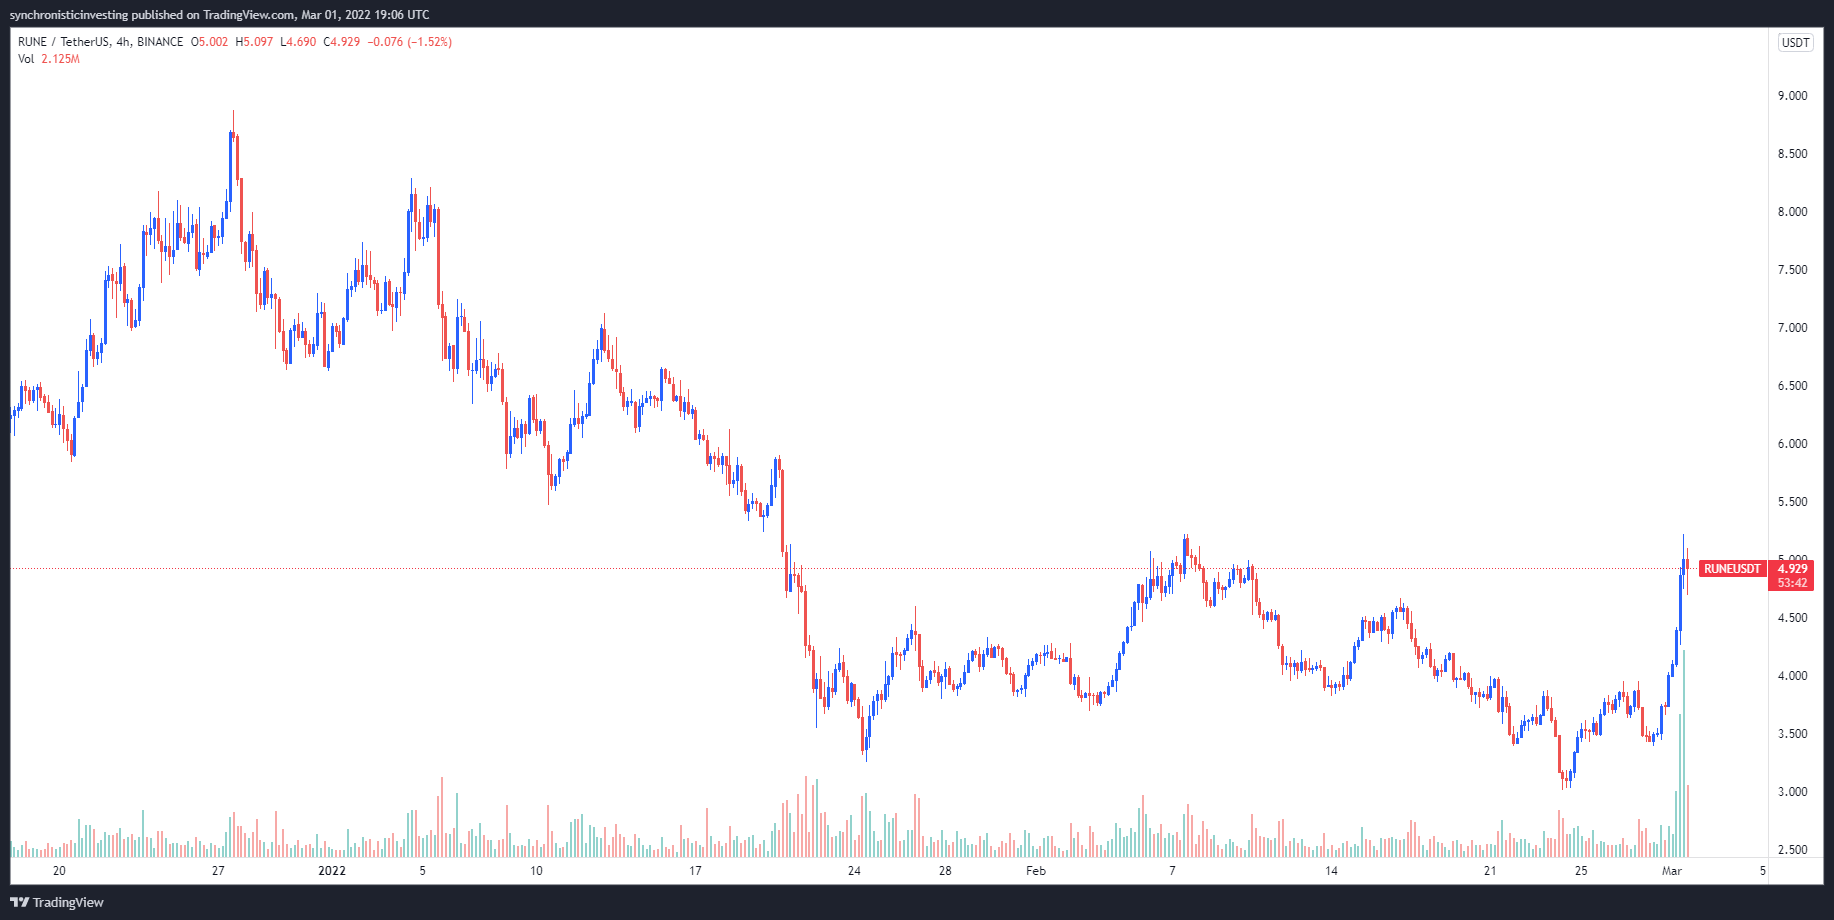
RUNE/USDT 4-hour chart. Source: TradingView
Data from Cointelegraph Markets Pro and TradingView shows that after hitting a low of $3.00 on Feb. 24, the price of RUNE has rallied 74.2% to a daily high at $5.23 on March 1 amid a 388% surge in its 24-hour trading volume.
Rune integrates with Terra
One development that has excited the RUNE community is the integration of Terra (LUNA) into the THORChain protocol. This integration also enables the platform to support all Cosmos-based projects.
To clear up any uncertainty: The Terra integration is complete.
We’re now working with @TerraSCV to review the integration before pushing things.
Terra integration brings LUNA token, along with the TerraUSD (UST) stablecoin to the THORChain ecosystem and gives users more trading and staking options.
THORChain now supports six wallet types and eight blockchains on its THORSwap cross-chain decentralized exchange. THORChain is also in the process of adding support for Haven and Monero.
Wallets and blockchains supported by THORSwap. Source: Twitter
As part of the rollout for Terra and the Cosmos SDK, THORChain will be updated via a hard fork, which will be fully tested in the testnet and followed by further testing in Stagenet after the Terra launch and on ChaosNet before the mainnet launch.
Bulls anticipate the next mainnet launch
A second reason for the increased attention to RUNE could be the upcoming mainnet launch on THORChain. This event has been highly anticipated since late 2021 when the launch was originally planned but delayed due to a variety of factors.
With Mainnet on the horizon, there will be push towards greater integration. https://t.co/gWIXVHC5FK will allow this. Watch this space. Watch the integration grow!$RUNE#LUNAISCOMING
The specific date for the mainnet launch has yet to be disclosed, but there is no shortage of interest from community members who have remained loyal throughout the struggles and hacks over the past year.
The requirements for mainnet launch are meeting all testnet goals, which includes the rehearsal of adding and removing chains, removing Bitcoin (BTC) and Litecoin (LTC) from the testnet, and several test runs with forking the chain.
A third factor helping to attract users and liquidity to THORChain is the high yields offered to liquidity providers on the protocol.
APRs offered on THORSwap. Source: THORSwap
Some of the highest yields offered include 55% for Binance USD (BUSD) and 30% for the DAI stablecoin. LTC deposits earn 26% and Dogecoin (DOGE) is set at 24%.
VORTECS™ data from Cointelegraph Markets Pro began to detect a bullish outlook for RUNE prior to the recent price rise.
The VORTECS™ Score, exclusive to Cointelegraph, is an algorithmic comparison of historical and current market conditions derived from a combination of data points including market sentiment, trading volume, recent price movements and Twitter activity.
VORTECS™ Score (green) vs. RUNE price. Source: Cointelegraph Markets Pro
As seen in the chart above, the VORTECS™ Score for RUNE spiked to a high of 78 on Feb. 25, around 57 hours before the price began to increase 55% over the next two days.
The views and opinions expressed here are solely those of the author and do not necessarily reflect the views of Cointelegraph.com. Every investment and trading move involves risk, you should conduct your own research when making a decision.
Development never stops in the blockchain sector and projects that continuously evolve are the ones that stay at the forefront and survive over the long-term.
One project attempting to stay on top of the innovation wave is Waves, a multi-purpose blockchain protocol designed to support a variety of use cases, including decentralized applications and smart contracts.
Data from Cointelegraph Markets Pro and TradingView shows that the price of WAVES has rallied 120% since forming a double bottom at $8.28 on Feb. 22.
WAVES/USDT 4-hour chart. Source: TradingView
Three reasons for the price growth for WAVES are the recent announcement that the protocol will migrate to Waves 2.0, a partnership with Allbridge that will connect Waves with other popular blockchain networks and the upcoming launch of a $150 million fund aimed at fostering Waves’ growth in the United States.
Migration to Waves 2.0
The biggest development sparking momentum for WAVES has been the announcement that the protocol has begun the process of migrating to Waves 2.0.
✔️ Protocol updates: the new version of Waves will be based on Practical Proof-of-Stake Sharding (PPOSS) Consensus and support Ethereum Virtual Machine (EVM).
Smooth transition is guaranteed! We’re now in transition to Waves 2.0 with a multi nuclei structure
Part of this transition includes the implementation of a new version of Waves consensus that will be based on practical proof-of-stake sharding (PPOSS), an upgrade that will help make the network faster, more secure and Ethereum Virtual Machine (EVM) compatible.
Development of the EVM-compatible network is scheduled to start this coming spring and will be connected to the existing network as a way to provide a “smoother transition to Waves 2.0 without depreciating the old network’s value or efficacy.”
Waves 2.0 will also include a new generic governance model, gravity bridges to all EVM-compatible networks and the creation of a blockchain agnostic Level 0 Inter-Metaverse protocol capable of providing a toolbox for creating connected metaverses that are unified by a shared economy and identity.
Partnership with Allbridge
Another development that has helped boost the price of WAVES is a partnership with Allbridge, a protocol focused on facilitating the transfer of assets between all blockchain networks.
This partnership was established as part of the larger goal of Waves 2.0 and establishes universal bridge integration.
The stated goal of the collaboration is “to create a unique bridge between Waves and supported EVM as well as non-EVM chains, such as NEAR Protocol, Solana and Terra.”
According to developers at Waves, the goal is to have Allbridge fully integrated by the end of May.
A third reason for the price growth in WAVES has been the addition of new partners to the ecosystem and the establishment of Waves Labs, which is a U.S.-based company.
Waves Labs, now headquartered in Miami, are coming back to support rapid growth across the ecosystem.
$150m fund and an incubation program will soon be started for the US teams, building products on Waves. The US is a key market to drive mass adoption in 2022.
Waves also revealed that it will be launching a stand-alone decentralized finance (DeFi) fund at some point in Q1 2022 that will focus on investing in selected Waves-based DeFi products.
The views and opinions expressed here are solely those of the author and do not necessarily reflect the views of Cointelegraph.com. Every investment and trading move involves risk, you should conduct your own research when making a decision.
“The Market Report” with Cointelegraph is live right now. On this week’s show, Cointelegraph’s resident experts discuss which decentralized autonomous organizations (DAOs) have the most potential in 2022.
But first, market expert Marcel Pechman carefully examines the Bitcoin (BTC) and Ether (ETH) markets. Are the current market conditions bullish or bearish? What is the outlook for the next few months? Pechman is here to break it down.
Next up, the main event. Join Cointelegraph analysts Benton Yaun, Jordan Finneseth and Sam Bourgi as they debate which DAO has the most potential. Will it be Bourgi’s pick of MonkeDAO, with its large community, Solana-based ecosystem and more than $10 million staked, earning around 7% to support the DAO development?
Not to be outdone, Yuan comes in with the tasty pick of PizzaDAO, which is one of the most revolutionary DAOs to hit the market. It is a global community of creators and pizza lovers who believe that pizza should be free. The DAO is selling rare digital pizza art in the form of nonfungible tokens (NFTs) to raise money to throw a global pizza party! Who wouldn’t want to get into that idea?
Lastly, we have Finneseth with his pick of Merit Circle, which taps into the hottest sectors in blockchain, gaming and the Metaverse. It helps provide a way for gamers to earn money playing the games they love. It also offers scholarships to players by lending them items from the treasury to be used for gameplay as well as delivering educational content with one-on-one coaching sessions to help scholars improve their performance. Currently, it supports 20 different popular games including Axie Infinity. Gaming is an immensely popular sector, but will it be enough to help push Finneseth to the top of our live poll? Once each of our experts has made their case, you, the audience, get to decide the winner by voting in our live poll, so be sure to stick around till after everyone’s presentations to cast your vote.
After the showdown, we’ve got insights from Cointelegraph Markets Pro, a platform for crypto traders who want to stay one step ahead of the market. The analysts use Cointelegraph Markets Pro to identify two altcoins that stood out this week: The Sandbox’s SAND and Terra’s LUNA.
Do you have a question about a coin or topic not covered here? Don’t worry. Join the YouTube chat room, and write your questions there. The person with the most interesting comment or question will be given a free month of Cointelegraph Markets Pro, worth $100.
“The Market Report” streams live every Tuesday at 12:00 pm ET (5:00 pm UTC), so be sure to head on over to Cointelegraph’s YouTube page and smash those like and subscribe buttons for all our future videos and updates.
According to an investor presentation published Tuesday, U.S.-based payment solutions provider Shift4 announced its acquisition of The Giving Block in cash and stock for $54 million, plus a potential earnout of up to $246 million. The Giving Block is an online platform that allows over 1,300 nonprofit organizations and charities to accept crypto donations.
As told by its annual report, the organization processed $69.64 million in crypto donations, an increase of 1,558% from 2020. Out of this amount, approximately $12.3 million came from donations by nonfungible token, or NFT, projects. Ether (ETH) became the most-popular crypto donated for the first time, accounting for nearly half of the total volume. Last month, The Giving Block provided Cointelegraph with a sample list of six charities on the receiving end of crypto donations and how philanthropy has positively impacted such organizations.
Regarding the acquisition, the team at The Giving Block wrote:
“Shift4’s status as a leading payments company with over $200 billion in annual payments volume, plus our shared commitment to taking crypto mainstream and leading on nonprofit sector payments innovation, has given us the opportunity to have the impact on the world we began dreaming up.”
“Shift4 will invest further in The Giving Block’s successful strategy while also pursuing a $45+ billion embedded cross-sell opportunity by bundling crypto donation capabilities with traditional card acceptance. This represents just a small portion of the $470+ billion nonprofit addressable markets that Shift4 will uniquely be able to pursue as a result of this acquisition.”
The Giving Block also launched its Ukraine Emergency Response Fund last week in response to the ongoing Russian invasion. Proceeds, which can be donated via Bitcoin (BTC), ETH and other altcoins, will go to at least 10 humanitarian relief organizations and international nonprofits.
Our Ukraine Emergency Response Fund is now LIVE
The nonprofits within this fund are saving lives and providing critical support on the ground to those impacted by the #Ukraine crisis.
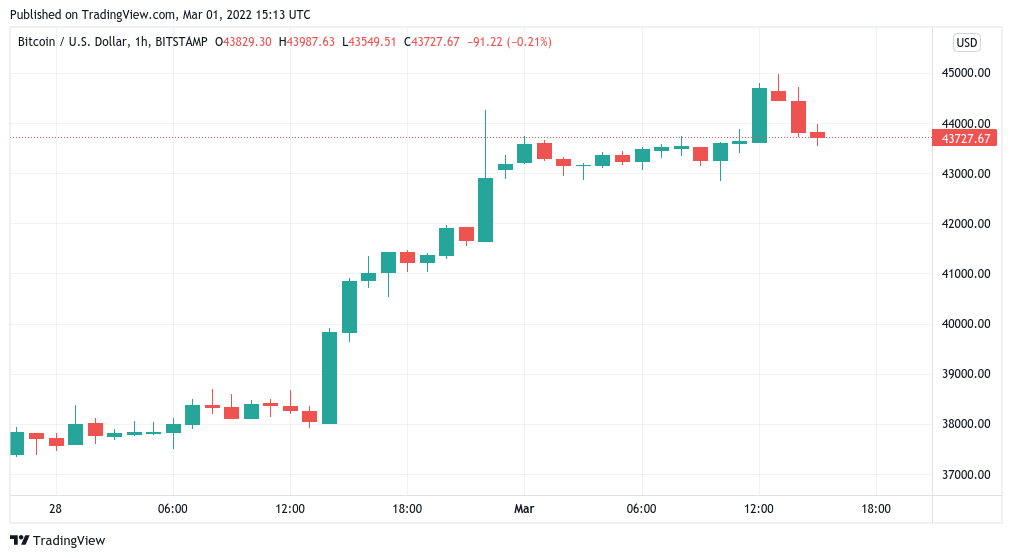
Data from Cointelegraph Markets Pro and TradingView followed BTC/USD as it declined from its local peak of $44,980 on Bitstamp at the opening bell.
The second day of trading with armed conflict in Europe as its background, March 1 continued a surprisingly cool phase for U.S. equities, with only oil showing the knock-on effects of the conflict between Russia and Ukraine.
Bitcoin, by contrast, held onto the majority of its advances, which had been rekindled in earnest on March 1. Versus the same time a week ago, BTC/USD was up 17% at the time of writing.
Bitcoin since weaponized finance began with Russia.
“Forty-four thousand dollars has been tested a million times, wouldn’t wanna be caught shorting that,” popular Twitter account DonAlt summarized as part of a post about low timeframes.
“$40 tho good support if we should get a surprise dip.”
Bitcoin thus improved its image as a potential safe haven in times of strife, reversing initial losses as the Ukraine situation began to unfold late last week.
“Bitcoin is proving itself as a safe haven in times of global uncertainty. It has outperformed every other asset class by orders of magnitude since the Ukraine invasion,” Charles Edwards, founder of crypto fund Capiole declared.
At the time of writing, BTC/USD was declining towards the $43,600 zone previously highlighted by fellow analyst Nebraskan Gooner as a necessary zone to hold for the daily close.
According to data from on-chain analytics firm Glassnode, smaller ETH addresses holding at least 0.01 ETH and BTC addresses 0.1 BTC both reached all-time highs.
There were 21.9 million 0.01 ETH wallets and 3.35 million 0.1 BTC wallets detected as of March 1.
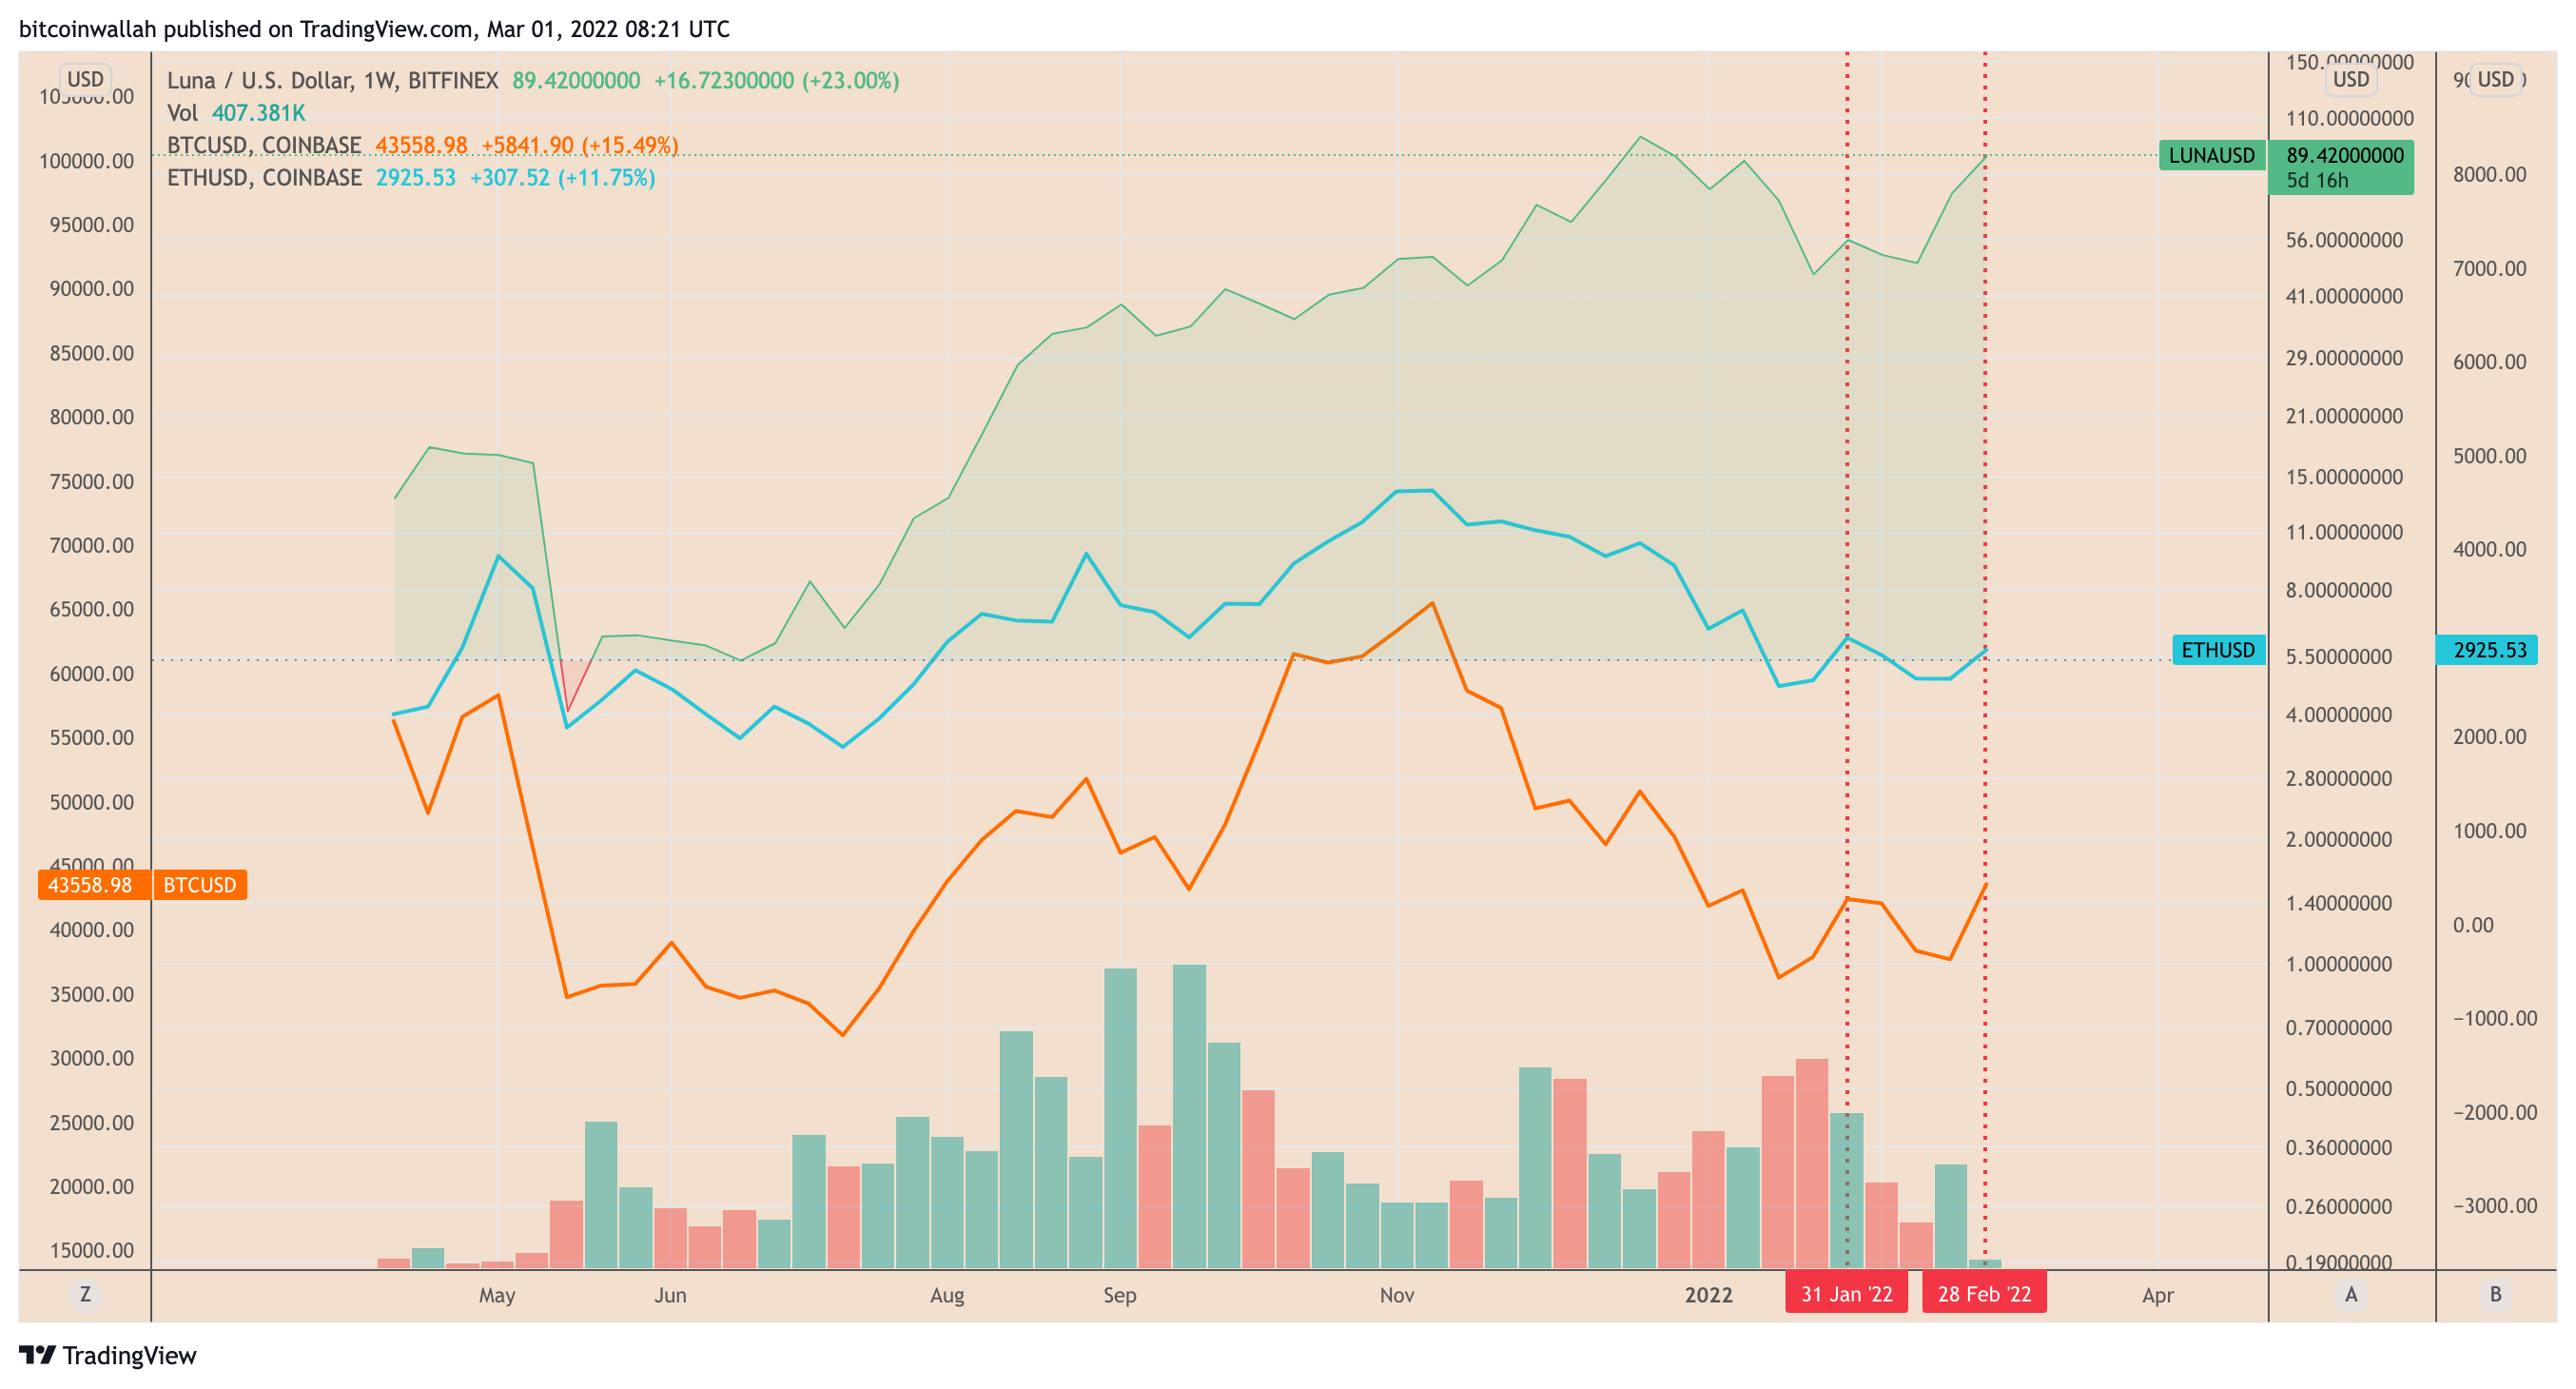
Terra (LUNA) emerged as one of the best performing financial assets in February, a month mired by geopolitical conflicts and their negative impacts on the crypto market.
LUNA decouples from the crypto market
LUNA’s price surged by a little over 75% to reach $91.50 at the month’s UTC close. In comparison, the percentage performance of other top tokens, mainly Bitcoin (BTC) and Ether (ETH), in the same period came out to be around 12.25% and 9%, respectively.
LUNA/USD versus BTC/USD and ETH/USD weekly price charts. Source: TradingView
Interestingly, most of LUNA’s gains in February surfaced on the month’s last day. The Terra token jumped 26% on Feb. 28, in part due to similar upside moves elsewhere in the crypto market. For instance, BTC and ETH rose 14.50% and over 11.50%, respectively, on the same day.
While still positive at 0.09, LUNA’s correlation with Bitcoin has come off lately after hitting 0.81 on Feb. 21, data from TradingView shows. A correlation of 1 means that two assets are in lockstep, while 0 shows that their price moves independently.
LUNA/USD correlation coefficient on the daily chart. Source: TradingView
Terra’s LUNA/BTC pair also showed its growing valuation against the top cryptocurrency.
In detail, the LUNA/BTC pair rose by over 56% to 21,171 satoshis in February, suggesting traders sought hedge in the Terra token as Bitcoin’s correlation with a bearish stock market grew, reaching 0.70 earlier this year.
Bitcoin correlation with stocks since March 2021. Source: Bloomberg
As to why traders appeared to have considered LUNA as their interim safe haven in the first place, the answer might lie in Terra’s token economics.
29M Terra tokens destroyed
Data fetched by analytics platform Smart Stake showed that Terra protocol burned 29 million LUNA tokens worth $2.57 billion recently. That happened as the supply of TerraUSD (UST), a stablecoin backed not by the U.S. dollar but LUNA, increased from around 11.26 million on Feb. 1 to almost 12.92 million on Feb. 28, marking an increase of nearly 14.75%.
LUNA and UST supply all across February 2022. Source: Smart Stake
Traders consider an increasing UST supply a bullish catalyst for LUNA, mainly because of the so-called UST-LUNA token model. In detail, Terra preserves UST’s peg of USD through an elastic monetary policy. So when the value of UST goes above $1, Terra incentivizes its users to burn LUNA and mint UST.
But when the UST supply contracts, LUNA valuation decreases due to a slowdown in the burning mechanism. All and all, LUNA’s valuation tends to rise alongside UST’s supply.
On Feb. 22, the Luna Foundation Guard (LFG) — a nonprofit organization supporting the Terra blockchain ecosystem, announced that it had raised $1 billion in a LUNA token sale round led by Three Arrows Capital, a venture capital firm backed by Ethereum-skeptic Su Zhu and Jump Crypto, a trading group known for assisting Solana’s cross bridge platform Wormhole in replenishing their stolen $300 million.
1/ The long awaited [REDACTED] 3 is here!
The Luna Foundation Guard (LFG) has closed a $1 billion private token sale to establish a decentralized $UST Forex Reserve denominated in $BTC!
LFG revealed that it would use the proceeds to build a “UST Forex Reserve,” raising prospects of boosting the stablecoin’s supply by another billion-dollar worth of LUNA-backed tokens.
LUNA’s price has risen by nearly over 90% since the LFG’s announcement. In contrast, the total market capitalization of all the cryptocurrencies combined has rallied by just 13% in the same period, underscoring that crypto traders have been flocking into the Terra market.
What’s ahead for LUNA?
Terra’s technical outlook looks skewed to the upside owing to an ongoing “bull flag” breakout move.
Bull flags are bullish continuation patterns that appear when the price consolidates lower inside a descending channel after a strong move upward. Eventually, it breaks out of the channel range to the upside, with a price target ideally at length equal to the size of the upside move that preceded the bull flag formation.
LUNA appears to have entered the final phase its bull flag setup, as shown in the chart below. It now eyes a run-up toward $120, an all-time high for Terra if achieved.
LUNA/USD three-day price chart featuring bull flag setup. Source: TradingView
On the flip side, LUNA’s volumes on the three-day chart appear weak, showing the ongoing upward retracement remains less convincing to traders. Its volume profile also shows little historic activity above $70.
Additionally, LUNA’s daily relative strength indicator (RSI) has been flashing an “overbought” warning, noting that it could go a degree of price correction in the coming sessions.
Nonetheless, in the long term, the Terra token’s path of least resistance remains to the upside, with its year-over-year performance against the dollar coming out to be over 1,200% as of Feb. 28, 2022.
The views and opinions expressed here are solely those of the author and do not necessarily reflect the views of Cointelegraph.com. Every investment and trading move involves risk, you should conduct your own research when making a decision.