Tag: Analysis

  • Analysis: Institutional BTC adoption is a ‘cyclical wave’, not a linear increase, says Saphira Group’s Dyment

    Analysis: Institutional BTC adoption is a ‘cyclical wave’, not a linear increase, says Saphira Group’s Dyment

    Analysis: Institutional BTC adoption is a 'cyclical wave', not a linear increase, says Saphira Group's Dyment

    • Fund manager Jeff Dyment argues fears of fading institutional Bitcoin demand are overblown and miss the “bigger picture.”
    • Institutional BTC buying is a “cyclical wave,” not a straight line, with 51 new corporate treasuries in H1 2025 alone.
    • Options market data shows whales are building upside exposure, buying September $130K BTC calls.

    In a market often fixated on short-term price swings, fund manager Jeff Dyment of Saphira Group is urging investors to take a step back and look at the bigger picture.

    His thesis is simple yet powerful: recent data points suggesting that institutional Bitcoin buying is losing steam are missing the forest for the trees.

    In a note shared with CoinDesk, Dyment argues that fears of dwindling institutional demand for Bitcoin are largely overblown, rooted in what he sees as narrow, short-term snapshots of the market.

    He acknowledges the recent cooling in ETF and corporate purchases – for instance, Michael Saylor’s Strategy acquired just 16,000 BTC last month, a sharp decrease from its 171,000 BTC haul in December.

    However, Dyment insists this is not a sign of decline, but rather a natural ebb in what he describes as a “cyclical wave” of institutional adoption.

    “Institutional flows often come in waves rather than a steady linear increase,” Dyment wrote.

    Short-term demand fluctuations in the spot market are minor ripples on what is, in fact, a rising tide of institutional engagement.

    To support his argument, Dyment points to compelling data.

    In the first half of 2025 alone, 51 new corporate Bitcoin treasuries were established, a figure equal to the total number established from 2018 to 2022 combined.

    This represents a staggering 375% year-over-year increase in corporate Bitcoin buying.

    Publicly traded companies now collectively hold 848,902 BTC, which accounts for approximately 4% of Bitcoin’s total supply.

    In the second quarter of 2025 alone, these companies added 131,000 BTC to their balance sheets.

    The ETF factor: a tsunami of regulated capital

    Dyment also highlights the explosive growth of spot Bitcoin ETFs as further, undeniable evidence of deepening institutional participation.

    BlackRock’s IBIT fund, which has already become the largest in the world, now holds an incredible 699,000 BTC, representing more than 3.3% of the total supply, after becoming the fastest-growing ETF in history.

    Collectively, U.S. spot ETFs have captured approximately 1.25 million BTC, or roughly 6% of the total supply, in just 18 months since their launch, Dyment points out in his note.

    This rapid accumulation by regulated investment vehicles underscores a structural shift in how capital is engaging with Bitcoin.

    Whales Position for Upside as Market Awaits a Spark

    Dyment’s thesis finds echoes in the derivatives market. In a recent note from QCP Capital, the Singapore-based fund observed that large “whale” investors are continuing to build exposure to upside risk.

    They are reportedly snapping up September $130,000 BTC call options and holding significant positions in 115,000/140,000 call spreads, all bets on a future price increase.

    “Vols remain pinned near historical lows, but a decisive breach of the $110K resistance could spark a renewed volatility bid,” QCP wrote in a Monday note.

    So, while market bears may point to stagnant spot flows and the nearly empty mempool (the queue of unconfirmed Bitcoin transactions) as signs of market fatigue, Dyment argues that these are merely surface-level ripples.

    Underneath, he contends, the institutional tide is rising. Wall Street, with its trillions upon trillions of dollars in regulated capital, is hungry for crypto exposure. It’s just not going to arrive all at once in a straight line.

    Broader market movements provide context

    The aformentioned analysis comes amidst a backdrop of volatile but resilient price action for Bitcoin and mixed signals from traditional markets.

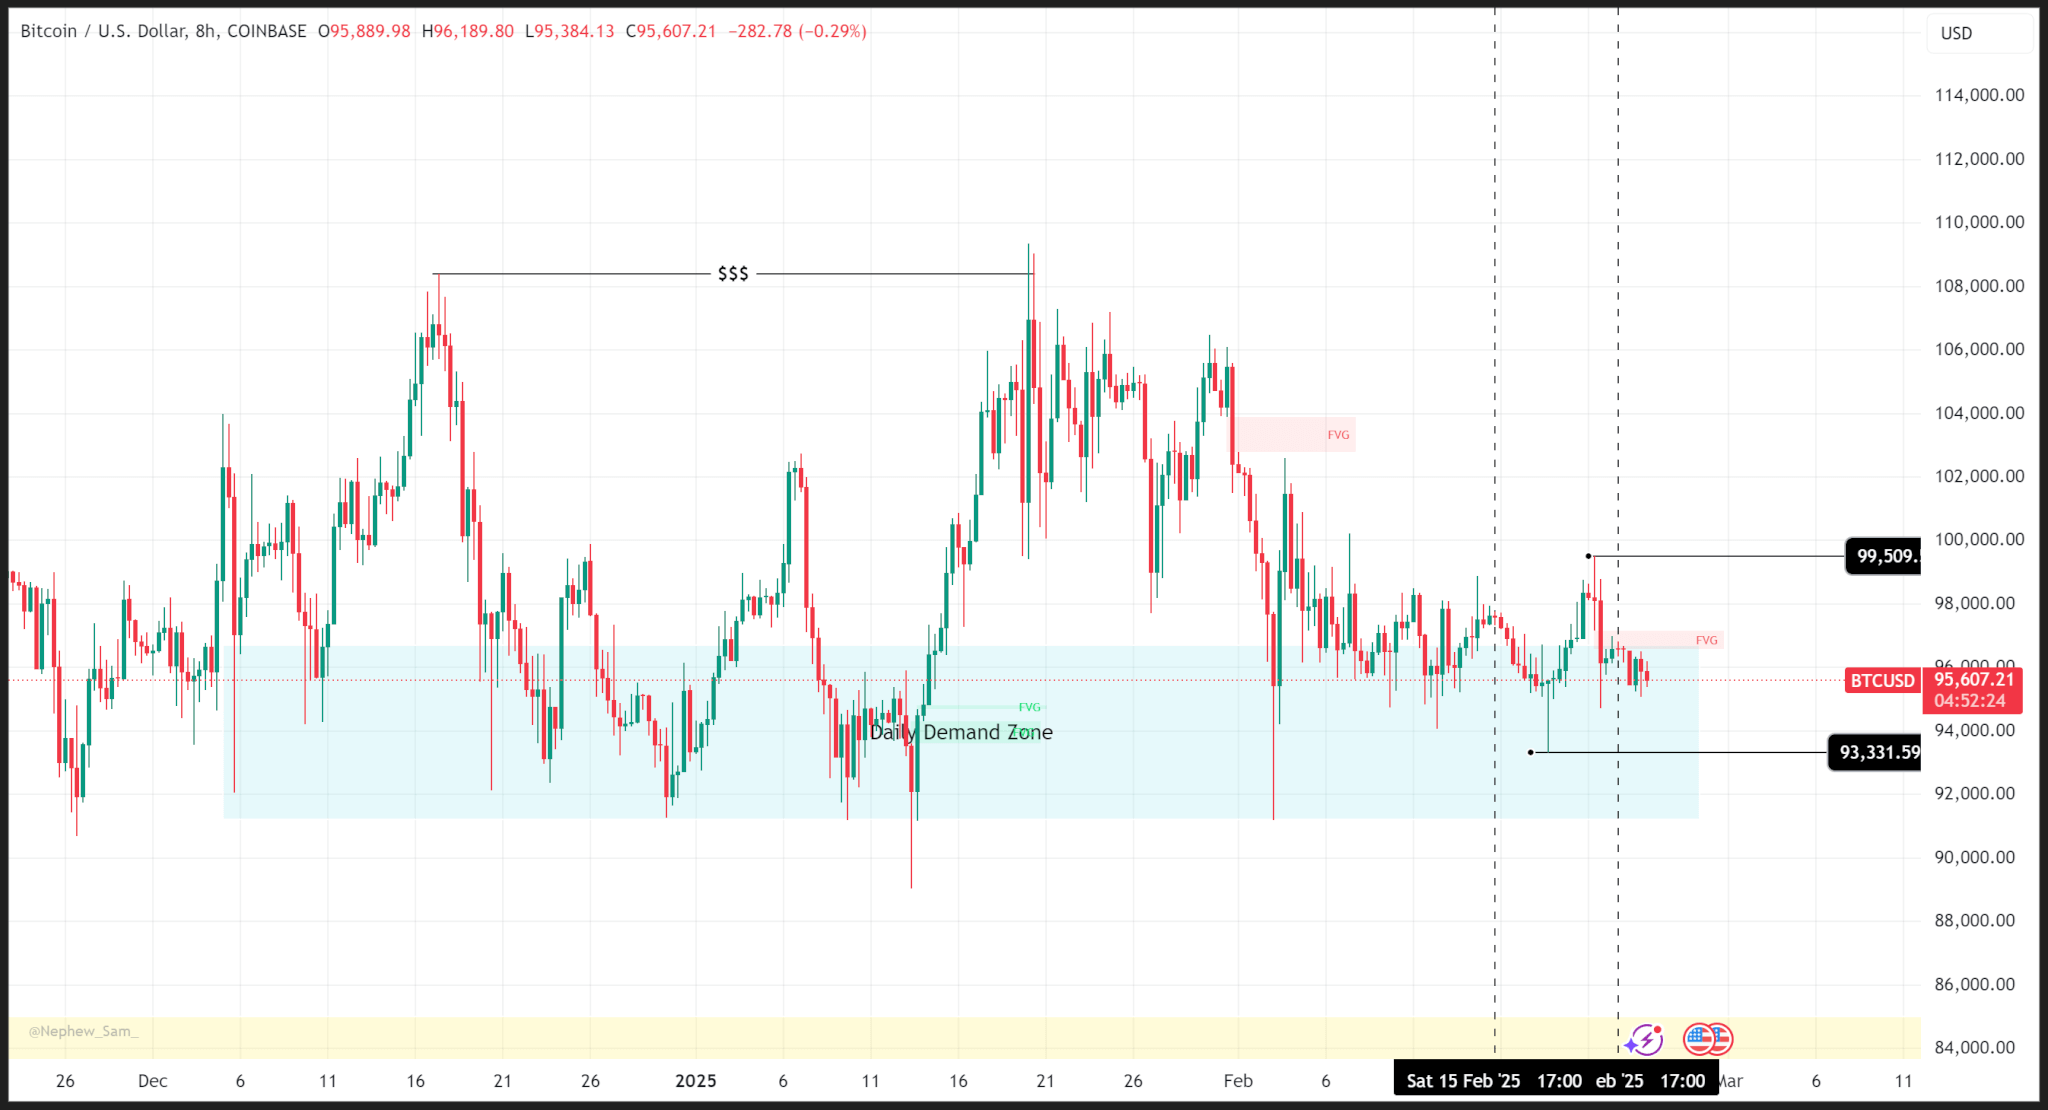
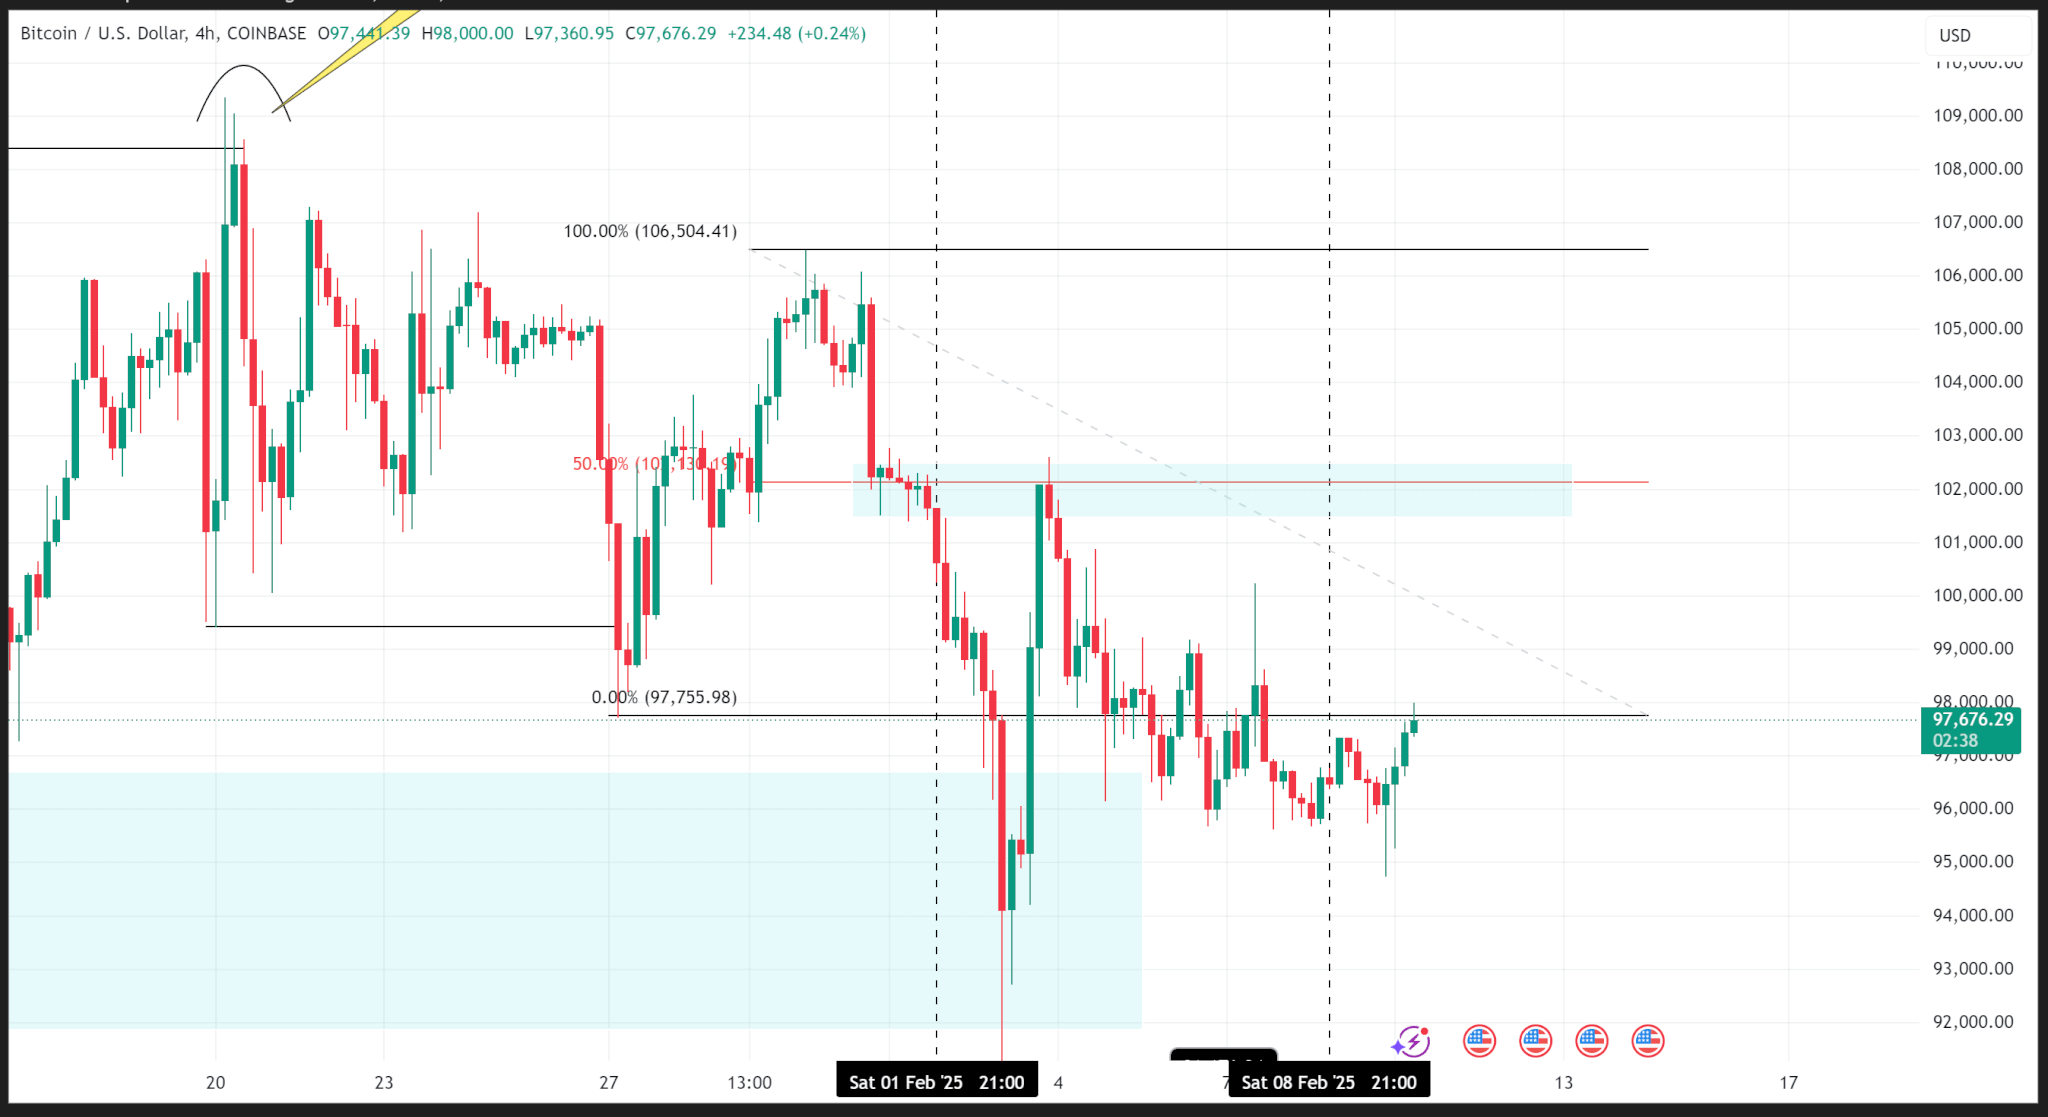
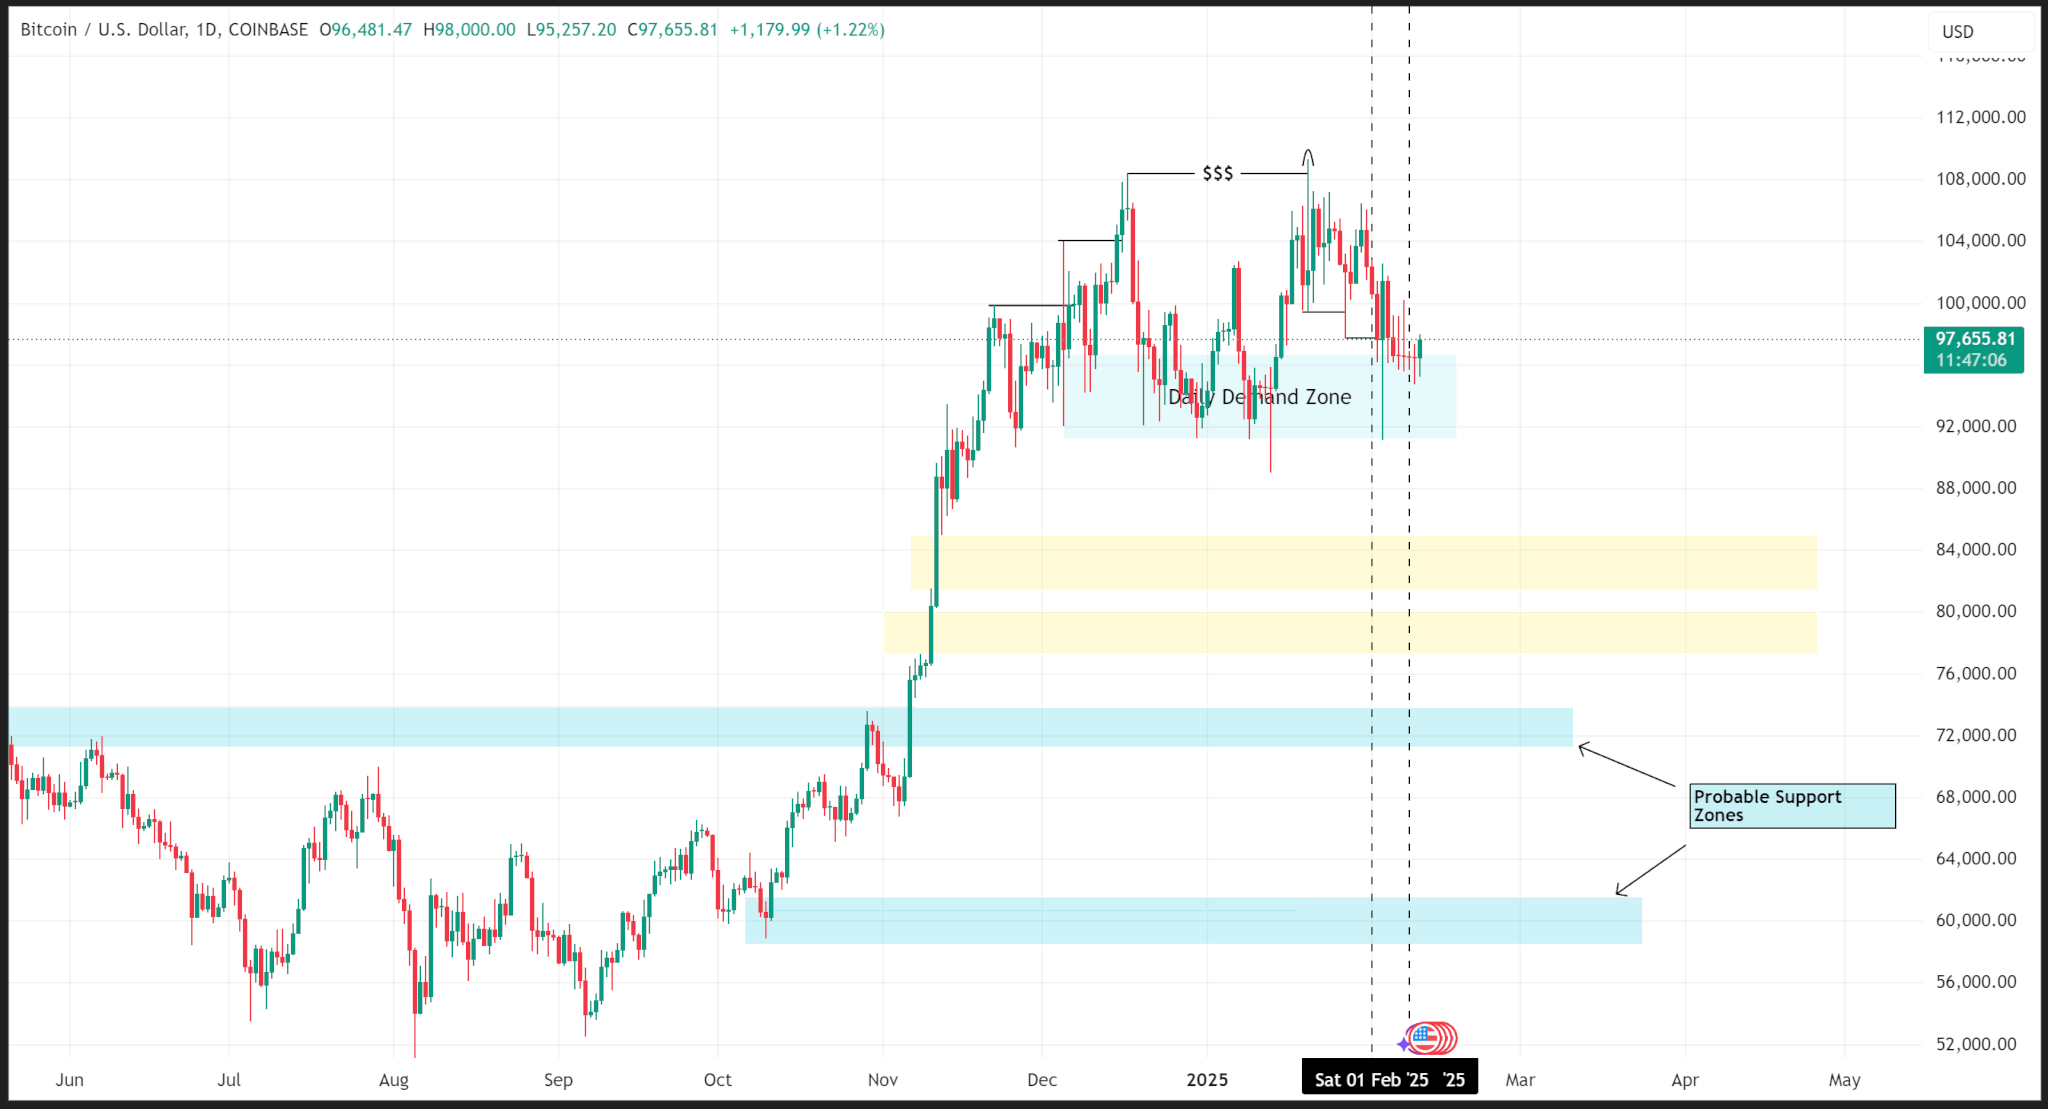
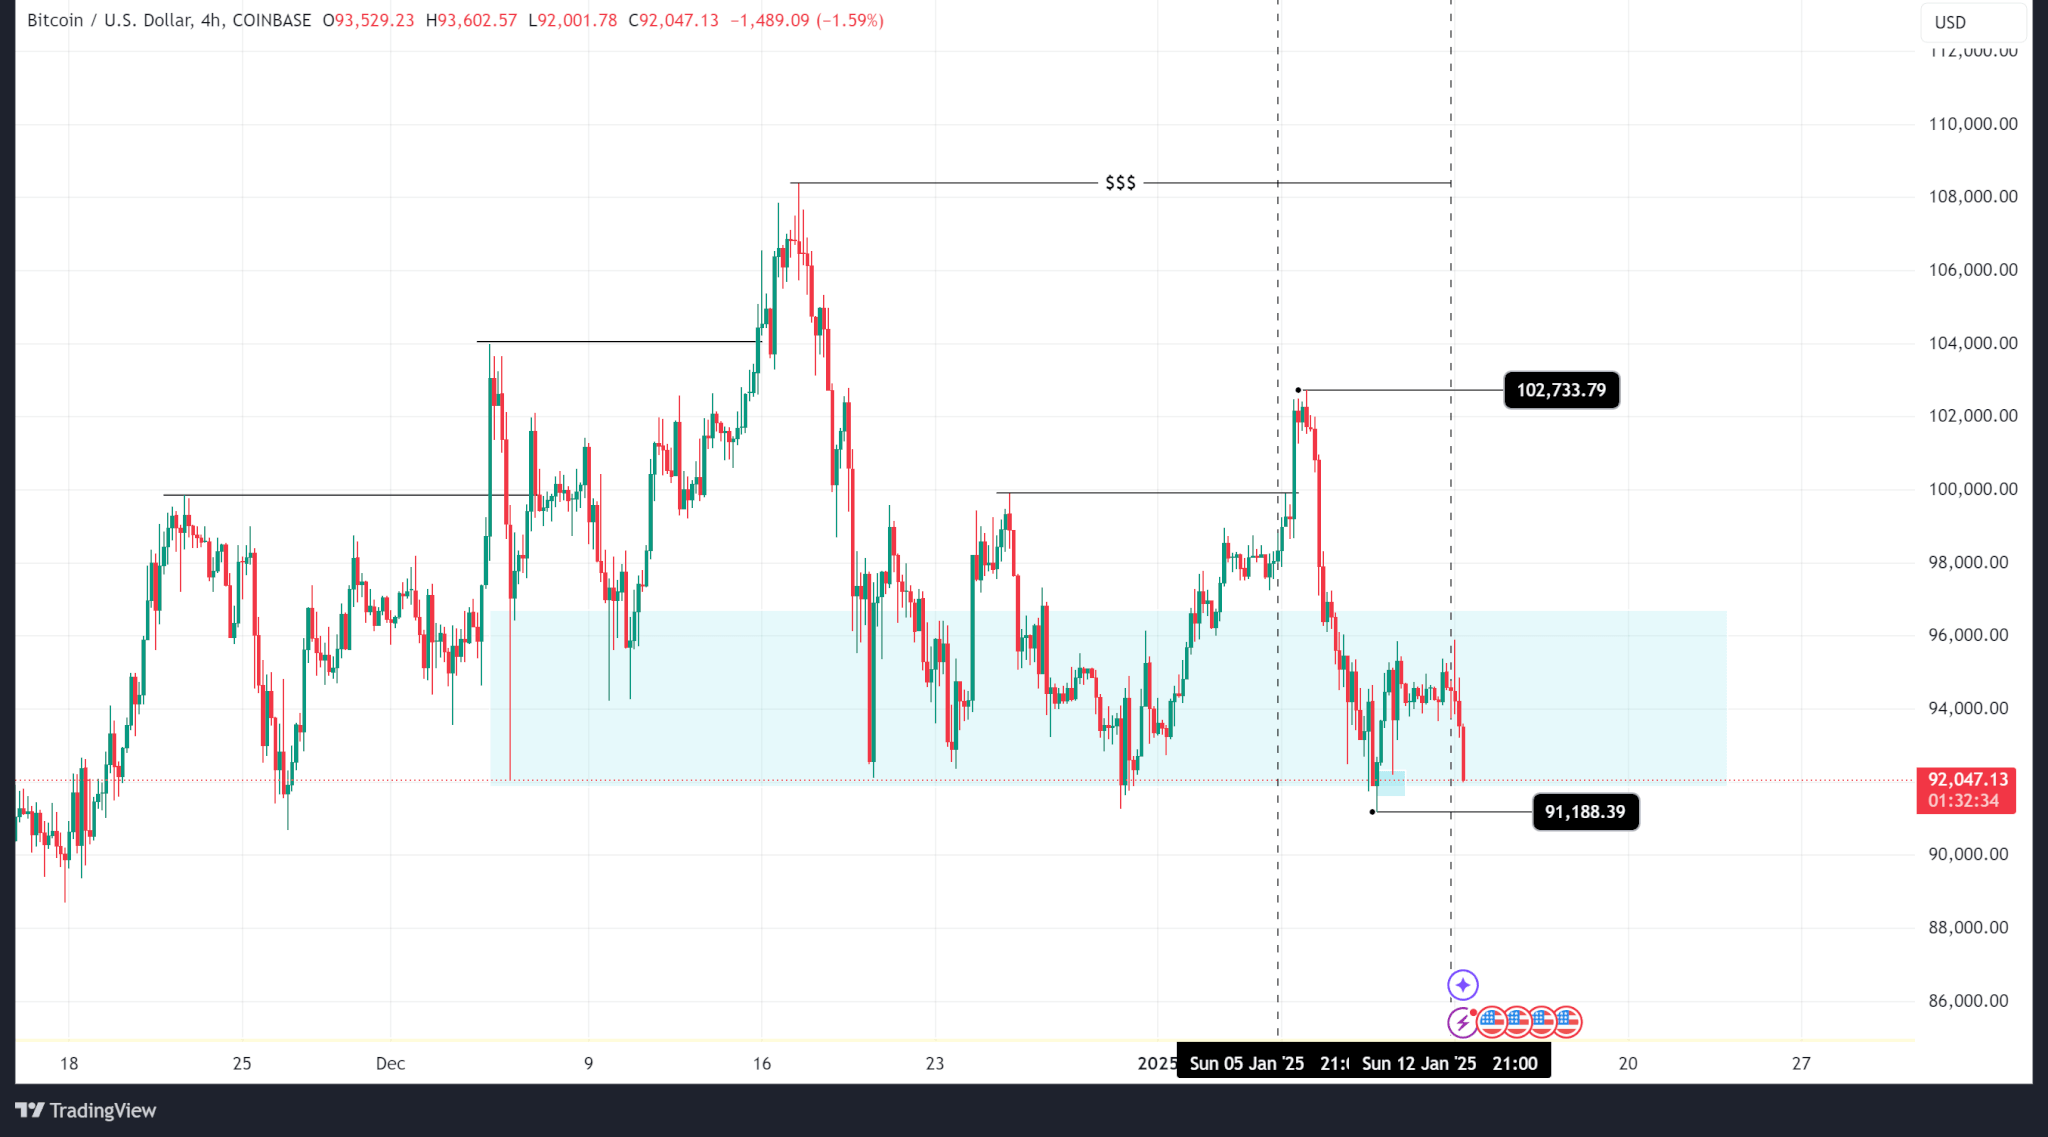
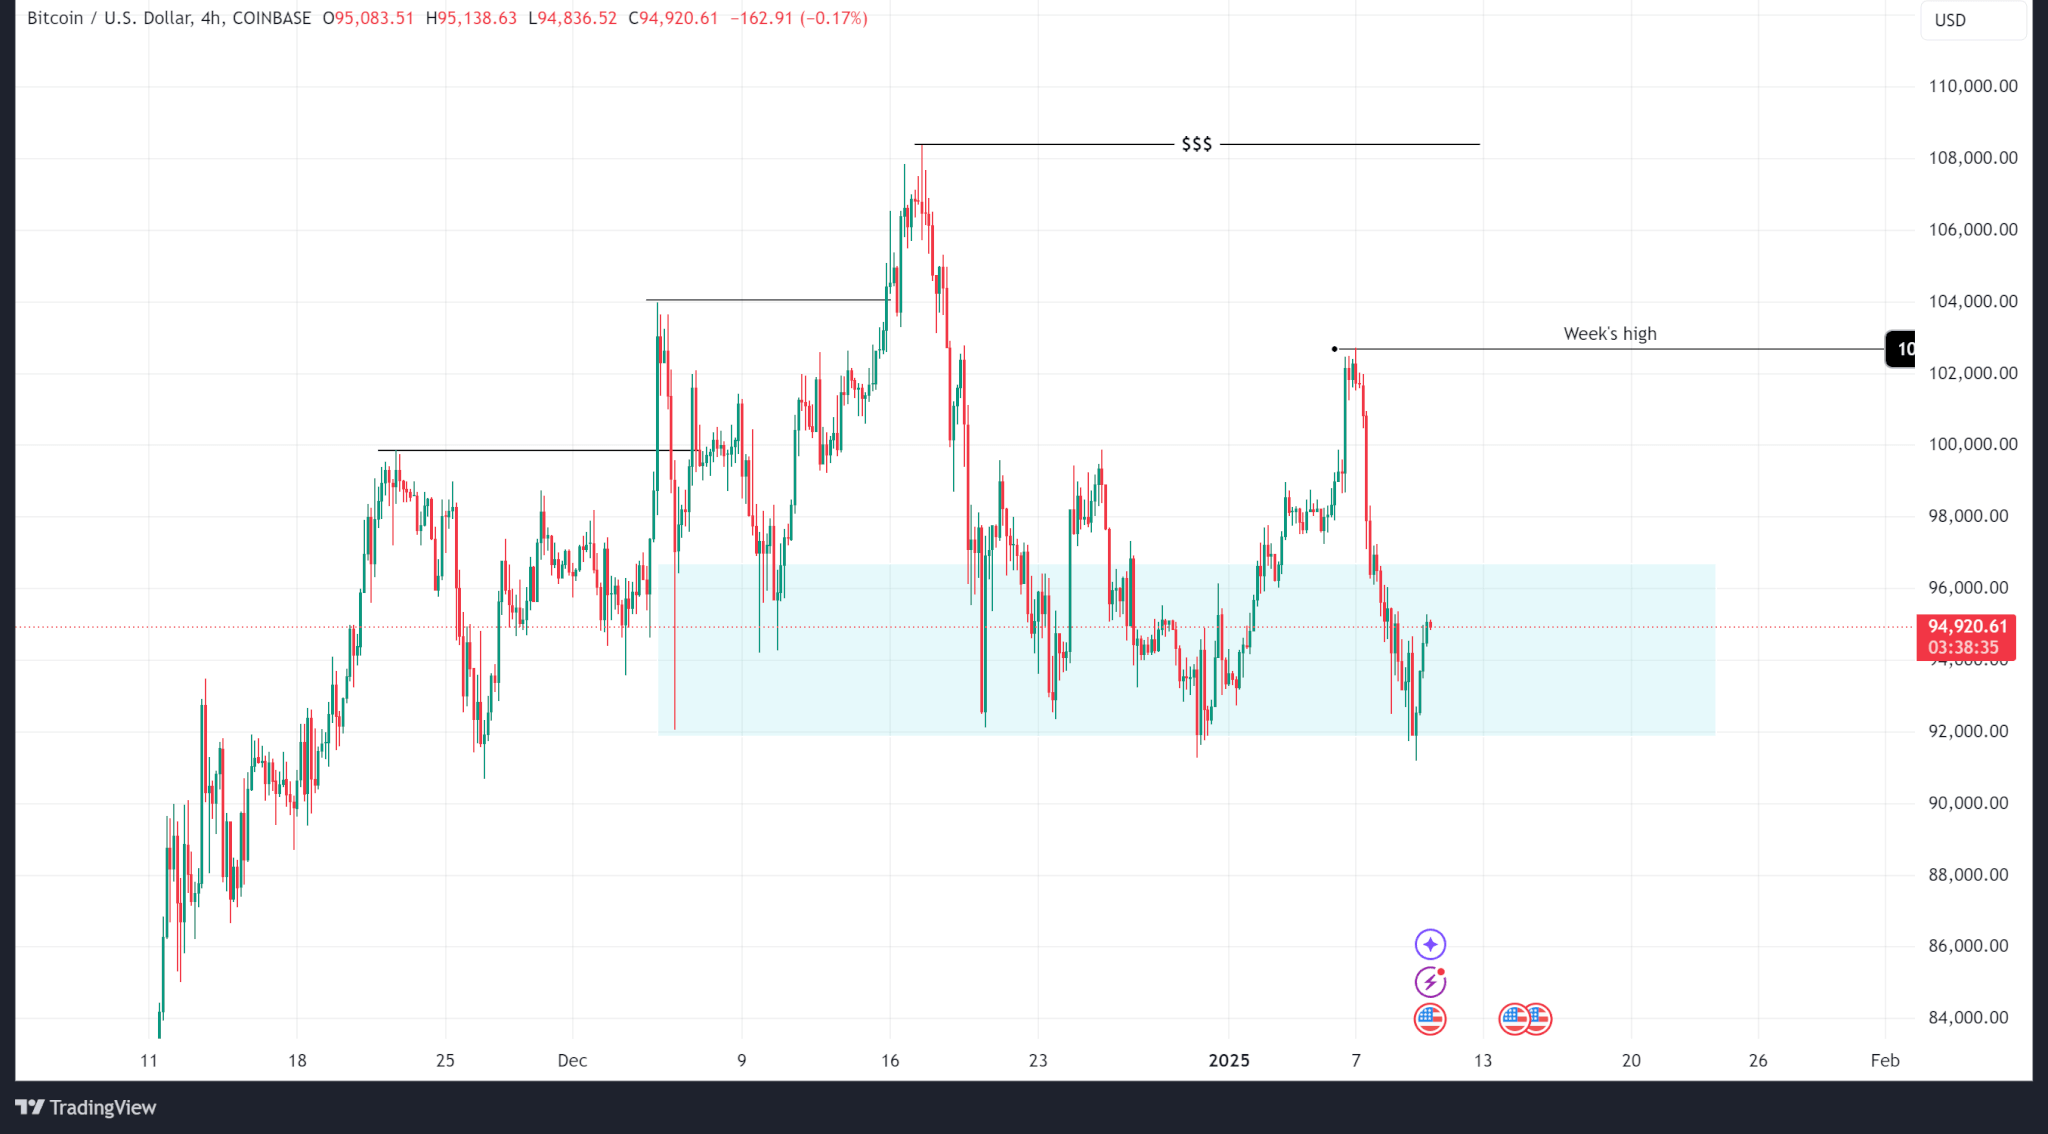
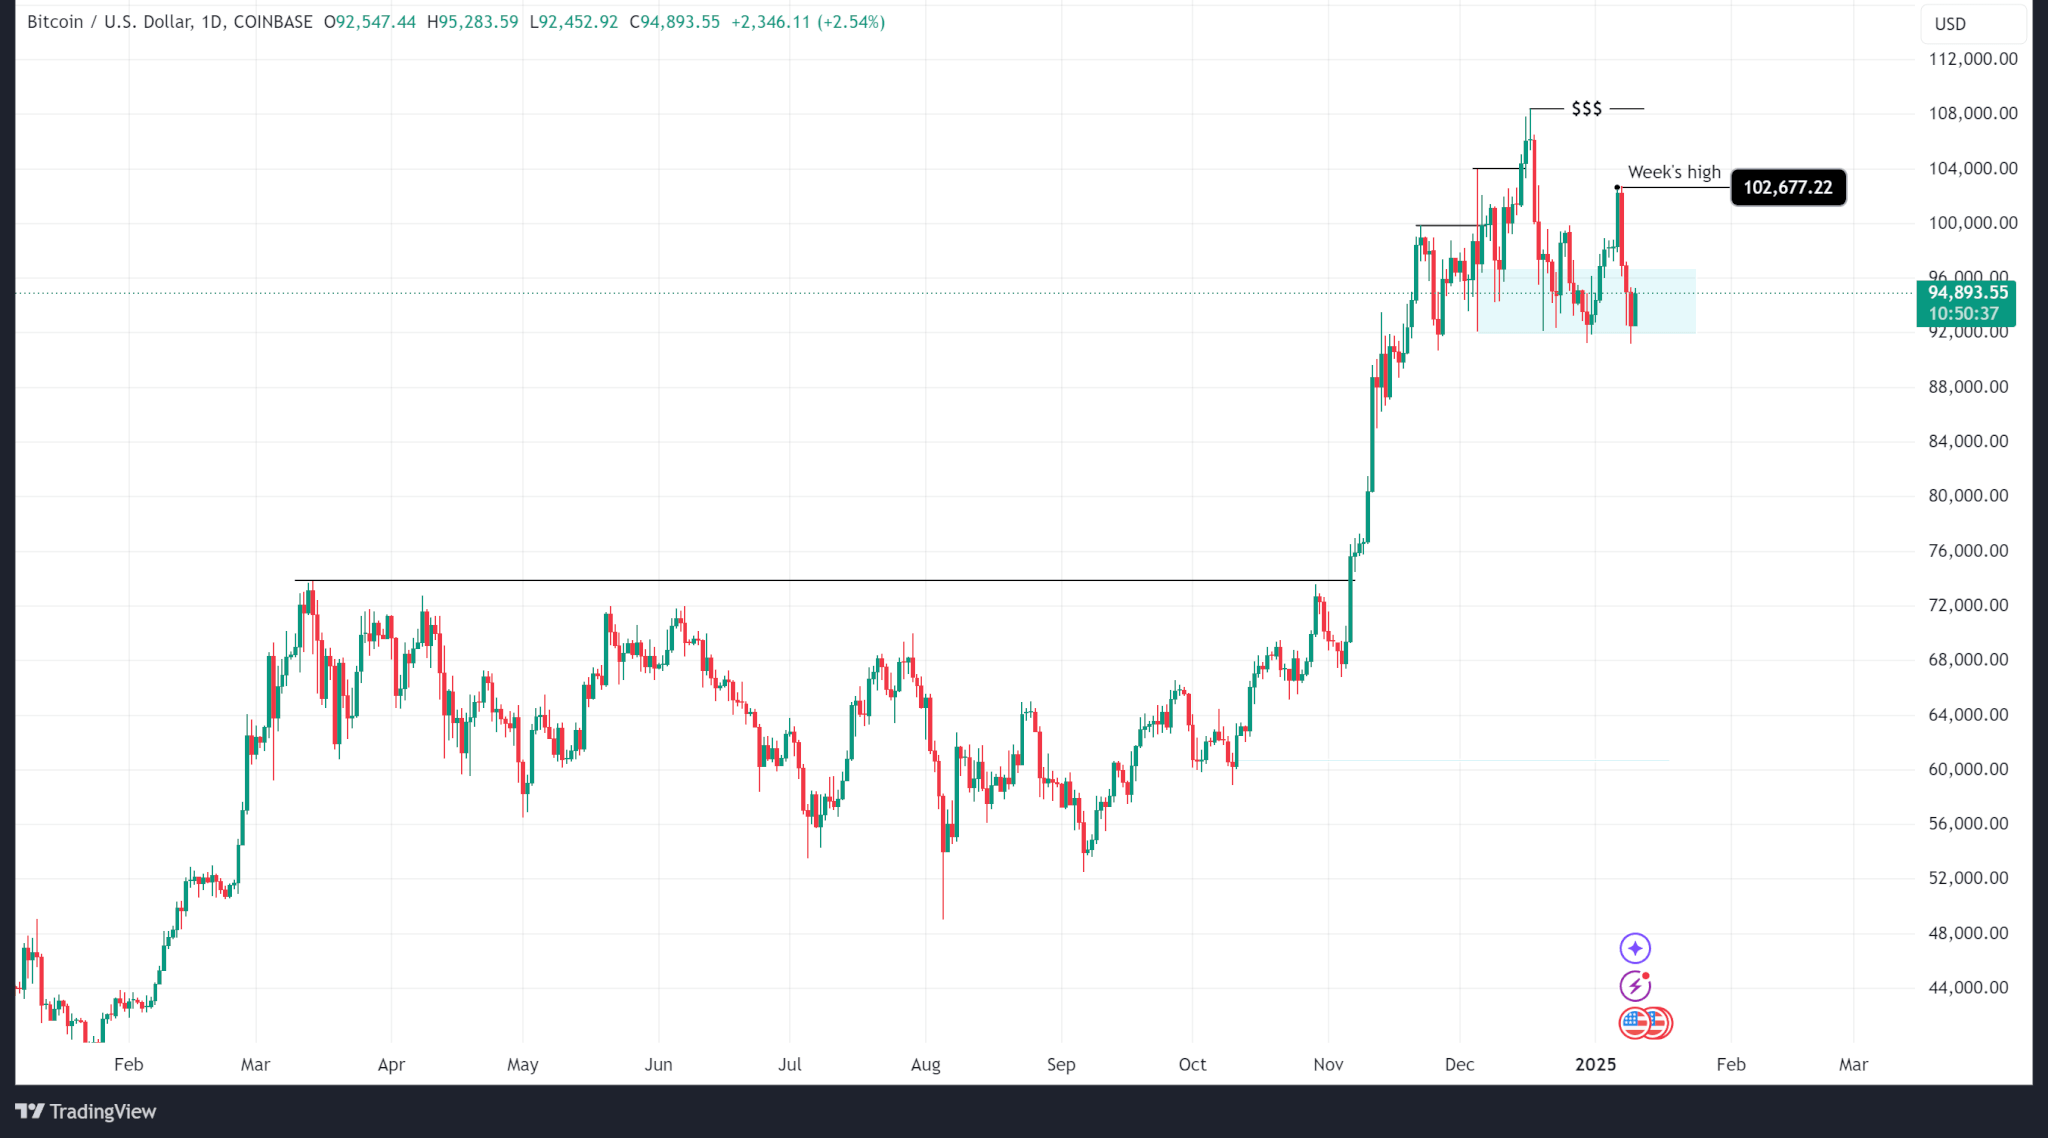
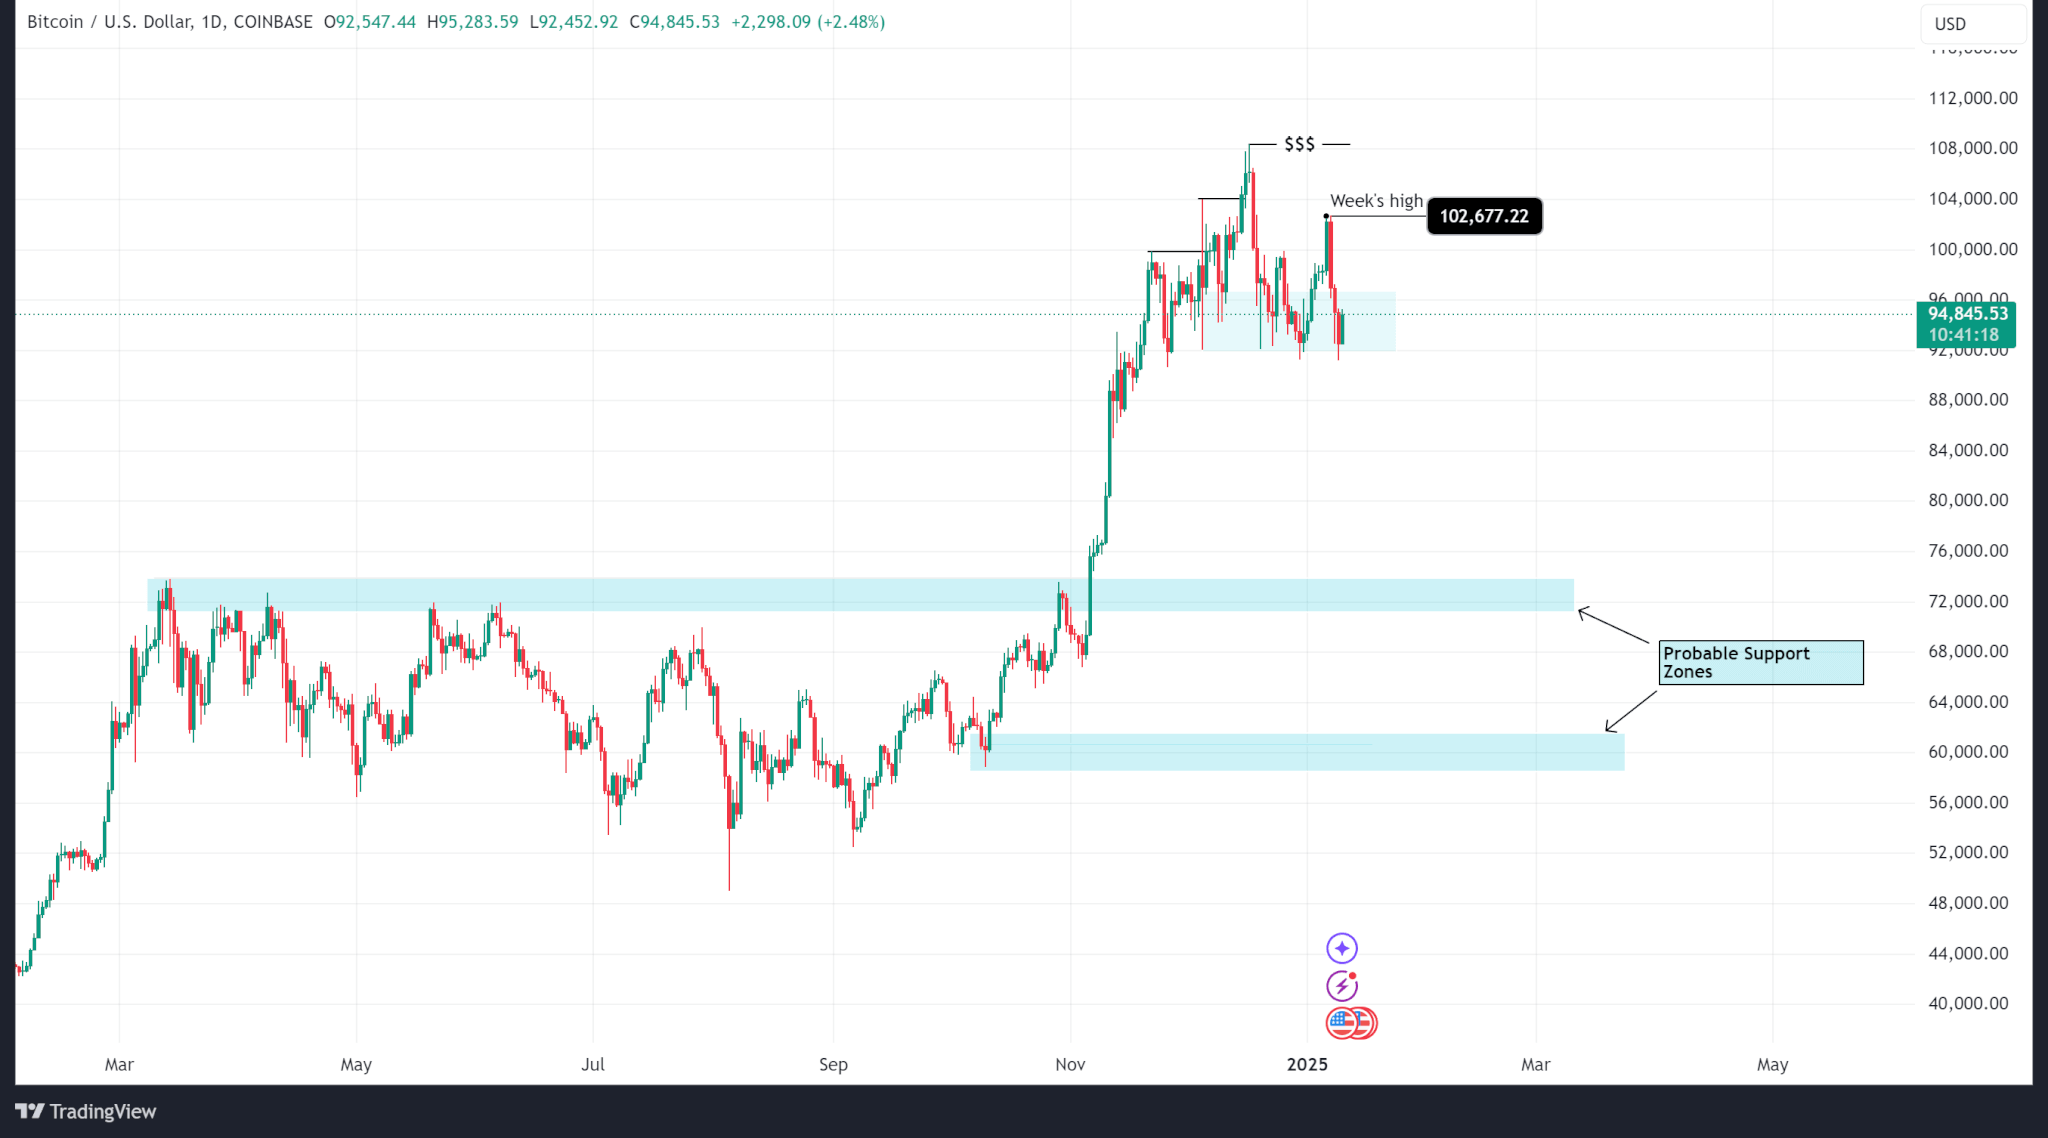
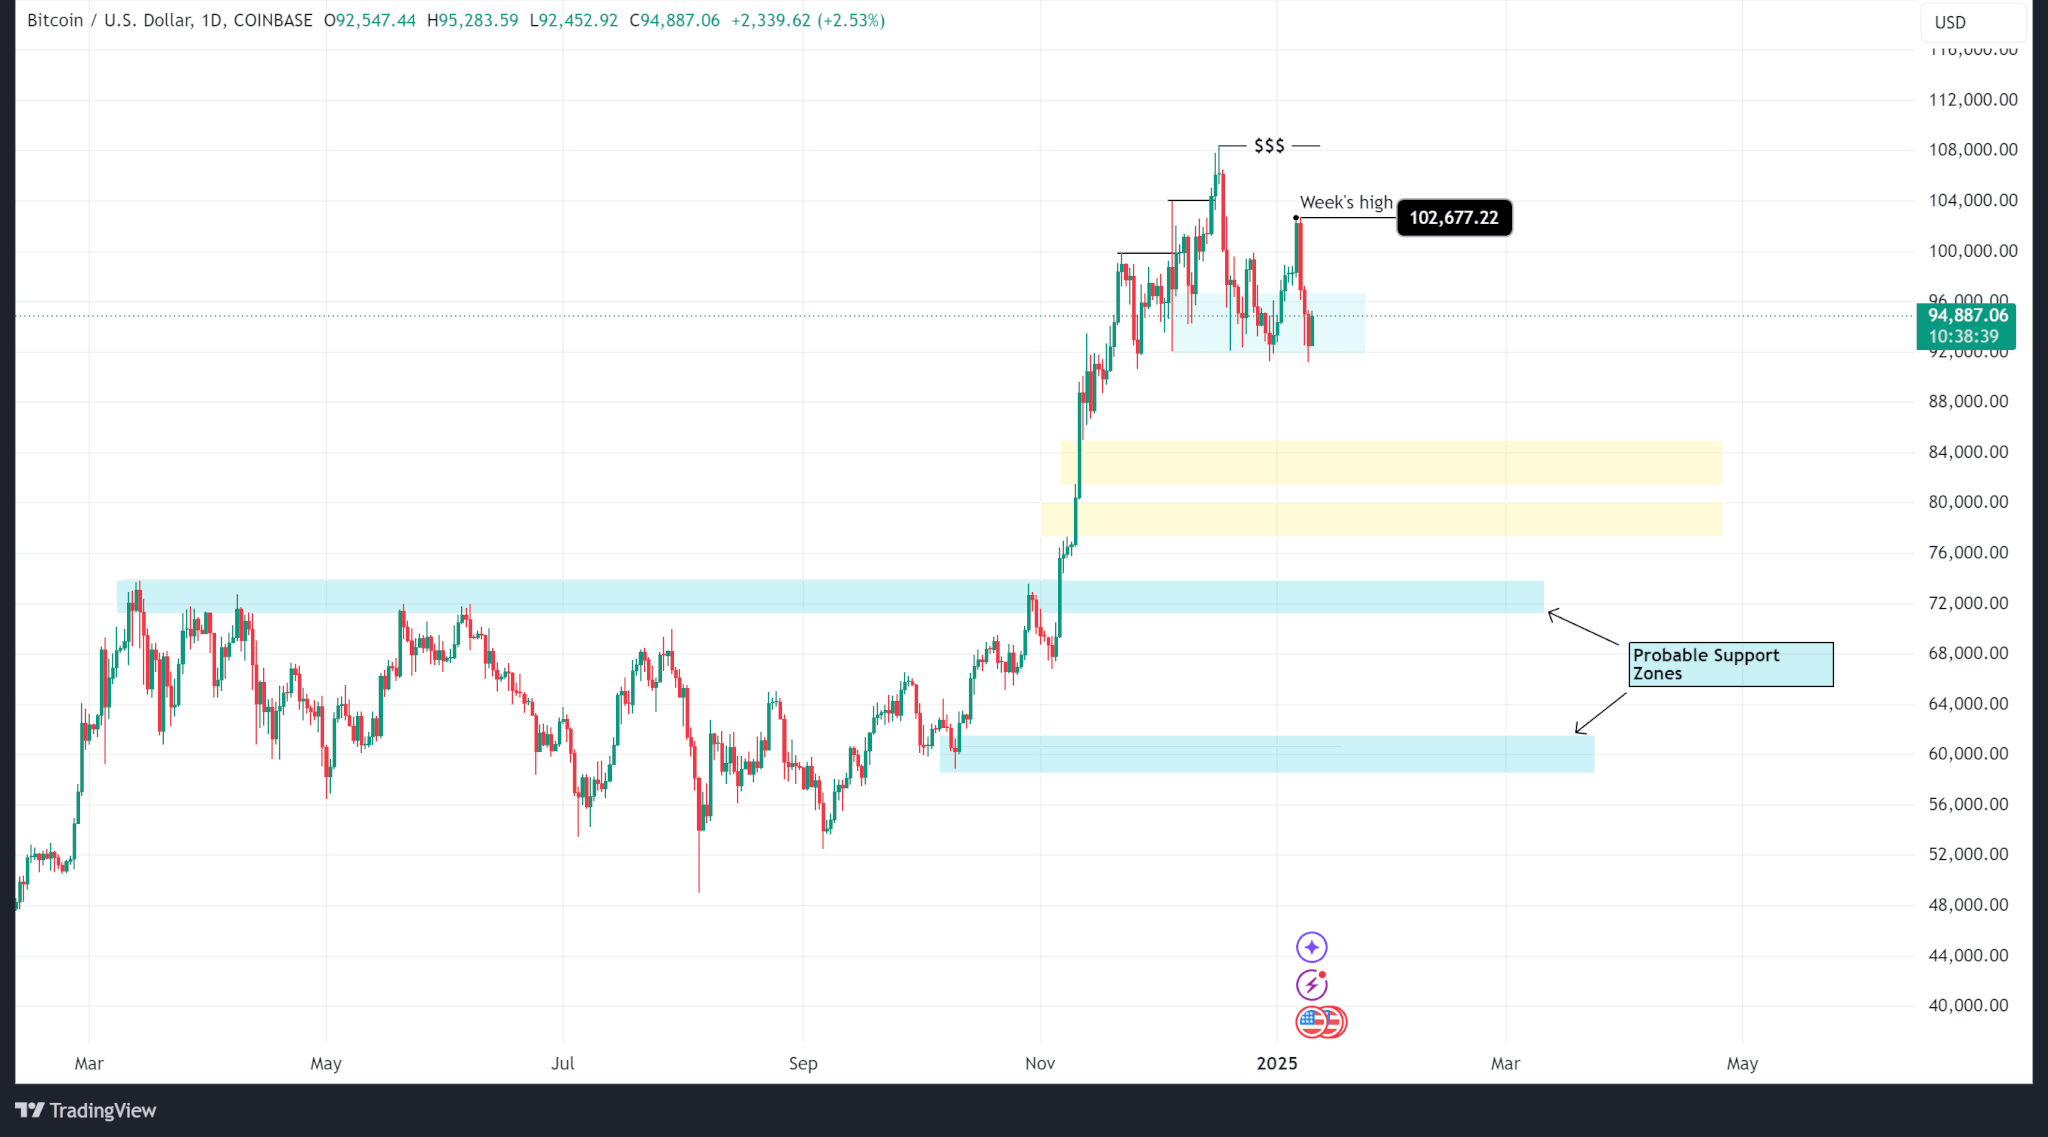
    • BTC: Bitcoin fell 1.02% from July 6 at 22:00 to July 7 at 21:00, testing key support at $107,519.64 amid heavy selling, before staging a V-shaped recovery off $107,800. On-chain data showed strong support clusters at $106,738 and $98,566 held by 1.68 million addresses, according to CoinDesk Research’s technical analysis bot.

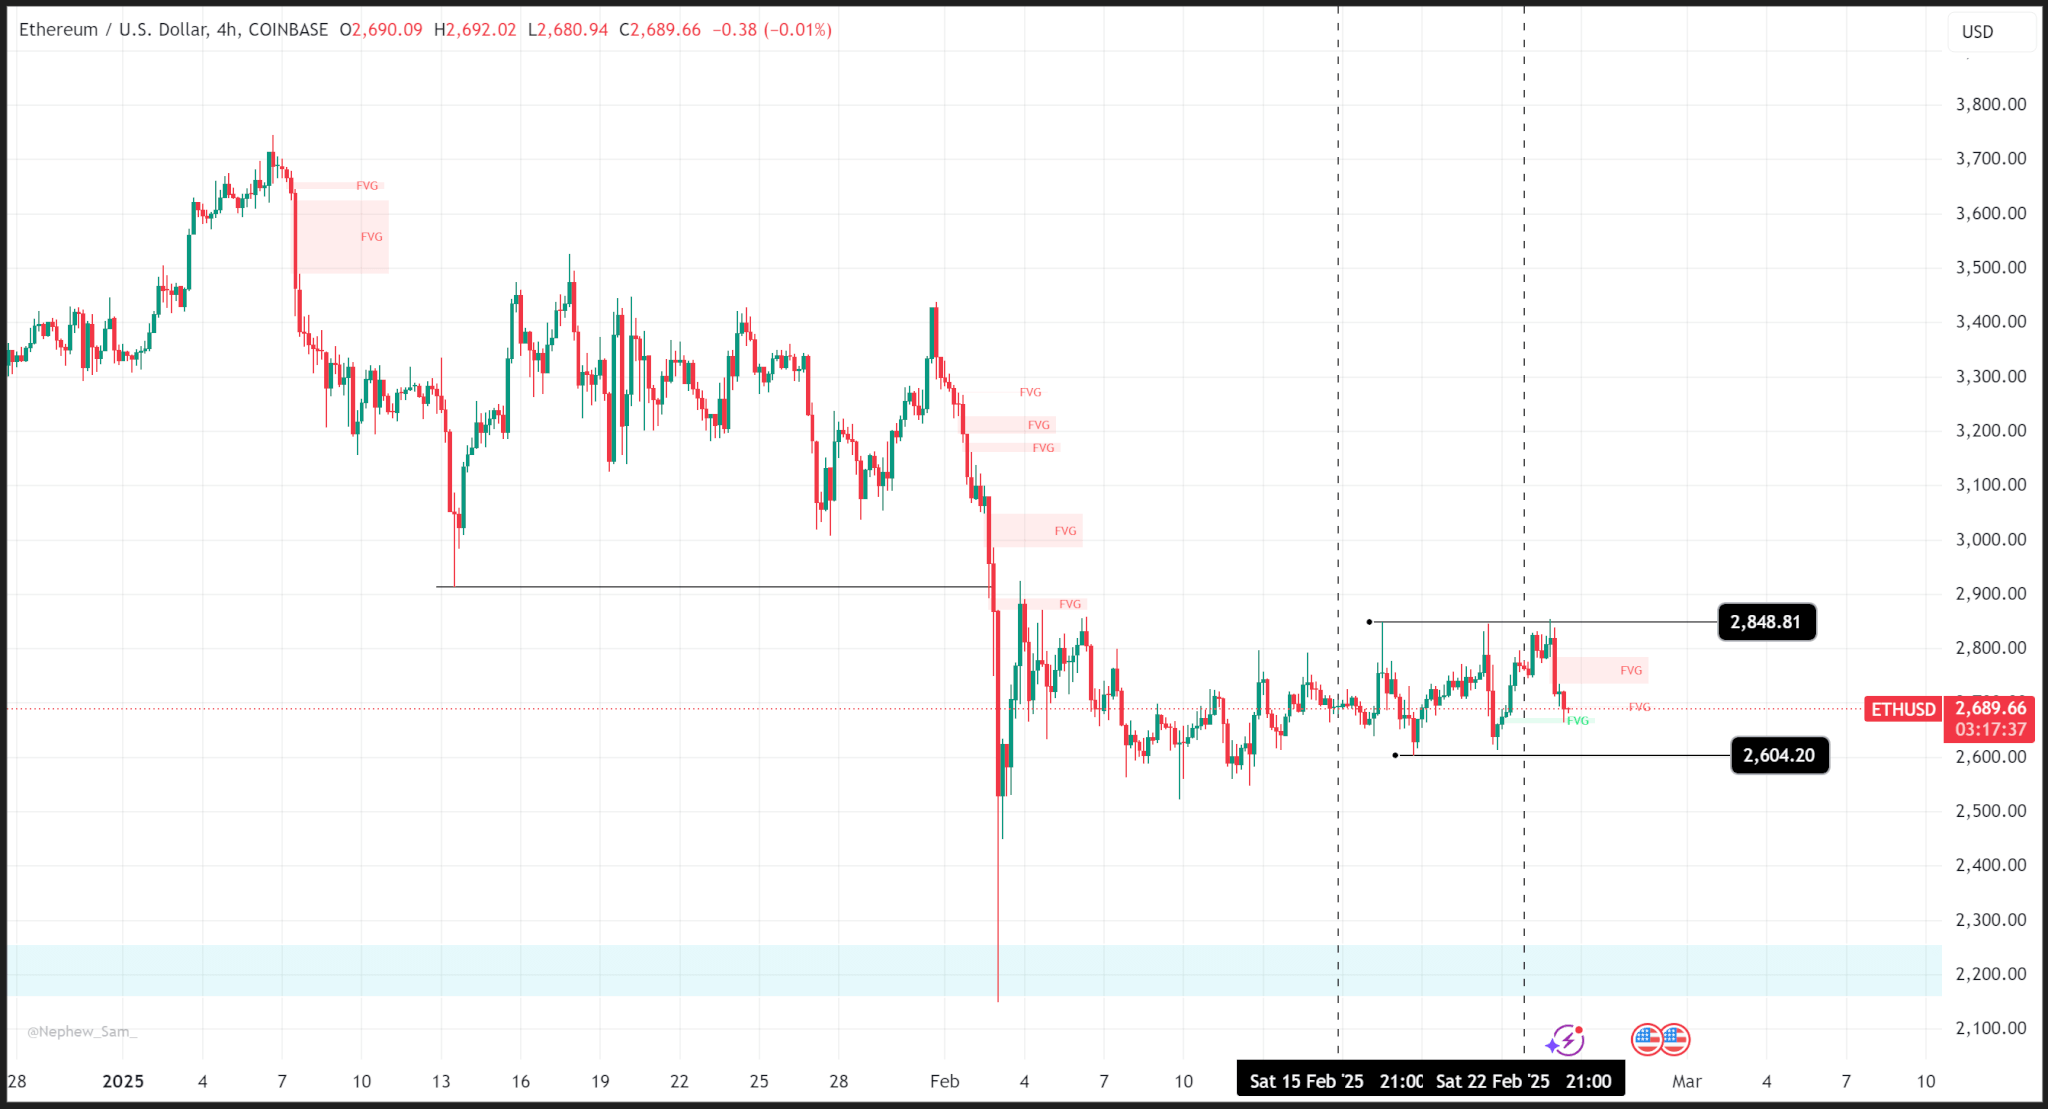
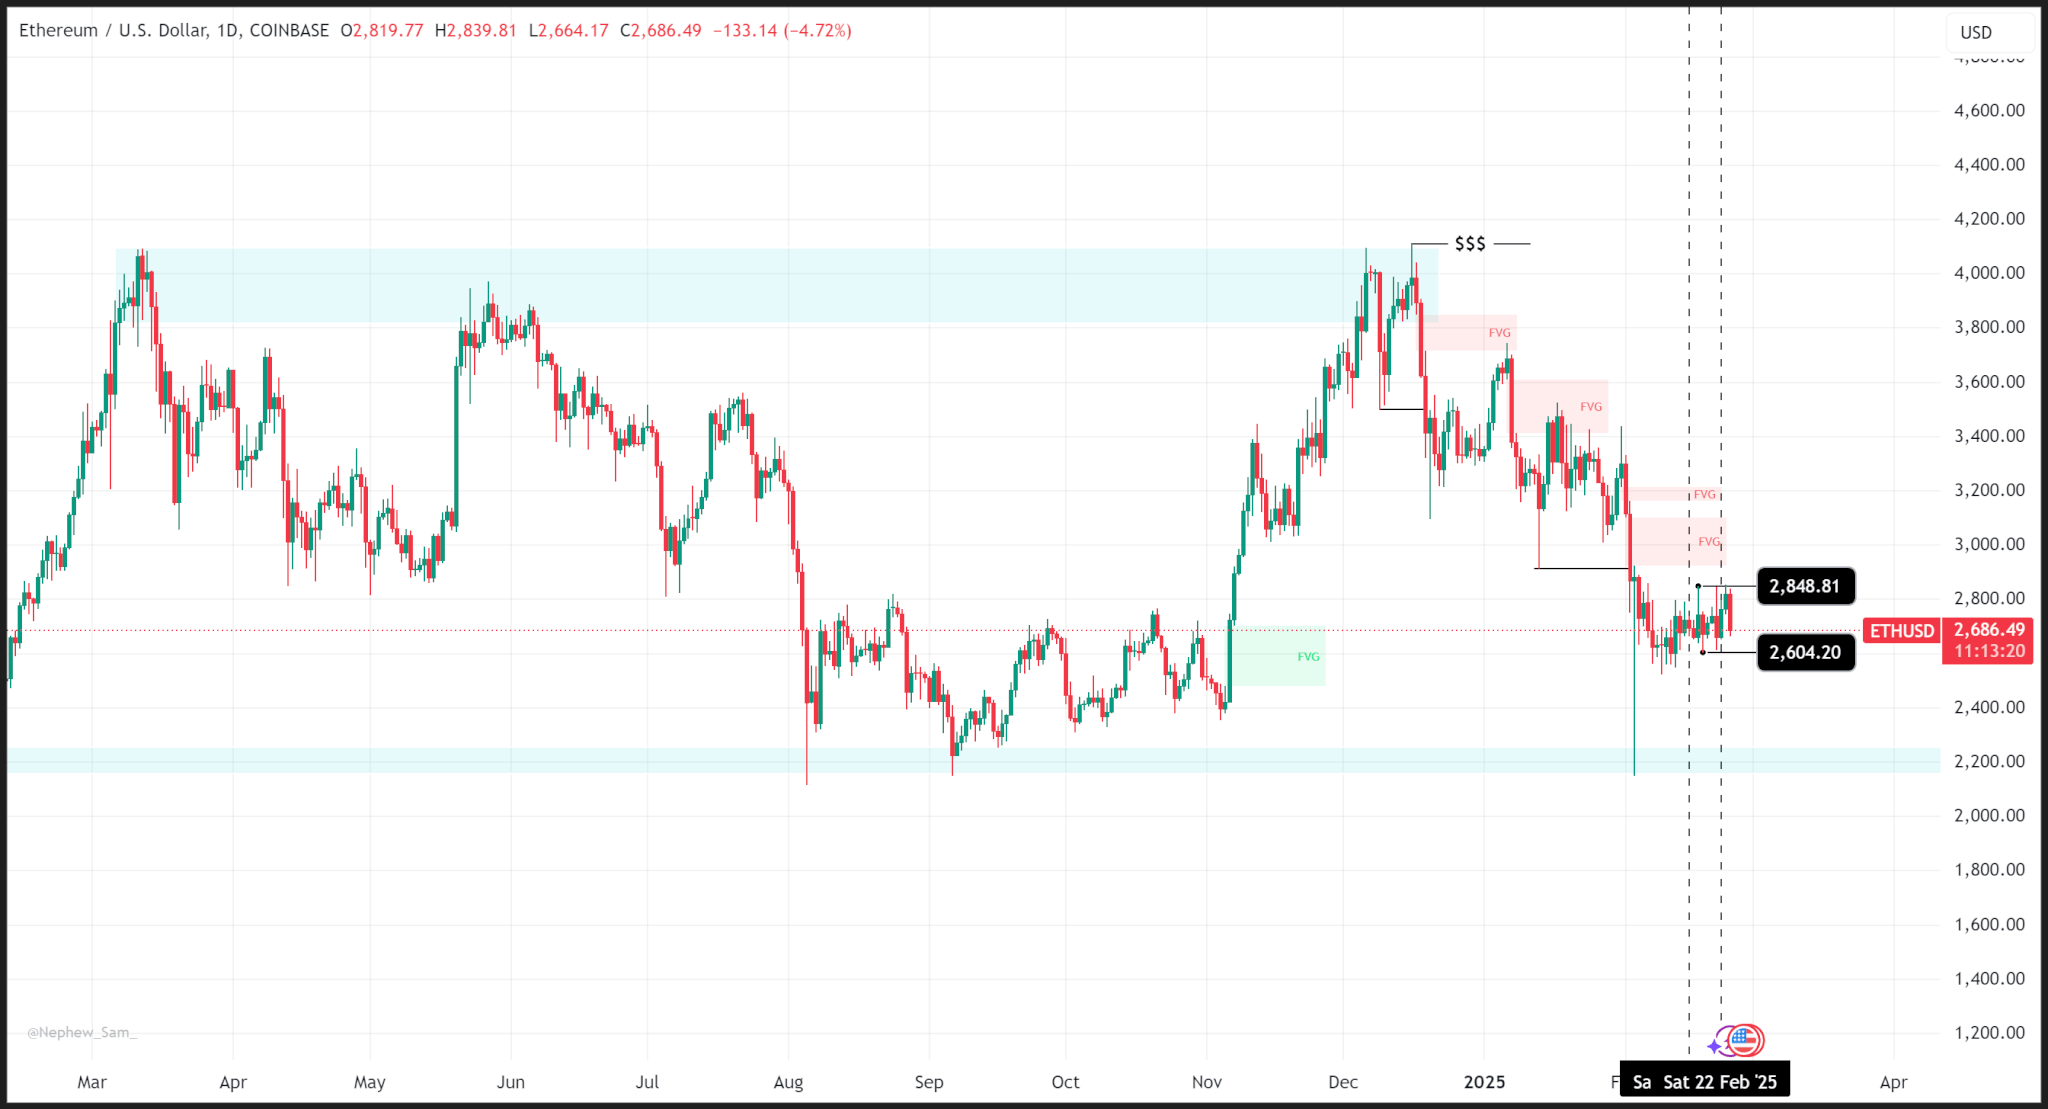
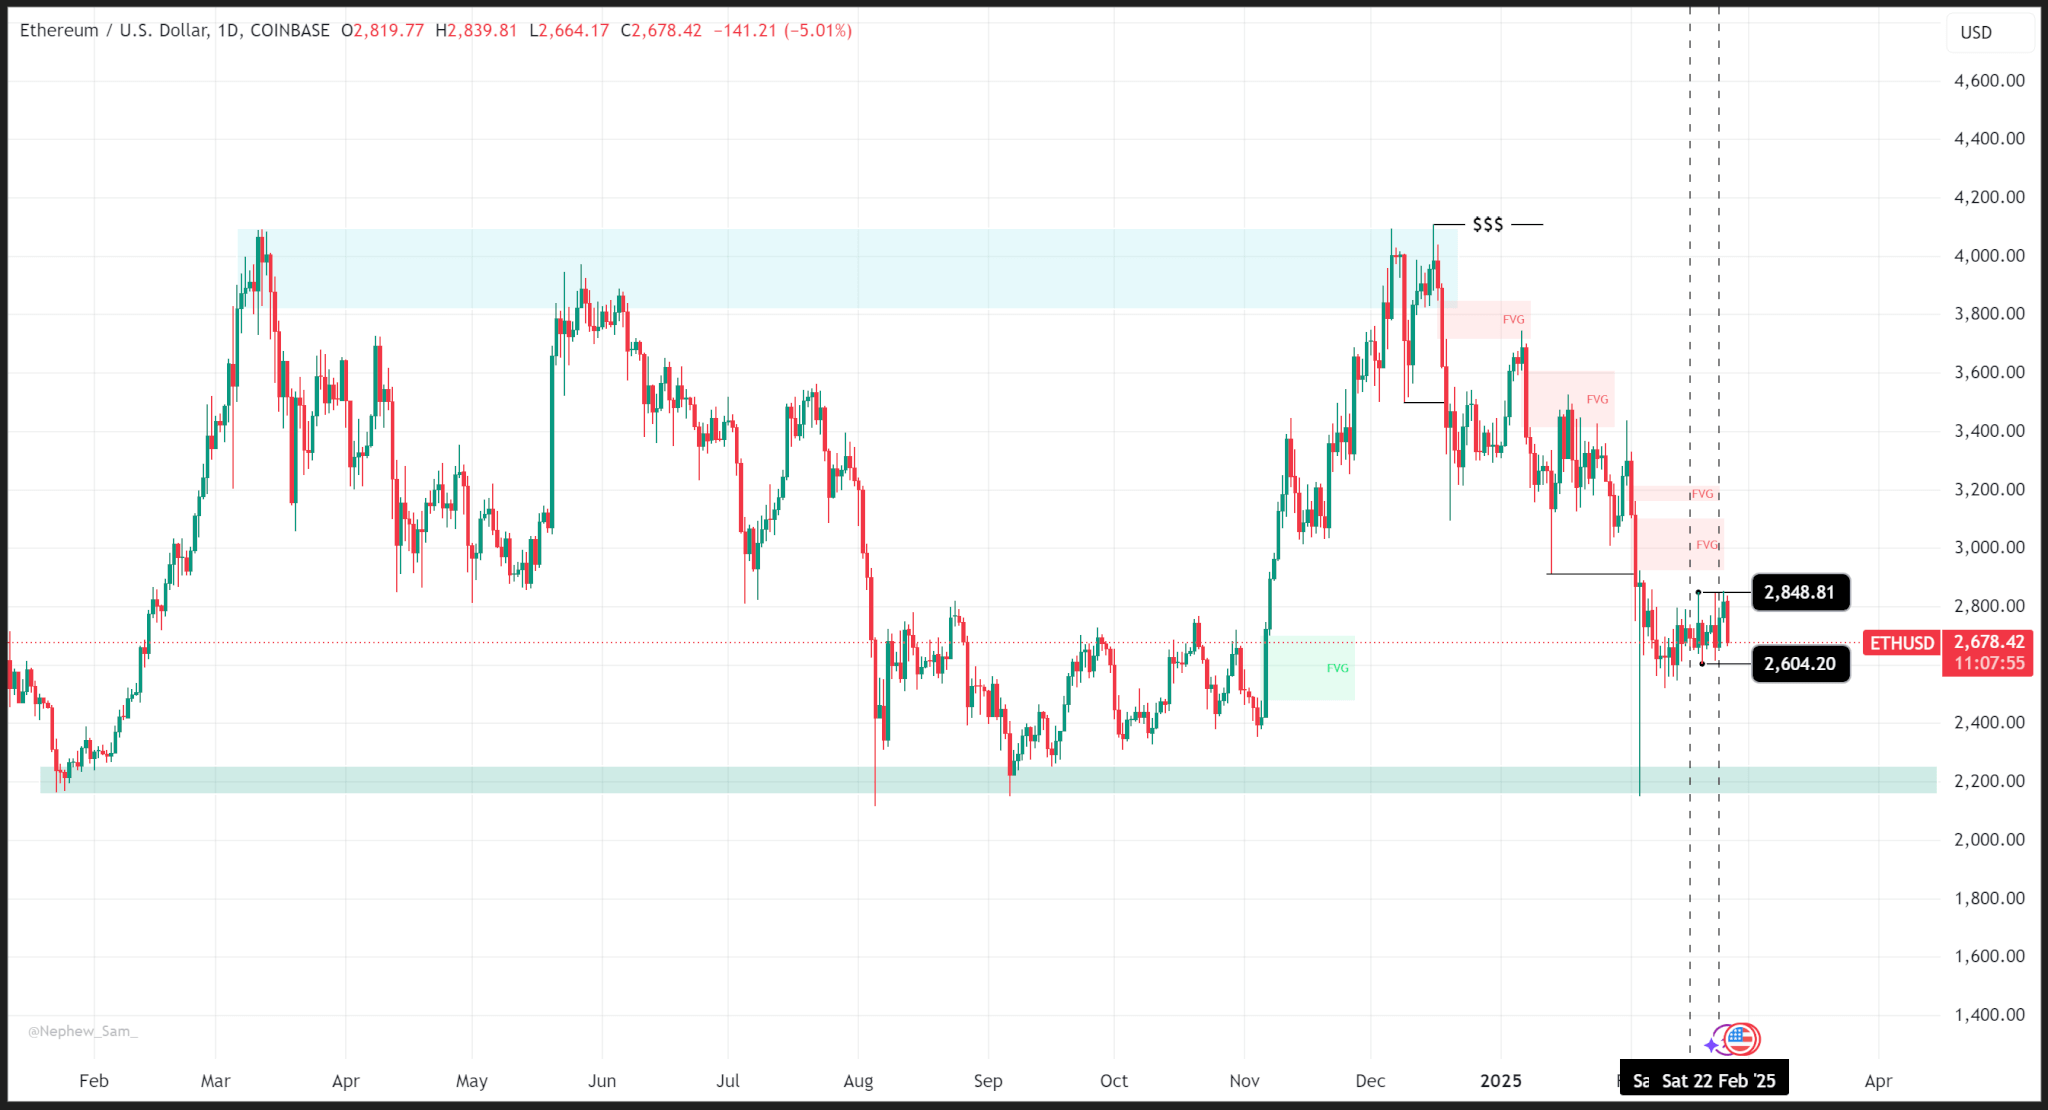
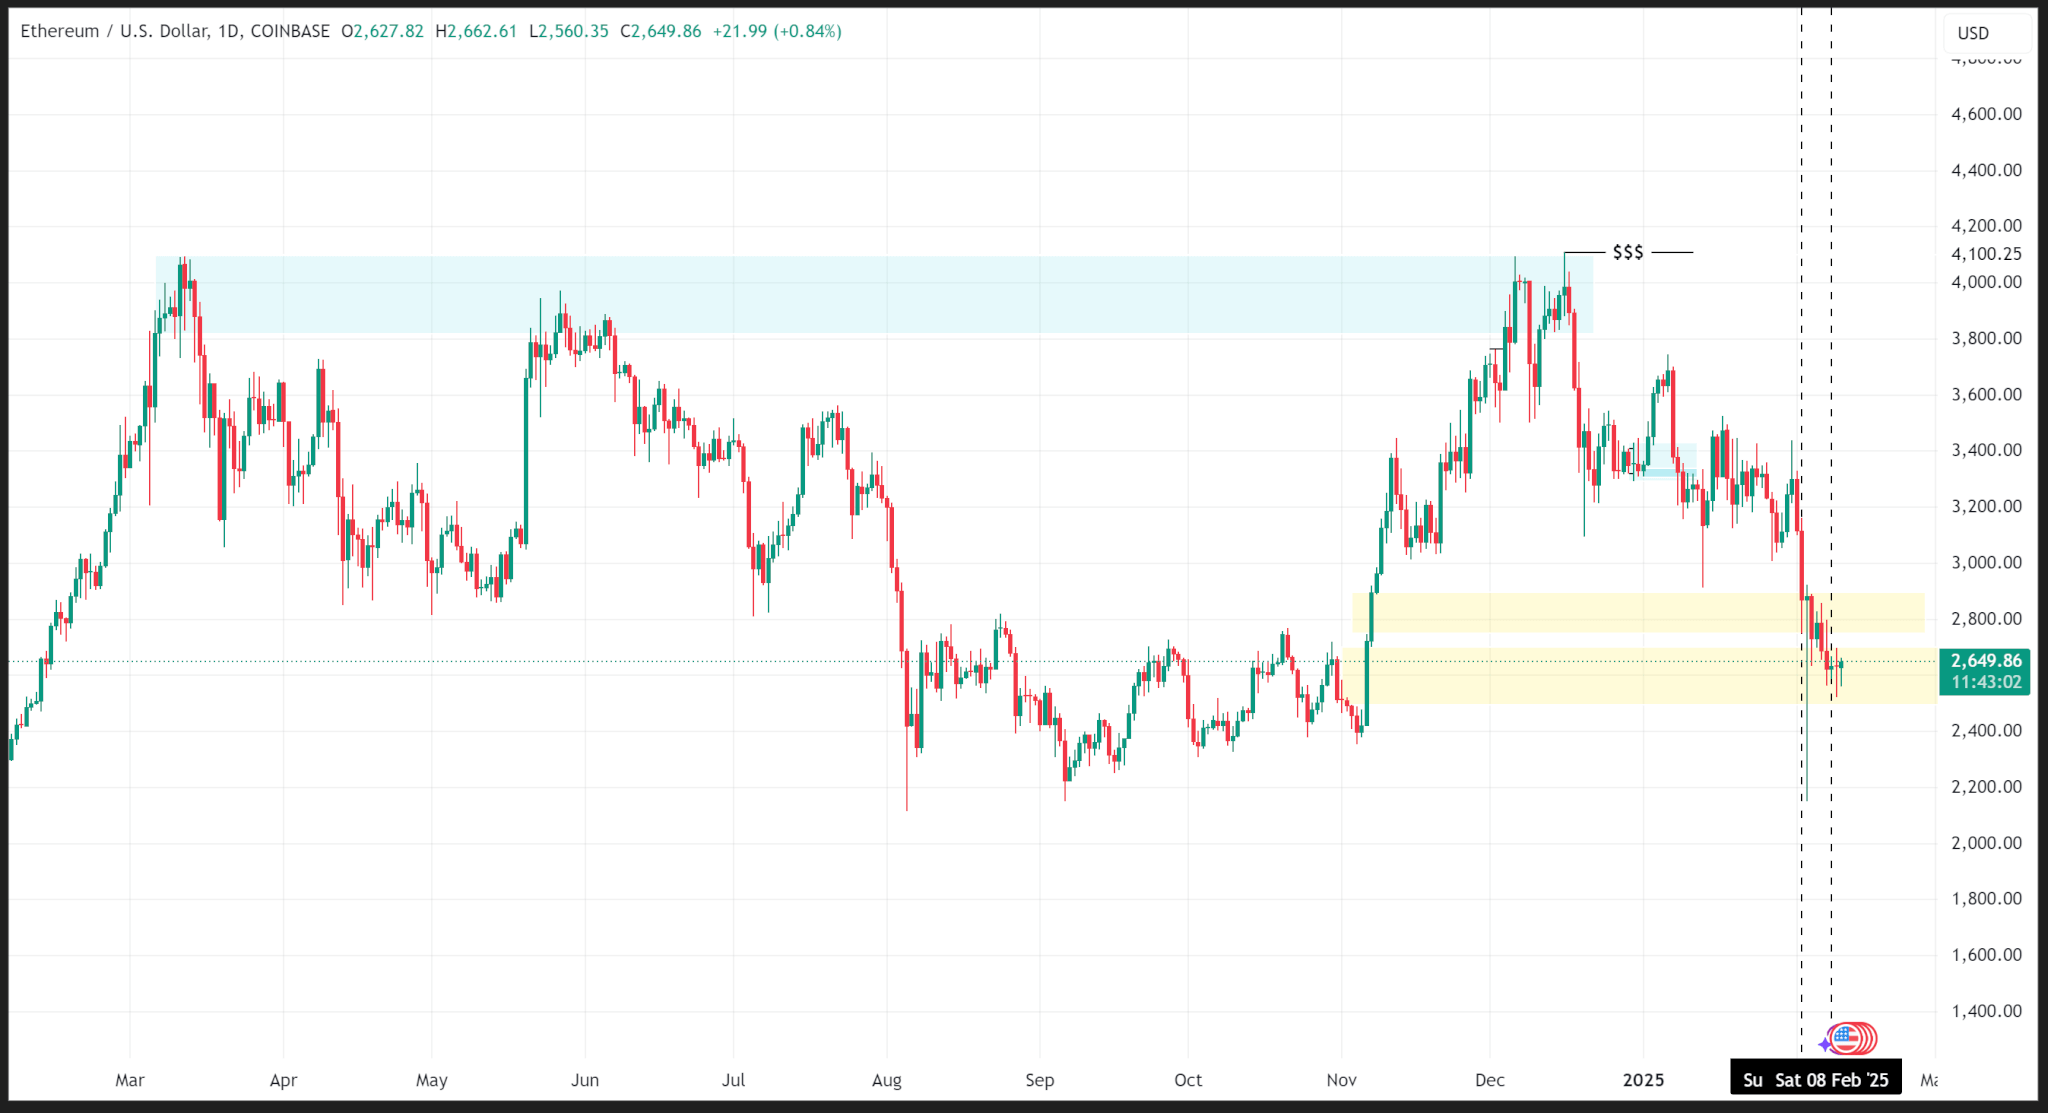
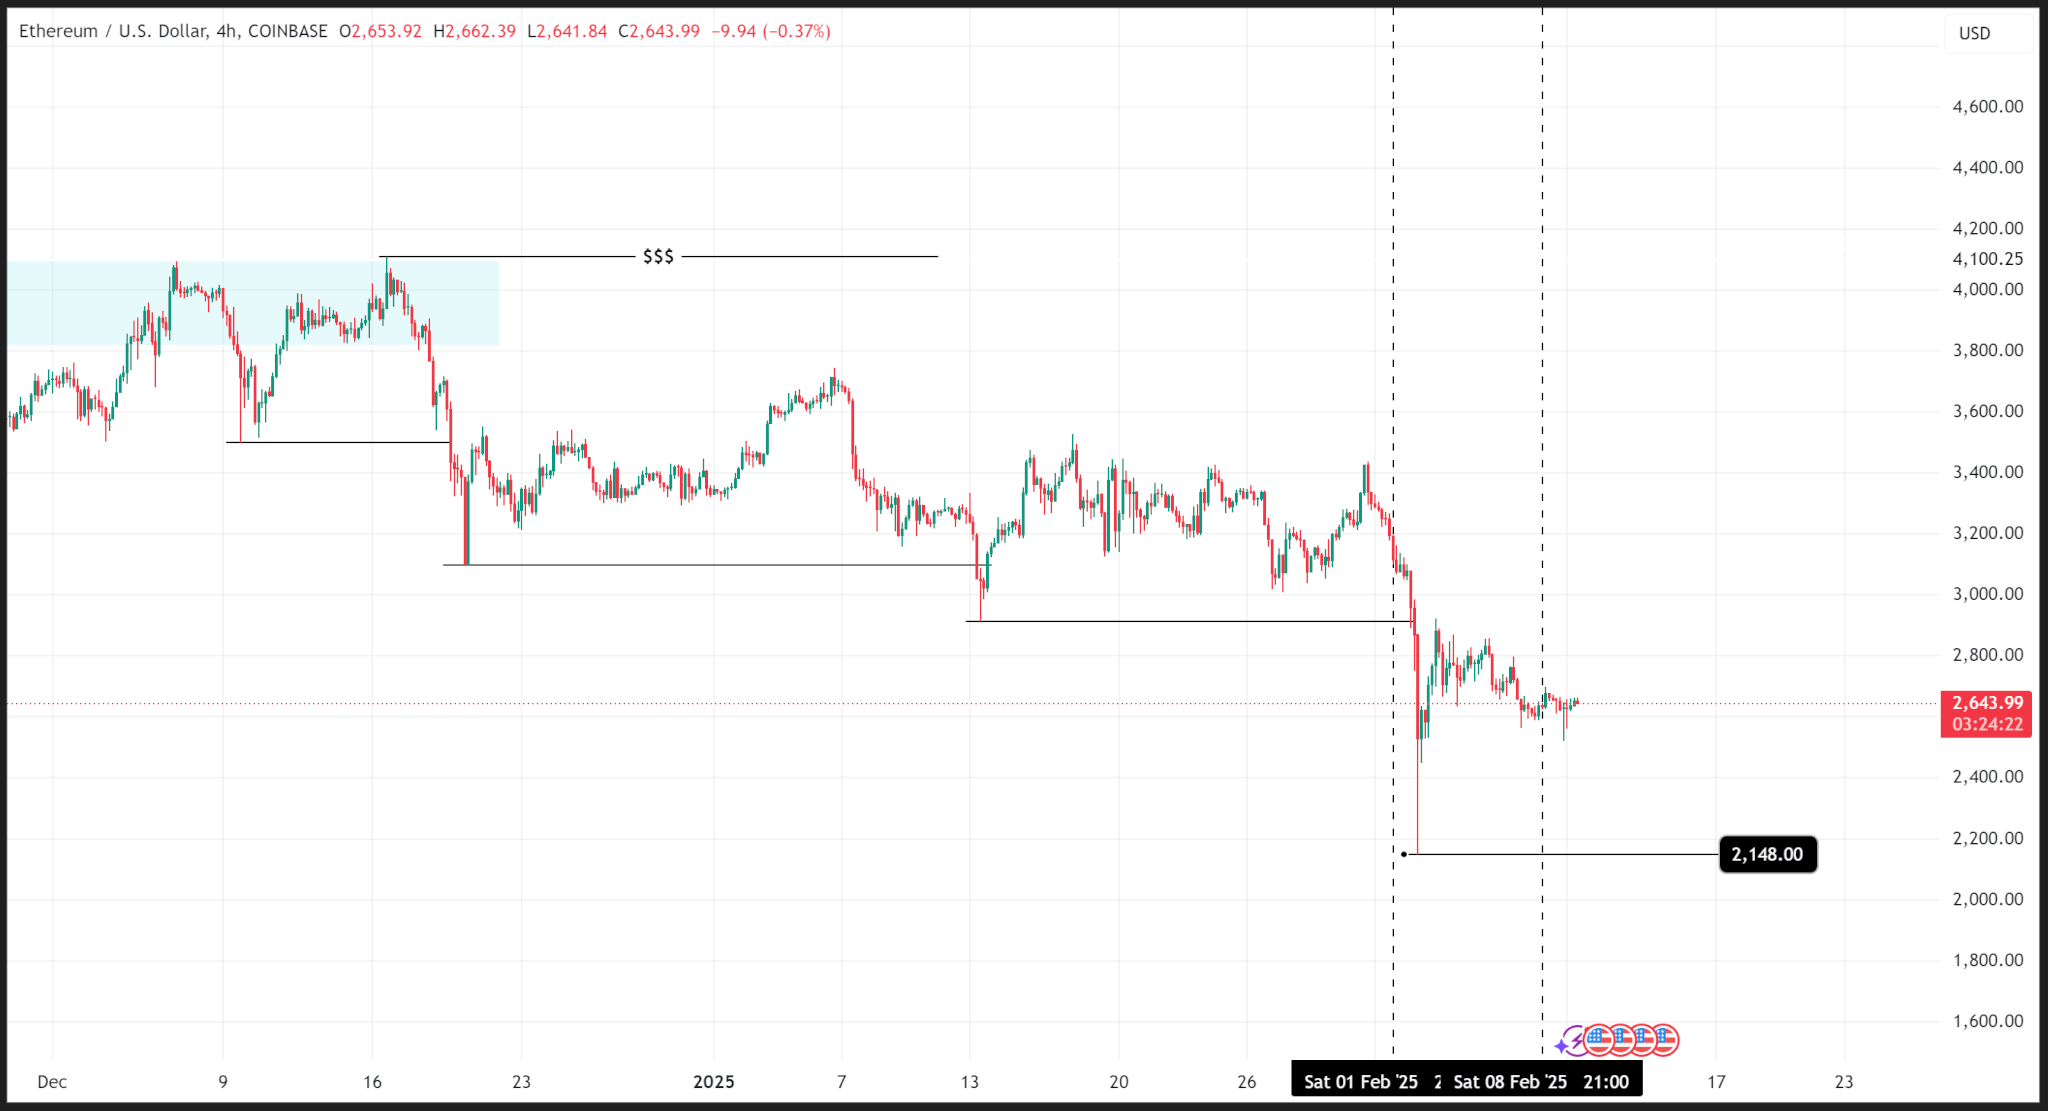
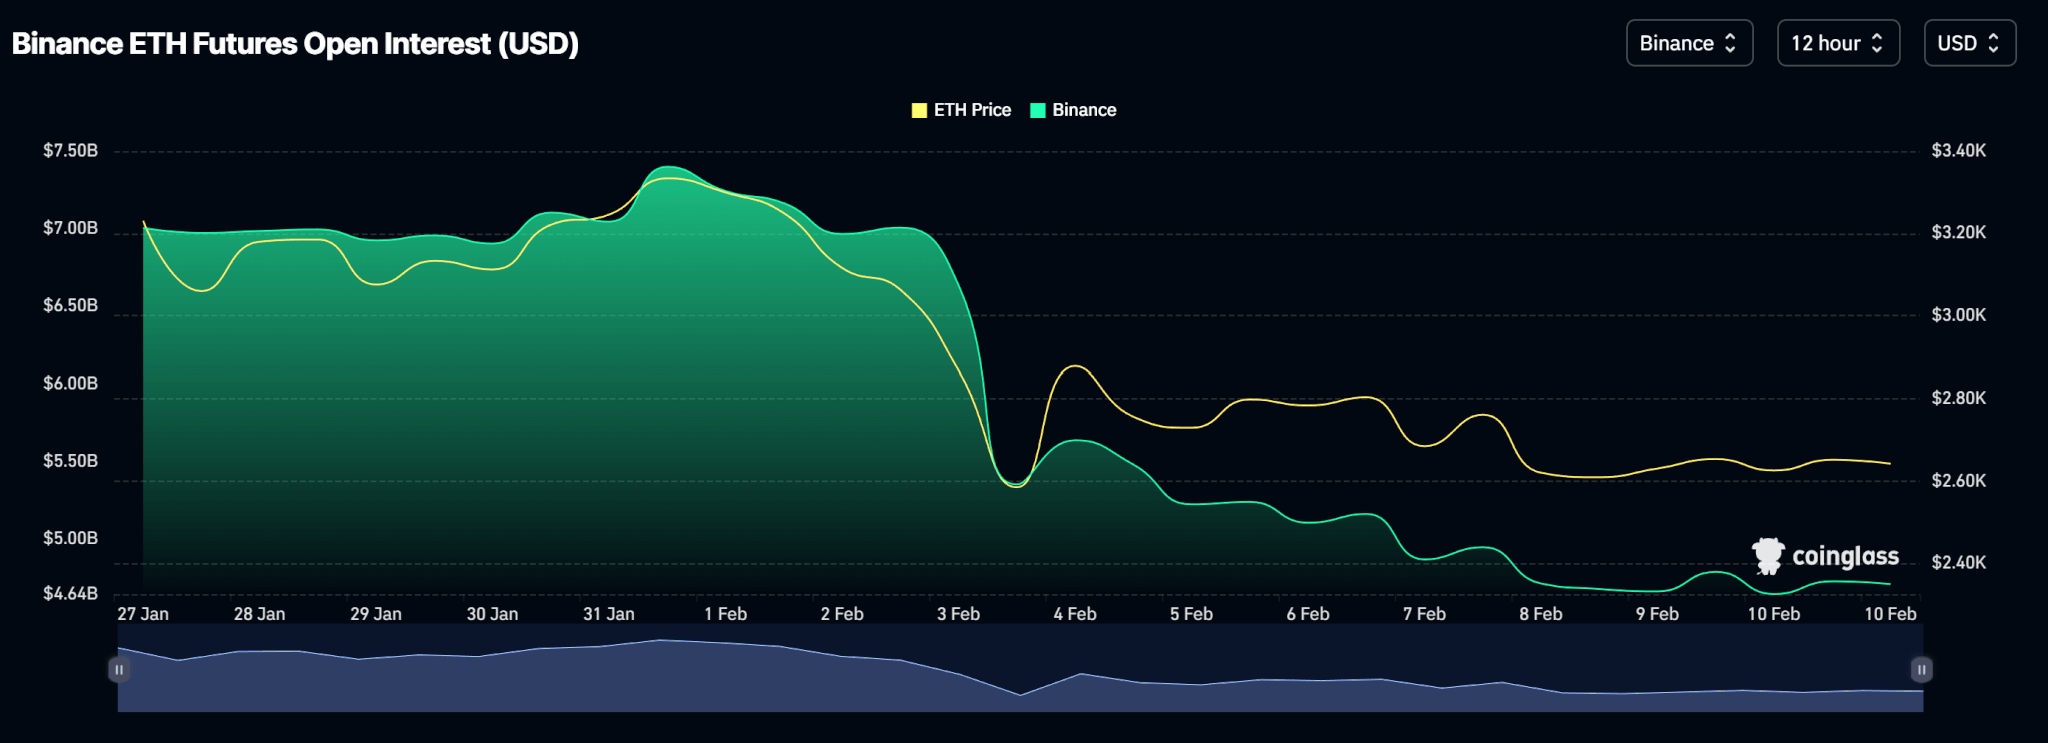
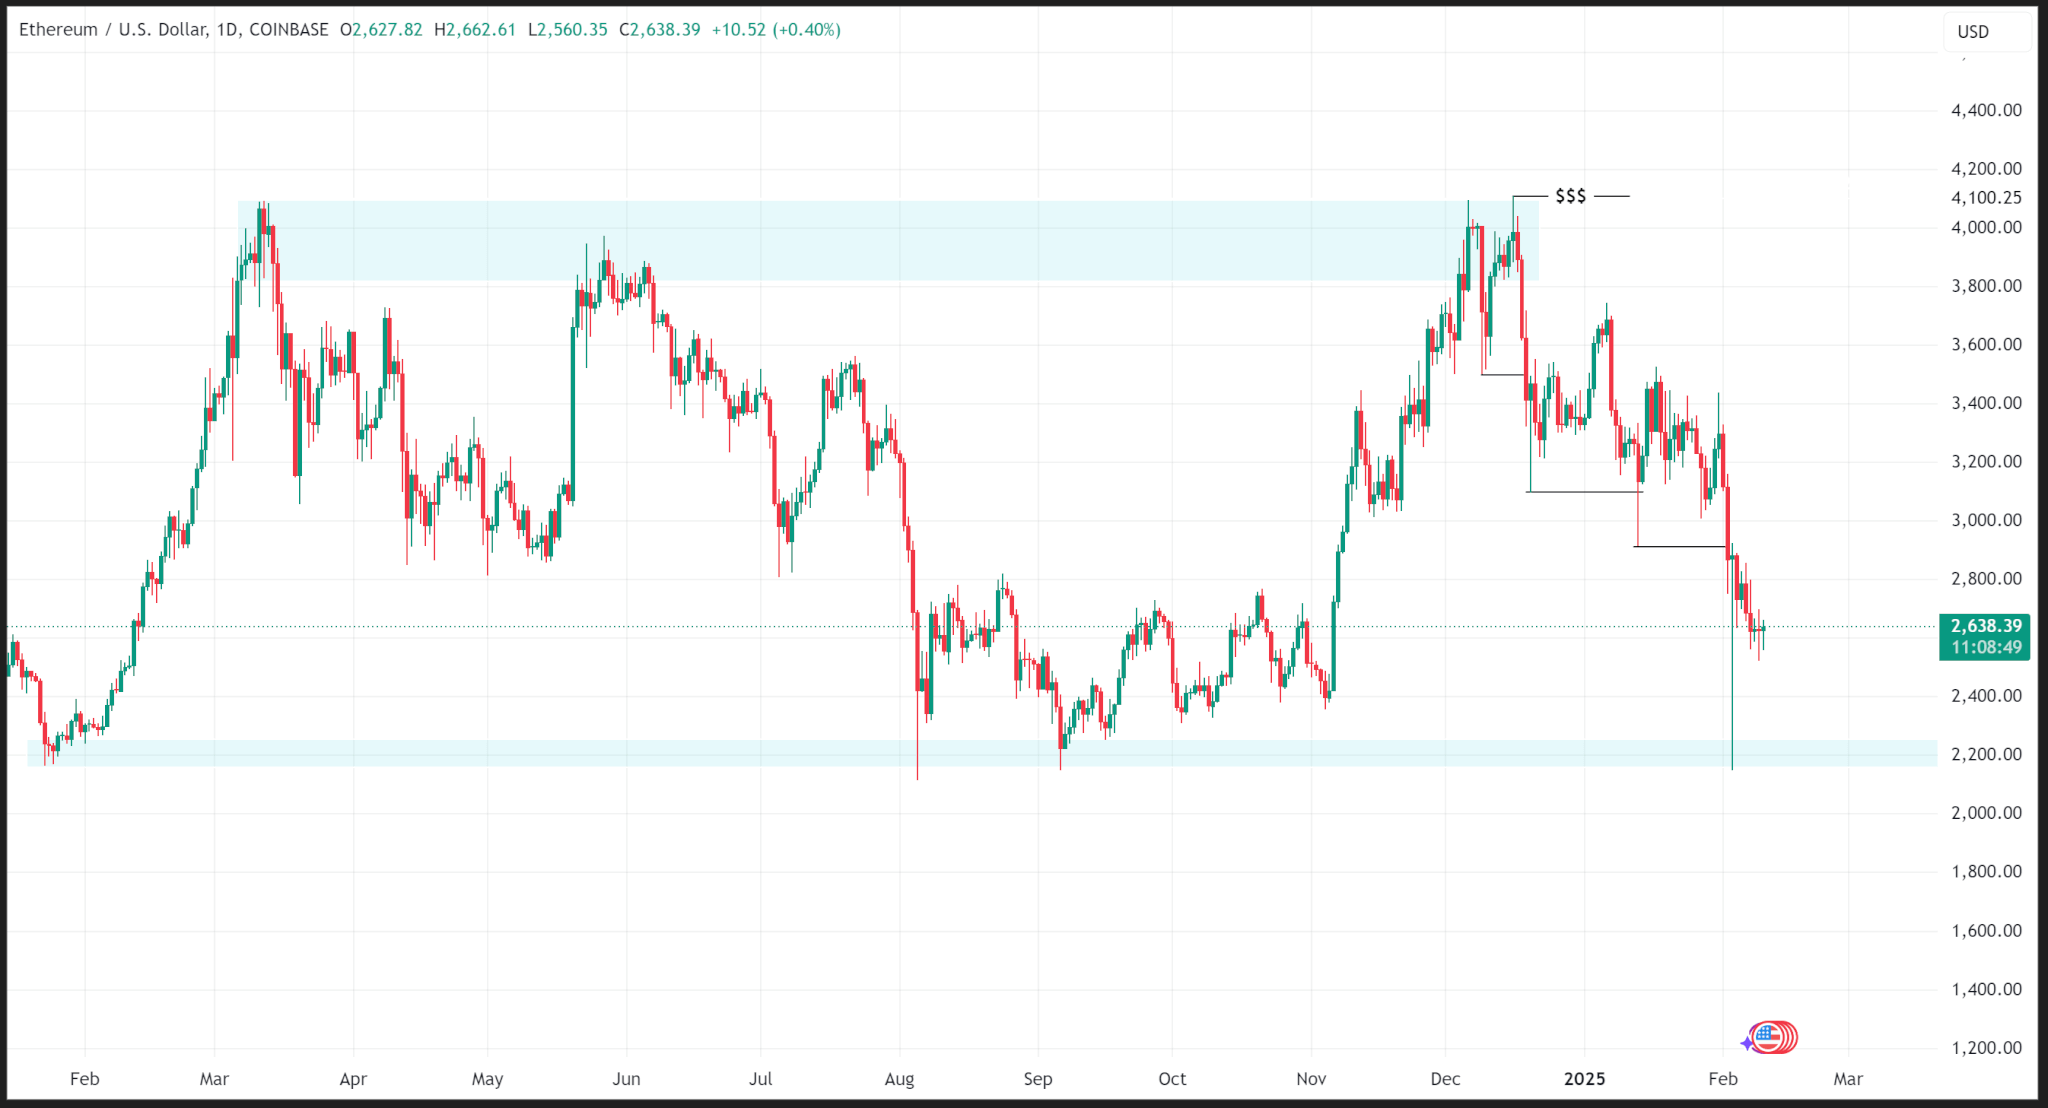
    • ETH: Ethereum rose 1.67% amid volatile trading, swinging nearly 3% between $2,529 and $2,604, as support at $2,530 held firm. Institutional inflows topped $1.1 billion, and above-average volume marked both the surge and subsequent sell-off.

    • Gold: Gold dipped on a stronger dollar but rebounded on tariff-driven safe-haven demand, with central bank buying and de-dollarization fueling forecasts of a rally toward $4,000.

    • S&P 500: Stocks fell on Monday as President Trump announced new tariffs on imports from seven countries, sending the S&P 500 down 0.79% to 6,229.98.

    • Nikkei 225: Asia-Pacific markets mostly rose despite President Trump announcing steep U.S. tariffs on 14 trading partners, with Japan’s Nikkei 225 up 0.36% as duties of up to 40% were outlined for countries including South Korea, Indonesia, and Thailand.

    Source link

  • Weekly price analysis: prices range on uncertain economic outlook

    Weekly price analysis: prices range on uncertain economic outlook

    • Crypto prices traded within a range last week as crypto takes is relegated to the back burner in the wake of economic uncertainties
    • Exchange-traded fund (ETF) inflows were negative as Bitcoin ETFs logged net outflows of $62.9 million while Ethereum ETFs logged $8.9 million in outflows

    Bitcoin

    Bitcoin’s price action continued trading rangebound, with weekly highs and lows of $99,509 and $93,331, as uncertainty looms around inflation, US President Donald Trump’s policies, and geopolitical events.

    Zooming out, we see that price action has ranged at the daily support level for the last three weeks as current market conditions lack sufficient catalyst to push prices to new highs.

    BTC/USD chart by TradingView

    Open interest mimics price action as the week began with a reduction in the volume of open contracts which picked up on Wednesday, February 19, congruent with price action.

    CME BTC Futures Open Interest (USD) chart by Coinglass

    Outlook

    Bitcoin must remain above the daily support of $90,673 to remain in bullish territory. A close below this level on the daily time frame could trigger a fall to the $84,000 level.

    Meanwhile, market sentiment has cooled significantly over the last month and is in neutral territory.

    Bitcoin trades at $87,900 as of publishing.

    Ethereum

    Ethereum’s price action ranged last week logging a weekly high and low of $2,848 and $2,604 despite last week’s news of the Bybit hack.

    ETH/USD chart by TradingView

    Zooming out, we see a bleaker picture as ETH has been trending lower since December 09 after failing to break above its March 2024 high.

    ETH/USD chart by TradingView

    Open interest data shows a steady rise in contract volume throughout the week though price traded rangebound.

    Binance ETH Futures Open Interest (USD) chart by Coinglass

    Outlook

    We reckon the next major support zone for ETH is the $2,500 level which has proven to be a strong liquidity level in the past.

    ETH/USD chart by TradingView

    ETH trades at $2,384 as of publishing.

    Solana

    Like Ethereum, Solana’s price has been declining since it failed to swing higher and form new candles above the last all-time high on the daily time frame.

    SOL/USD chart by TradingView

    Unlike Ethereum, last week’s price action was bearish as the price fell from a weekly open around $194 to a close around $171.

    SOL/USD chart by TradingView

    Open interest charts show topsy-turvy movement in open contract volumes as the price falls.

    Binance SOL Futures Open Interest (USD) chart by Coinglass

    Outlook

    The next major support zone for Solana is at the $129 level. However, we may see smaller rallies as price trends lower overall.

    SOL/USD chart by TradingView

    Source link

  • Weekly price analysis: crypto prices reel from risk off sentiments

    Weekly price analysis: crypto prices reel from risk off sentiments

    • The crypto market trended lower last week as US tariffs rocked the market, causing investors to flee to safe-haven assets like Gold
    • Crypto prices, which recovered slightly on Monday and Tuesday, continued trending downward as uncertainty looms
    • Meanwhile, spot ETF inflows remained positive despite some days of outflows

    Bitcoin

    Bitcoin’s price trended lower over the last week following US President Donald Trump’s announcement of tariffs on Canada, Mexico, and China. Investors fled to safe-haven assets like gold while risky assets, like crypto, trended lower.

    However, the tariffs are a catalyst for faster price declines as price action shows that Bitcoin was already on a decline in its substructure after failing to swing higher than the $108,000 level three weeks ago.

    BTC/USD chart by TradingView

    BTC made two consecutive lower lows on the substructure over the last two weeks and traded into the daily demand zone early last week, logging a weekly low of $91,176.94.

    After buying from the demand zone, the price rose to an internal supply zone at $102,000, validated by the 50% Fibonacci level, and sold off that zone to end the week at $96,475.03.

    BTC/USD chart by TradingView

    On the CME, where Bitcoin Futures are traded the most, open interest fell last week as traders closed contracts due to uncertainty caused by Trump’s tariffs.

    Meanwhile, spot BTC ETFs logged a positive week as net flows printed $208.30 million despite two days of major outflows.

    Price Outlook

    Provided the price remains above the demand zone on the daily timeframe, then Bitcoin’s overall structure should remain bullish despite price declines on the substructure.

    However, a daily close below the demand zone, i.e., below the $90,000 level, may trigger a sell-off to support levels around $84,000 or lower.


    BTC trades at $97,624.73 as of publishing.

    Ethereum

    After failing to break above March 2024 highs, Ethereum’s price has been on a downtrend on its substructure since mid-December 2024.

    On the 4-hour time frame, the price logged consecutive lower lows with the most recent low of $2,148.00 reached early last week. Price has improved since then, closing last week at $2,632.16.

    Open interest on Binance, where Ethereum Futures are traded the most, shows a decline in the number of open contracts, which could be another catalyst for price declines.

    Meanwhile, spot ETH ETFs logged positive inflows on all days last week, aside from Friday when it logged no inflows (or outflows), totalling $420.20Mn for the week.

    Price Outlook

    The next probable zone for ETH’s price to fall is a major support zone around $2,200. With Trump planning to impose a 25% tariff on steel and Aluminum as well as a fresh round of retaliatory tariffs against trade partners, more uncertainty could push ETH’s price there soon.

    ETH trades at $2,640.05 as of publishing.

    Source link

  • Weekly price analysis: prices decline on risk-off sentiments

    Weekly price analysis: prices decline on risk-off sentiments

    • The crypto market trended lower last week, driven largely by risk-off sentiments on newly released Fed meeting notes and economic data
    • The Fed expressed caution around inflation, especially as President-elect Donald Trump’s policies will kick in after his inauguration on January 20
    • Meanwhile, spot crypto exchange-traded funds (ETFs) logged outflows from Wednesday, January 8

    Bitcoin

    Bitcoin’s price logged a negative week falling from a high of $102,733 to a low of $91,188 before eventually closing at $94,547.

    Technical analysis shows a break above the last lower high and a push back down into the H4 demand zone, which means that although the price took a bearish turn, it is still in overall bullish territory.

    BTC/USD Chart by TradingView

    Much of this bearish sentiment is driven by bleak economic expectations. The US Federal Reserve meeting minutes, released on January 8, showed that the reserve bank is cautious about inflation it expects will follow President-elect Donald Trump’s policies.

    As such, the likelihood of continued rate cuts has dwindled, with some analysts seeing an end to cuts early this year. The market’s reaction reflects this updated risk-off sentiment.

    Bitcoin’s open interest chart shows a decline in open contracts between Wednesday and now. Open interest hit a weekly high on Tuesday at $18.16 billion on the CME, fell to a low on Thursday ($16.55 billion), and mellowed out the rest of the week.

    CME BTC Futures Open Interest (USD) Chart by Coinglass

    Meanwhile, spot Bitcoin ETFs logged outflows after the release of the Fed’s meeting minutes on Wednesday. Outflows totalled $718.20 million while inflows totalled $1.03 billion.

    Outlook

    Bitcoin’s price currently hovers around the bottom of the demand zone. If it breaks below, its price could be pushed down to $85,100 where a fair value gap could act as support.

    BTC/USD Chart by TradingView

    BTC trades at $91,622 as of publishing.

    Ethereum

    Ethereum’s price also logged a negative week, falling from a high of $3,744 to a low of $3,157 before closing at $3,236. ETH price action tested March 2024’s high of $4,089  in early December 2024, but failed to break above and has been logging lower lows since.

    ETH/USD Chart by TradingView

    Open interest dropped from a January 7 high of $3.50 billion and continued to decline until it was $2.63 billion as of this publication.

    CME ETH Futures Open Interest (USD) Chart by Coinglass

    Meanwhile, Ethereum spot ETFs logged a weekly net outflow of $186.00 million following risk-off sentiments in the market.

    Outlook

    As Ethereum’s price continues to trend lower, the next technical level that could provide support is the fair value gap at the $2,893 price level.

    ETH trades at $3,071 as of publishing.

    Solana

    Solana’s price fell from a weekly high of $223 to a weekly low of $181 before eventually closing at $188, logging a total loss of 12.53%. SOL continues to trend lower after failing to close above its all-time high of $260.

    Open interest data shows a steep fall from $1.89Bn on Binance on Jan. 7 to $1.58Bn on Jan. 10. As of this publication, OI levels have improved to $1.63Bn.

    Outlook

    The next technical support zone is at the $164 price level. However, although the order block is a support, it is a poor low that could be taken out even if price reverses from that zone.

    SOL trades at $176 as of publishing.

    Ripple

    Ripple’s price fared better last week, closing higher at $2.55 from $2.38 at the start of the week as price continued to log higher highs. Zooming out, the price continues to range between $1.90 and $2.90 as the market cools.

    Open interest rose on Bitget, the exchange with the highest XRP derivative trading volume, over the last week, supporting upward price movement as positive news around Ripple’s case with the SEC boosted sentiments.

    Outlook

    Ripple’s price is buoyed by news around the SEC’s lawsuit against its parent company, a case which could be thrown out with the outgoing administration.

    However, technical analysis shows that XRP trades at a premium and a pullback is expected. The most likely levels are the fair value gap at $1.75 and the order block at $1.46.

    XRP trades at $2.37 as of publishing.

    Source link

  • Bitcoin price analysis: economic headwinds push price lower

    Bitcoin price analysis: economic headwinds push price lower

    • Bitcoin tested the $92,000 level yesterday after falling from a weekly high of $102,000 as sell pressures mounted
    • Macroeconomic factors cause doubts about the market strength as sticky inflation becomes a concern
    • Spot crypto ETFs logged large outflows on Wednesday following the release of the Fed meeting notes

    Bitcoin’s price has fallen from a high of $102,667 reached on Tuesday, January 7 to $94,890.00 as of publishing, but remains within the last H4 demand zone.

    BTC/USD Chart by Trading View

    While the demand zone between $92,000 and $97,000 may be the last support level on the H4 timeframe, a broader market view shows that BTC is in a premium zone on the daily timeframe. As a result, a push below $92,000 still puts the price in bullish territory.

    BTC/USD Chart by TradingView

    The best technical buy levels would either be at the last break of structure on the daily timeframe or at the 50% Fibonacci level from the lowest point to the break.

    BTC/USD Chart by TradingView

    There are two fair value gaps from which the price could react. While they are not major zones, they could support a continuation back to the external high at $108,000 or a brief relief rally before continued sell to the first probable support zone as noted in a recent TradingView analysis of BTC.

    BTC/USD Chart by TradingView

    This is all predicated on Bitcoin breaking below the $91,000 level.

    Meanwhile, spot crypto ETFs recorded outflows on Wednesday, January 9 after the release of the US Federal Reserve’s meeting minutes. These showed that the Fed is cautious about inflation and the effects of Trump’s incoming policies.

    BTC ETFs bled $568.8 million on Wednesday while ETH ETFs lost $159.4 million with the biggest outflows from Fidelity ($258.7 million for BTC and $147.7 million for ETH).

    Source link

  • Jasmy price technical analysis as rebound accelerates

    Jasmy price technical analysis as rebound accelerates

    The Jasmy Coin price rose on Monday, continuing a bullish trend that started in December when it dropped to a low of $0.0028. It jumped to a high of $0.0074, the highest point since September 18. It has jumped by over 152% from its lowest point in December, as we wrote here.

    JASMY/USD daily chart analysis

    The daily chart shows that the JASMY coin price has been in a strong bullish trend in the past few weeks. This recovery has been accompanied by elevated volume levels. At the same time, the coin has managed to move above the important resistance level at $0.0060, the highest point on January 24.

    Jasmy also jumped to the 50% Fibonacci Retracement level. Also, it jumped above the crucial resistance point at $0.0068 (October 30 high). It has also jumped above the 50-day moving average and the Ichimoku cloud indicator. Jasmy, which is known as Japan’s Bitcoinhas also formed an inverted head and shoulders pattern, which is a bullish sign.

    Therefore, it seems like Jasmy has the momentum it needs to continue rising in the coming days. If this happens, the next key resistance level to watch will be at $0.0086, the 61.8% Fibonacci Retracement point. This price is about 27% above the current level.

    On the flip side, a drop below the important support level at $0.0060 will invalidate the bullish view. If this happens, it will signal that there are still sellers left in the market who will be keen to push it to the next key support level at $0.0050.

    Jasmy price 4H chart analysis

    On the 4H chart, we see that the Jasmy Coin price has made a spectacular comeback in the past feww weeks. As it rose, the token crossed the key resistance level at $0.0060, where it struggled to move above on January 24 and February 2. The coin is also above the 25-day and 50-day EMAs.

    At the same time, a closer look shows that volume bars have started to drop. Therefore, this could be a sign that the bullish trend is fading, which could see it retreat in the coming days. But on a positive side, the coin has formed a small hammer pattern, which is a bullish sign. 

    A reversal will be confirmed if JasmyCoin price plunges below the lower side of the hammer at $0.0065.

    JASMY/USD chart by TradingView

    Source link

  • Shiba Inu Price Analysis (SHIB)

    Shiba Inu Price Analysis (SHIB)

    Bitcoin Analysis 

    Bitcoin’s price is experiencing its lowest level of volatility since 2012 and bullish traders defended the $19k level for the 41st consecutive day on Monday. Despite holding $19k, when traders settled-up at 12:00 AM UTC, BTC’s price was -$239.8 for the day. 

    We’re starting our price analyses today with the BTC/USD 1W chart below from ft-73. BTC’s price is trading between the 0 fibonacci level [$17,664.04] and the 0.382 fib level [$37,230.34], at the time of writing. 

    Bullish traders need to do more than just stall bearish momentum and they firstly need to regain BTC’s 2017 ATH [$19,891] with a second target of eclipsing the asset’s 200WMA [$23,719]. 

    Above those targets are the typical fib level aims of 0.382, 0.5 [$43,296.39], 0.618 [$49,362.44], 0.786 [$57,998.85] and the 1 fib level [$69,000] on the BITSTAMP chart. 

    From the perspective of bearish traders, they’re looking to again send BTC’s price below the 0 fib level which will mark a fresh 2022 and 12-month low for the asset.

    BTC/USD 1W chart
    BTC/USD 1W chart: the price is trading between the 0 fibonacci level [$17,664.04] and the 0.382 fib level [$37,230.34]

    Traders can see just how low the volatility is on the chart below from Babenski.

    index
    Chart with volatility index

    The Fear and Greed Index is 20 Extreme Fear and is -2 from Monday’s reading of 22 Extreme Fear.

    Fear and Greed
    The Fear and Greed Index is 20 Extreme Fear

    Bitcoin’s Moving Averages: 5-Day [$19,231.25], 20-Day [$19,438.56], 50-Day [$20,069.44], 100-Day [$21,267.31], 200-Day [$29,911.07], Year to Date [$30,612.38].

    BTC’s 24 hour price range is $19,157-$19,601.2 and its 7 day price range is $18,788.33-$19,660.63. Bitcoin’s 52 week price range is $17,611-$69,044. 

    The price of Bitcoin on this date last year was $63,100. 

    The average price of BTC for the last 30 days is $19,335.8 and its -0.2% over the same stretch. 

    Bitcoin’s price [-1.23%] closed its daily candle on Monday worth $19,331.4 and in red figures for the first time in four days. 

    Ethereum Analysis 

    Ether’s price was also sent lower on Monday and ETH finished the day -$20.31.  

    The ETH/USD 1D chart by EdgarTigranyan is the second chart we’re focusing on this Tuesday. ETH’s price is trading between the 100.00% fib level [$1,217.87] and 78.60% [$1,341.25], at the time of writing. 

    If bullish traders can regain the 78.60% fib level their targets are as follows, 65.00% [$1,419.67] 61.80% [$1,438.12], 50.00% [$1,506.15], 38.20% [$1,574.18], 23.60% [$1,658.36], and a full retracement at 0.00% [$1,794.43].

    Bearish Ether traders are conversely trying to continue ETH’s downtrend that began during the week leading up to The Merge. The targets to the downside for bears are the 100.00% fibonacci level followed by the 161.80% fib level [$861.56].

    ETH/USD 1D chart
    ETH/USD 1D chart: the price is trading between the 100.00% fib level [$1,217.87] and 78.60% [$1,341.25]

    Ether’s Moving Averages: 5-Day [$1,308.50], 20-Day [$1,321.38], 50-Day [$1,475.22], 100-Day [$1,444.33], 200-Day [$2,077.12], Year to Date [$2,145.14].

    ETH’s 24 hour price range is $1,324.17-$1,370.6 and its 7 day price range is $1,264.48-$1,370.6. Ether’s 52 week price range is $883.62-$4,878. 

    The price of ETH on this date in 2021 was $4,220.35. 

    The average price of ETH for the last 30 days is $1,316.22 and its +1.73% over the same interval. 

    Ether’s price [-1.49%] closed its daily candle on Monday worth $1,343.88 and in red digits also for the first time in four daily candle closes. 

    Shiba Inu Analysis

    Shiba Inu’s price followed the macro market cap low on Monday and when SHIB’s daily candle was printed it was -$0.0000024.

    The final chart we’re looking at today is the SHIB/USDT 4HR chart below from abanefsobulls. Shib’s price is trading between the 0.236 fib level [$0.000009884] and 0.382 [$0.00001021], at the time of writing. 

    The overhead targets for bullish SHIB traders are 0.382, 0.5 [$0.00001051], and 0.618 [$0.00001081]. 

    Bearish SHIB traders that are still short the asset want to push SHIB’s price below the 0.236 fibonacci level followed by a target of a full retracement back at 0 [$0.00000924]. 

    SHIB/USDT 4HR chart
    SHIB/USDT 4HR chart: the price is trading between the 0.236 fib level [$0.000009884] and 0.382 [$0.00001021]

    Shib’s 24 hour price range is $0.00000984-0.00001019 and its 7 day price range is $0.00000974 / $0.00001045. Shiba Inu’s 52 week price range is $0.00000716-$0.0000884. 

    Shib’s price on this date last year was $0.00003599. 

    The average price of SHIB over the last 30 days is $0.00001068 and its -8.2% over the same duration. 

    Shiba Inu’s price [-2.36%] closed its daily session on Monday worth $0.00000992 and in red digits for the second time over the last three days. 


    Source link

  • Analysis of Monero, Shiba Inu, Dogecoin and CRO

    Analysis of Monero, Shiba Inu, Dogecoin and CRO

    Some of the most interesting cryptocurrencies to follow are Monero, Shiba Inu, Dogecoin and CRO. However, analysis of their prices reveals that there are significant differences. 

    Monero (XMR)

    XMR, the cryptocurrency native to the Monero blockchain, did not have a particularly exciting 2021. 

    In fact, the maximum price reached did not exceed the all-time high reached during the previous cycle, in January 2018. 

    The fact is that in 2021 many cryptocurrencies made new highs, including Bitcoin and Ethereum. Monero, however, failed to do so. 

    On 9 January 2018, when ETH first surpassed $1,400, XMR briefly topped $540. By contrast, in 2021 the peak stopped at $475, failing to even approach $500. It is enough to mention that instead, ETH exceeded $4,800

    Thus, during 2021 ETH posted a new peak as much as 240% higher than that of the previous cycle, while that of Monero was 12% lower. 

    Despite this, however, XMR’s price is currently “only” 73% below its all-time high, which is a very similar percentage to ETH’s -72%. 

    Hence, although in 2021 Monero failed to keep up with the pace had by, for example, Ethereum, in 2022 it has practically recovered and stabilized on similar performance. 

    The curious thing, then, is that in this bear market Monero has lost less than Ethereum, and if only 2022 is taken into account, it shows that XMR has lost only 37%, while ETH as much as 64%. 

    Using Ethereum as a benchmark for all other altcoins we can say that Monero has been found to be more stable and less volatile, in recent years, with lower growth but also lower losses. It is as if a lower speculative bubble has inflated on XMR, not only compared to that of Ethereum but also compared to what also inflated on XMR in late 2017. 

    There could be an explanation: XMR is the most widely used high-privacy cryptocurrency on record, so it has a fairly constant use over time that probably limits its price fluctuations

    Shiba Inu (SHIB)

    In the previous cycle that began in May 2020 with the third halving of Bitcoin, Shiba Inu did not yet exist. 

    But during 2021, the price performance of the SHIB token was almost absurd. 

    Born in August 2020, until April 2021 its value was practically irrelevant. Then suddenly it experienced an incredible boom, most likely linked in some way to a simultaneous boom in Dogecoin. 

    Then again, Shiba Inu is intended to be precisely an alternate to Dogecoin. 

    However, during the course of 2021, SHIB’s share price increased significantly only four very short times. 

    The first was between 31 January and 1 February, when it jumped in just two days from 0.14 billionths of a dollar to 2.9 billionths. 

    The second was between 16 and 20 April, when it jumped in four days from $0.16 millionths to $3.6 millionths.

    The third between 8 and 11 May when it soared in just three days from 1.5 millionths to 35 millionths. 

    Finally, the fourth and final time between 5 and 28 October when in just over three weeks it rose from $8.5 millionths to 82 millionths. 

    In the remaining periods, it has only ever either lateralized or gone down. 

    It is worth noting that the April and May jumps were concomitant with Dogecoin’s, but the October one was not. That is, since June the price of SHIB has started to move independently from the price of DOGE. 

    Currently, it is as much as 88% lower than it was at the end of October, and this indicates very clearly that the one in 2021 was a speculative bubble. The fact that it was due to only four very rapid big jumps makes it clear that, unlike XMR, it does not have a solid user base.

    Dogecoin (DOGE)

    The price analysis of Dogecoin may be reminiscent of that of Shiba Inu, although Dogecoin is a much “older” cryptocurrency. 

    As a matter of fact, we have prices since 2013, although until 2021 they had not been particularly attractive. It is enough to mention that the highest price touched during the previous cycle was on 7 January 2018 when it touched $0.018 while last year’s peak was an impressive $0.73. In other words, the new peak was almost 4,000% higher than the previous one. 

    The year 2021 was truly the year of so-called “meme-coins,” indeed Dogecoin and Shiba Inu. 

    The incredible rise in the price of DOGE, however, occurred in only two specific periods. 

    The first, between 27 January and 11 February, took the price from $0.007 to almost $0.080, that is, with a tenfold increase in less than two weeks that was followed by a small reversal. 

    The second occurred between 12 April and 8 May, with a rise from $0.07 to $0.73, or another tenfold increase in about four weeks. 

    These two strong and rapid increases also brought with them the price of Shiba Inu, although then after 8 May 2021 the price of DOGE almost always fell, except at certain times. 

    DOGE currently loses nearly 92% from its peak, which says a lot about how large the speculative bubble that swelled last year on this asset has been. 

    Cronos (CRO)

    Cronos (CRO) is Crypto.com‘s cryptocurrency

    Although it suffered a speculative bubble last year similar to that of other cryptocurrencies, its value has maintained some stability over time. 

    For example, the current price of about $0.1 is very similar to the price in March 2019, which was almost two years before the speculative bubble inflated. 

    Indeed, until early February 2021, the value of CRO had almost always hovered around $0.1, which therefore appears to be a fairly common price level for this asset. 

    Were it not for the 2021 bubble, the price of CRO has never exceeded $0.2, and has never fallen below $0.02 since it rose to $0.1 in March 2019. 

    The 2021 anomaly for the price of CRO began on 19 February, when it came close to $0.26 in less than a month. 

    It is worth noting that CRO’s price rises are less rapid and less broad than those of meme-coins, thus denoting decidedly different behavior. 

    The real boom occurred between 2 and 24 November, when it rose from $0.21 to an all-time high of $0.96. 

    Incidentally, that was the same period when Bitcoin and Ethereum made new highs. 

    Since then CRO has lost as much as 89%, but its value is back near that $0.1 level that seems to be a kind of “standard” for this cryptocurrency. 

    In short, this is a cryptocurrency with lower volatility on average, partly because it has a large exchange behind it, but it has suffered at least one large abnormal overhang due to the great cryptocurrency speculative bubble of 2021. 


    Source link

  • Oversold RSI Could push Decentraland (MANA) up significantly in the near term

    Oversold RSI Could push Decentraland (MANA) up significantly in the near term

    The last 7 days have been bitter-sweet for Decentraland (MANA). After initially falling, the coin has started to gain some upward momentum albeit it hasn’t been that much. But an RSI reading suggests that a potential bull run is possible. Here are the main facts:

    • RSI readings show MANA is now oversold, suggesting the risk of a major sell-off is low.

    • With limited downside risk, MANA could bounce back steadily in the near term.

    • The coin could surge by 50% in this bullish setup.

    Data Source: Tradingview 

    How can MANA smash $3?

    The recent uptick in bullish momentum has not been that huge. But it has been enough to bring MANA above a crucial support zone of around $2. Bulls have done quite well to keep the price action above this. As the price consolidates, we expect it to push further towards the overhead resistance of $2.3. 

    The Relative Strength Index or RSI appears to suggest that this is actually more likely. You see, in recent days, RSI readings have moved towards the oversold territory. This basically suggests that the risk of any major sell-off as far as MANA goes is very low. 

    As a result, the only way is up. If indeed MANA is able to breach overhead resistance at $2.3, then it is a matter of time before it reaches $3. The biggest challenge however will be to maintain the price action above $3.

    How can investors profit from this bullish setup?

    There are two ways to profit from this MANA bullish setup. First, you can buy above the $2 support. As the token tests $2.3, you can either exit or bet on it, hitting $3. Either way, a run towards $2.3 still makes you 15%.

    Secondly, you can wait for the coin to breach overhead resistance at $2.3. MANA will likely surge to $3 after that, delivering gains of around 25%.

  • Terra (LUNA) aims to smash past $100 in the coming days

    Terra (LUNA) aims to smash past $100 in the coming days

    We have seen some decent positive momentum for Terra (LUNA) over the last three trading sessions. The coin however appears to have stagnated but there is still more upside for growth. Here are some key facts to note:

    • LUNA has fallen sharply from its $119 highs at the beginning of April.

    • The coin is however consolidating and could surge towards $100 in the days ahead.

    • This will represent a 15% upswing from the current price.

    Data Source: Tradingview 

    How soon will LUNA hit $100?

    After recording modest gains over the last two sessions in a row, LUNA appears to have stagnated. The coin is largely trading sideways, but this is actually a good thing. It means we are seeing some price consolidation following the steep correction LUNA reported after hitting $119 on April 5. Once this consolidation is done, LUNA bulls will likely take over.

    This will happen in the next few days, in fact, we expect LUNA to test $100 at the beginning of trading next week Monday. The run will represent a 15% gain from its current price. The key for bulls however will be to see off any sell-off after hitting the $100.

    As we have seen with many coins this year, when a decisive bull run breaks out, investors are locking profits at crucial resistance zones. The $100-mark is one such resistance for LUNA, and if bulls decide to lock profit at this price, a fall; towards $80 will be inevitable. But in the short term, the possibility of a $15 – 20% gain is highly likely.

    How far can the uptrend go?

    We are not sure there will be enough bullish momentum to take LUNA above $100. In fact, this price will be a huge supply zone.

    Unless something drastic happens, the upswing potential for the coin is severely limited for now. But if the token can sustain gains above $100 for a few days, then a surge towards $120 is not out of the question.