Tag: Breakout

  • Altcoins signal bullish breakout as Bitcoin nears $100K milestone

    Altcoins signal bullish breakout as Bitcoin nears $100K milestone

    • ETH targets $3,200 after breaking trendlines.
    • SOL eyes $230 range with bullish setup.
    • DOGE rises past $0.18 as retail interest grows.

    A major shift is unfolding in the cryptocurrency market as Bitcoin edges closer to the $100,000 psychological mark, prompting renewed attention towards altcoins.

    With Bitcoin dominance starting to decline, market participants are observing a wave of bullish technical signals across major altcoins.

    Coins like Ethereum (ETH), Solana (SOL), Dogecoin (DOGE), and NEAR Protocol (NEAR) are leading what analysts believe may be the early stages of an extended altcoin breakout cycle.

    The shift comes after months of sideways movement in both Bitcoin and alternative digital assets.

    Traders are interpreting recent consolidations in key altcoins as signs of accumulation.

    With bullish chart patterns now forming across higher timeframes, the setup for a widespread breakout appears to be strengthening.

    Bitcoin rally triggers altcoin interest

    Bitcoin’s steady climb has captured global headlines, but under the surface, a quieter transition is taking place.

    Market watchers are noting a drop in Bitcoin dominance — the measure of Bitcoin’s share in the total crypto market capitalisation — indicating that capital is rotating into the altcoin sector.

    This development aligns with patterns seen in previous cycles, where Bitcoin rallies first and is followed by outsized gains in smaller-cap cryptocurrencies.

    As a result, several major tokens are now attempting to break above long-term resistance levels that have been intact since the last bull run.

    ETH, SOL, DOGE show price strength

    Ethereum (ETH), the second-largest cryptocurrency by market capitalisation, has broken above key trendlines and is now targeting the $3,200 zone.

    The move is supported by technical indicators pointing to increasing momentum and volume accumulation.

    Solana (SOL), which has recovered strongly since the end of 2024, is now targeting the $220–$230 range.

    After bouncing from major support zones, SOL has formed an inverse head and shoulders pattern on the daily chart, suggesting a sustained upward push.

    Meanwhile, Dogecoin (DOGE), one of the most-watched memecoins, has climbed above $0.18, a key resistance level from its early 2024 highs.

    DOGE’s rise is backed by rising social media interest and increased retail trading volume, both considered indicators of speculative momentum.

    NEAR, KAS, ADA in breakout zones

    NEAR Protocol (NEAR) and Kaspa (KAS) are also flashing bullish setups.

    NEAR has broken out of a months-long consolidation and is showing signs of institutional interest.

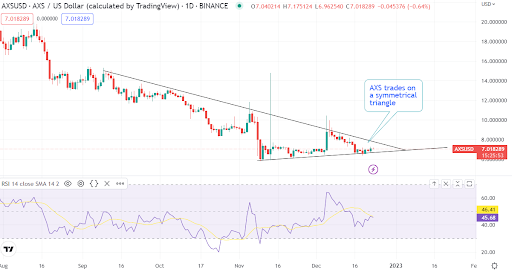
    Technical analysis reveals a breakout from a symmetrical triangle, which often precedes a strong continuation move.

    Kaspa (KAS), known for its blockDAG technology and high transaction throughput, is forming a classic bull flag.

    If confirmed, the pattern could point to a rapid price acceleration from current levels.

    Cardano (ADA) and Sonic (S) are similarly exhibiting accumulation patterns.

    ADA is currently testing upper trendlines, while Sonic recently completed a successful retest and breakout.

    These moves suggest that altcoins are now attempting to recover a significant portion of their bear market losses, with analysts pointing to the potential for 100–250% rallies, should sentiment hold and Bitcoin remain above critical levels.

    Technicals support a bullish cycle

    The latest altcoin rally is not merely speculative. It is backed by technical confirmation on higher timeframes, including weekly charts.

    Patterns such as the cup and handle and inverse head and shoulders have formed across several major tokens, a common feature during the early stages of bullish cycles.

    The broader implication is that altcoins could retrace around 60% of their previous losses if market momentum continues to improve.

    With Bitcoin approaching the $100K mark, this shift in liquidity towards altcoins could mark the beginning of a fresh wave of capital inflows into the broader crypto market.

    Source link

  • Crypto news today: Bitcoin bulls eye $100K breakout; SUI, AVAX charts show potential

    Crypto news today: Bitcoin bulls eye $100K breakout; SUI, AVAX charts show potential

    Crypto news today: Bitcoin bulls eye $100K breakout; SUI, AVAX charts show potential

    • Bitcoin gained over 10% this week, testing key resistance near $95,000 amid strong buying.
    • US Spot Bitcoin ETFs saw massive $3.06 billion weekly inflows, signaling renewed institutional interest.
    • Avalanche (AVAX) consolidates near $23.50 resistance; a breakout could target $31.73 (double-bottom).

    Bitcoin demonstrated renewed strength this week, posting gains of over 10% as determined buyers pushed the price back towards the significant overhead resistance level near $95,000.

    While consolidating below this key hurdle, the fact that buyers haven’t ceded significant ground suggests underlying bullish conviction, further supported by robust institutional inflows and optimistic analyst projections.

    ETF inflows signal renewed institutional appetite

    The sharp upward move in Bitcoin’s price has been significantly bolstered by resurgent buying activity in the US spot Bitcoin exchange-traded funds (ETFs).

    Data from Farside Investors revealed impressive weekly inflows totaling $3.06 billion into these funds.

    Commenting on this influx, Bloomberg ETF analyst Eric Balchunas highlighted on X (formerly Twitter) how notable it was to witness “HOW FAST the flows can go from 1st gear to 5th gear,” indicating a rapid acceleration in institutional demand.

    This renewed buying coincides with bullish technical and quantitative signals. 21st Capital co-founder Sina noted on X that Bitcoin had reclaimed its “power-law price,” a model suggesting considerable long-term upside.

    Sina’s Bitcoin Quantile Model projects potential targets between $130,000 and $163,000 before the end of 2025.

    Other anonymous analysts, like apsk32, hold even more ambitious short-term targets, predicting a move above $200,000 in the fourth quarter of this year.

    Bitcoin (BTC) price analysis: bulls target $100K

    The price chart reveals a tense battle unfolding near the critical $95,000 resistance.

    Technical indicators currently favor the bulls: the 20-day exponential moving average (EMA), sitting around $88,619, is sloping upwards, and the relative strength index (RSI) is positioned near overbought territory, signaling strong buying momentum.

    A decisive close above the $95,000 mark could act as a powerful catalyst, potentially propelling the BTC/USDT pair towards $100,000 and subsequently to the $107,000 region.

    However, sellers are expected to mount a strong defense in the zone between $107,000 and $109,588.

    Conversely, the 20-day EMA serves as crucial near-term support.

    A break below this level could invalidate the immediate bullish momentum and potentially pull the price back into the broader range between $73,777 and $95,000.

    Looking at the 4-hour chart, bears are actively defending the $95,000 level but have struggled to push the price decisively below the shorter-term 20-EMA.

    A rebound off this moving average would strengthen the case for an eventual breakout above $95,000, targeting $100,000.

    However, failure to hold the 4-hour 20-EMA could lead to a deeper pullback towards the 50-simple moving average (SMA), a key level bulls must defend to prevent a slide towards $86,000.

    Sui (SUI) price analysis: testing resistance, eyeing upside

    Sui (SUI) has encountered resistance near the $3.90 level.

    However, the pullback from this high has been relatively shallow, indicating that bulls are holding their positions rather than rushing to take profits.

    If the price remains above the 38.2% Fibonacci retracement level at $3.14, buyers are likely to make another attempt to push the SUI/USDT pair above $3.90.

    A successful breakout could see the price surge towards $4.25 and potentially $5.00.

    On the downside, a break below $3.14 would signal the start of a more significant correction, potentially targeting the 50% retracement level at $2.94.

    Buyers are expected to defend the zone between $2.94 and the 20-day EMA (currently around $2.69).

    The 4-hour chart shows support near the 20-EMA, but sellers remain active at higher levels.

    A break below the 4-hour 20-EMA could trigger a drop to $3.14, while a push above the
    3.81−3.90 resistance is needed to confirm the next leg up towards $4.25.

    Avalanche (AVAX) price analysis: range consolidation, breakout potential

    Avalanche (AVAX) has been consolidating within a range defined by support at $15.27 and resistance near $23.50.

    Trading within such ranges often involves buying near support and selling near resistance.

    While buyers haven’t yet managed to decisively break above $23.50, the fact they haven’t given up much ground suggests accumulation might be occurring.

    A breakout above $23.50 would complete a potential double-bottom pattern, a bullish formation with a calculated target objective near $31.73.

    However, this optimistic scenario would be invalidated if the price turns down and breaks below the moving averages, suggesting the range-bound action might persist.

    On the 4-hour chart, AVAX has been consolidating tightly between $21.60 and $23.10. This narrow range indicates bulls are holding firm, anticipating further upside.

    A break above $23.10 could trigger a move towards $25, likely overcoming the resistance at $23.50.

    Conversely, a drop below $21.60 would signal weakening bullish resolve, potentially pulling the price down towards $19.50.

    Source link

  • Analysts anticipate a Bitcoin Dogs breakout as Bitcoin (BTC) teases new ATH

    Analysts anticipate a Bitcoin Dogs breakout as Bitcoin (BTC) teases new ATH

    Analysts anticipate a Bitcoin Dogs breakout as Bitcoin (BTC) teases new ATH
    • Bitcoin (BTC) surges past $73,000, nearing its all-time high with strong investor interest.
    • Bitcoin Dogs (0DOG), a new meme coin, could break out with its upcoming game launch.
    • Analysts predict growth for Bitcoin Dogs, benefiting from Bitcoin’s bullish momentum.

    The spotlight is back on Bitcoin (BTC), which recently surged past $73,000, drawing both investor attention and market analysis.

    In tandem with this bullish trend, Bitcoin Dogs (0DOG) is positioning itself as a significant player in the crypto ecosystem. With its unique offerings and upcoming game launch, analysts are beginning to speculate on the potential for a breakout in the Bitcoin Dogs token, making it one of the most promising projects to watch in the coming months.

    Bitcoin (BTC) surges toward new all-time highs

    Bitcoin’s recent trading session has been nothing short of dramatic, as its price soared to a high of $73,562, just shy of its all-time high of $73,737 set in March.

    This impressive rally began late Monday when BTC first crossed the $70,000 threshold, marking a five-month high.

    The surge attracted considerable interest from both retail and institutional investors, particularly in light of the growing confidence surrounding Bitcoin Exchange-Traded Funds (ETFs) launched earlier in the year. CoinShares reported a remarkable $1 billion in new investments flowing into Bitcoin-related funds last week, highlighting robust institutional faith in Bitcoin’s future.

    Interestingly, the cryptocurrency community’s reaction to this near-record price point was relatively muted compared to past market rallies. This subdued response could indicate a maturing market where investors are becoming accustomed to Bitcoin’s high-value trading range.

    Additionally, as the US presidential election approaches, Bitcoin’s performance has emerged as a critical focal point, especially with pro-crypto candidates gaining traction in prediction markets.

    Following its impressive rally, Bitcoin has retraced slightly, settling at $72,369.36 at press time. The market sentiment is however still bullish pointing to the potential of BTC registering a new ATH soon.

    Bitcoin Dogs (0DOG) expected to ride the bullish wave

    Amid Bitcoin’s ascendance, Bitcoin Dogs (0DOG), a new meme coin, is drawing attention for its unique approach within the cryptocurrency landscape.

    As the first-ever Initial Coin Offering (ICO) on the Bitcoin blockchain, Bitcoin Dogs raised $13.4 million and minted 900 million tokens—reflecting the estimated number of dogs on Earth. The project aims to blend the enthusiasm of dog lovers with the engaging world of blockchain technology.

    Despite experiencing a 9.7% decline over the past week, there are signs that the price of Bitcoin Dogs (0DOG), which currently sits at $0.008722, could be on the verge of a major break out.

    Upcoming catalysts for Bitcoin Dogs include the launch of its play-to-earn game, which is set to offer holders unique pathways, epic battles, and in-game rewards.

    This innovative game aligns with the growing interest in blockchain gaming and NFTs, positioning Bitcoin Dogs for potential breakout success. Furthermore, the NFT drop associated with the game could significantly enhance community engagement and token value.

    In addition, analysts note that Bitcoin Dogs is well-positioned to capitalize on several bullish trends, including Bitcoin’s resurgence, the rising popularity of meme coins, and the flourishing Telegram gaming market.

    With a focus on community-driven initiatives, Bitcoin Dogs combines the utility that gaming tokens on Bitcoin need with a playful nod to dog-themed meme culture. The project also features a comprehensive Dog Owners Manual, providing users with insights on managing their digital pets, thereby enhancing the user experience.

    With Bitcoin (BTC) teasing new all-time highs and Bitcoin Dogs (0DOG) gearing up for exciting developments, the coming months could see significant shifts in the cryptocurrency market. Investors and analysts alike will be closely watching these two assets as they navigate this promising yet volatile landscape.

    For more information about the Bitcoin Dogs project, visit their official website here.


    Source link

  • ARB, APT ,LRC soar as altcoins mirror ETH breakout to $2.1k

    ARB, APT ,LRC soar as altcoins mirror ETH breakout to $2.1k

    • Altcoins are soaring, with the prices of Arbitrum, Aptos, Loopring , Optimism and Rocket Pool seeing double digit gains.
    • Ethereum price broke above $2,100 and ARB, RPL and OP prices are among the biggest gainers in the top 100 cryptocurrencies by market cap today.
    • Analysts says altcoins have been buoyed by ETH breakout after Shanghai, even as Bitcoin dominance fell.

    Altcoins are thriving, but have a small window to see some joy amid the latest spike for Ethereum price, a top analyst has said.

    Crypto market intelligence platform Santiment highlighted the move among altcoins as coming amid a pivot of profits from Bitcoin to smaller cap cryptocurrencies. The sentiment flip around alts also happens at a time Ethereum dominates the social discussion volume following its breakout above $2k.

    ARB, RPL and OP prices soar as profits pivot to altcoins amid ETH breakout

    On Friday, as ETH broke above $2,100 for the first time since May 2022, several altcoins followed suit, with Aptos (APT), Arbitrum (ARB), Rocket Pool (RPL), Optimism (OP) and Loopring (LRC) registering mega moves.

    Arbitrum has spiked more than 18% in the past 24 hours to hit highs of $1.57, while Aptos price was also up double digits as bulls pushed for $14. 

    Meanwhile, Loopring traded to highs of $0.45 with +11% and Rocket Pool traded to near $52 with 18% in 24 hours. Optimism price rose to $2.64 with another +10% gain.

    According to on-chain data, the altcoin market is starting thrive after Bitcoin (BTC) dominance over the past few weeks.

    While BTC extended its gains above $30k – hitting highs of $30,800 on Friday – the major move was seen in Ether after the super successful Shanghai upgrade

    ETH/USD first broke above $2,000 and then followed that up with a decent punch above $2,100 (buying pressure pushed Ethereum price to highs of $2,130 on crypto exchange Bitstamp.

    Analyst Captain Faibik says the Bitcoin Dominace as measured by the market cap parabolic curve formation is showing a sell point. BTC dominance has shrunk to 44%, while that of Ethereum has risen to 19%. As the price of BTC rises and BTC.D falls, it suggests alts have a massively bullish opportunity and may begin to rally.

    Altcoin rally? Analysts warn traders

    While top crypto analysts are pointing to Ethereum as “a leading indicator for altcoins,”(we highlighted Rekt Capital’s view here), some have said the “window” might not be that big and a pullback is likely. 

    Scott Melker, author of The Wolf Den Newsletter, says altcoin traders should “enjoy it while it lasts.” 

    Michael van de Poppe expects Bitcoin to rally to $40k and Ethereum to $2,800-$3,000 range. Alts should be seeing some momentum too – but the window will likely be small, he noted.


    Source link

  • Litecoin (LTC/USD) to $100 looks probable as a breakout at resistance gets underway

    Litecoin (LTC/USD) to $100 looks probable as a breakout at resistance gets underway

    • Litecoin is attempting to break above $80

    • The upcoming halving event is seen to boost the price

    • A successful breakout will see buyers eye the next resistance at $100

    If you have been eyeing Litecoin (LTC/USD), it is time to get even more curious, as the latest price action looks exciting. The area around $80 was a stumbling block to Litecoin during its bullish rally in November. Bears took the chance to push the price lower, retesting the $64 support but bulls resuscitated thereafter.

    In a tug-of-war between bulls and bears, the former is seemingly winning as Litecoin attempts to clear the $80 barrier. The cryptocurrency surged to $82, although it is not clear if the daily candlestick will close above to consider a breakout. Should a bullish market be confirmed, a journey to $100 looks very likely. Investors would better watch how the price action plays out next.

    If you might have missed it, you could refer to the CoinJournal analysis on how Litecoin’s halving event is influencing price. But aside from this critical event, Litecoin could draw from the slightly improved crypto sentiment to force a breakout. Most cryptocurrencies have staged recoveries as of press time. So how will you tell if a breakout has occurred in LTC price?

    LTC surges with higher momentums at $80

    LTC/USD Chart by TradingView

    On the daily chart technical outlook, momentum is very strong for LTC. The daily candlestick is piercing through the $80 resistance zone. There is a surge in the buy-side volumes, indicating buyers are very active on LTC. The price also stays clear of the moving averages and ascending trendline.

    When to consider a breakout?

    LTC must clear $80, with the daily candlestick closing above, to consider a successful breakout. If the price closes above this crucial level, buyers may get attracted. LTC could surge to nearly $100, the potential resistance zone. 

    On the contrary, if the LTC price closes below $80, the token could be due for a correction. We consider the former a more likely scenario but investors should be open to both.

    Where to buy LTC

    eToro

    eToro offers a wide range of cryptos, such as Bitcoin, XRP and others, alongside crypto/fiat and crypto/crypto pairs. eToro users can connect with, learn from, and copy or get copied by other users.


    Buy LTC with eToro today

    Binance

    Binance is one of the largest cryptocurrency exchanges in the world. It is better suited to more experienced investors and it offers a large number of cryptocurrencies to choose from, at over 600.

    Binance is also known for having low trading fees and a multiple of trading options that its users can benefit from, such as; peer-to-peer trading, margin trading and spot trading.


    Buy LTC with Binance today

    Source link

  • Axie Infinity (AXS/USD) breakout on a symmetrical triangle incoming

    Axie Infinity (AXS/USD) breakout on a symmetrical triangle incoming

    • Axie Infinity has lost 95% of its value from its ATH

    • The cryptocurrency trades on a symmetrical triangle

    • A breakout could shape the next price direction for AXS

    Axie Infinity (AXS/USD) has been one of the hardest-hit cryptocurrencies this year. The token of the play-to-earn platform has lost 95% of its value from its all-time high. However, the last two months of the year should give some hope.

    AXS bottomed at $5.9 in early November. The cryptocurrency made some bullish price spikes occasionally, one time touching $14. The price, followed by sudden falls, has failed to inspire a comeback. However, AXS’s price action shows the cryptocurrency has been on a steady ascend. Trading at $7.0 as of press time, AXS had maintained a near-symmetrical triangle. What is its price next?

    Perhaps we should start by mentioning that Axie Infinity witnessed some boosts from the latest cryptocurrency news. That Axie Infinity’s Origins game app was successfully okayed on Google Play Store. Axie lovers would be excited at the news as it opens more opportunities for Web 3.0 gaming. Axie said the approval allows it to continue “testing and improving the game.” The team also lauded the development as key to launching Origins in other parts of the globe.

    Enough to make the Axie Infinity token explode? No, but there are positives from the price action.

    AXS maintains a short-term price recovery

    AXS/USD Chart by TradingView

    On the daily chart, AXS trades on a symmetrical triangle, although the descending trendline is a bit steeper. The RSI is recording improvements, although the reading is below the midpoint.

    AXS will break out next from the symmetrical triangle.

    Will AXS break higher or lower

    A break from a symmetrical triangle can occur on the upper or lower side. A break out at the descending trendline would set the momentum to bullish. We consider this as the most likely scenario since AXS price is emerging from a bottom. On the contrary, AXS could break lower to trade back to the bottom price.

    Where to buy AXS

    eToro

    eToro offers a wide range of cryptos, such as Bitcoin, XRP and others, alongside crypto/fiat and crypto/crypto pairs. eToro users can connect with, learn from, and copy or get copied by other users.


    Buy AXS with eToro today

    Bitstamp

    Bitstamp is a leading cryptocurrency exchange which offers trading in fiat currencies or popular cryptocurrencies.

    Bitstamp is a fully regulated company which offers users an intuitive interface, a high degree of security for your digital assets, excellent customer support and multiple withdrawal methods.


    Buy AXS with Bitstamp today

    Source link

  • Toncoin (TON/USD) is on the verge of a breakout

    Toncoin (TON/USD) is on the verge of a breakout

    • Toncoin has been bullish lately

    • The cryptocurrency is retesting the resistance at $1.97

    • Investors should watch for a breakout for a chance to buy the token

    Toncoin (TON/USD) trades at $1.97. The level is an important resistance zone; it is the third time the cryptocurrency has tested it since September. TONCOIN was trading with increasing momentum at the crucial level, implying that buyers were looking for a potential breakout. Will it happen?

    Toncoin is a decentralised blockchain and a Layer-1 protocol. The project was founded in 2018 by Telegram before being abandoned. The acquisition by the TON Foundation saw its name change from “Telegram Open Network” to “The Open Network” or simply, TON. 

    TON is a community-driven protocol. It features a flexible architecture with a focus on the typical customer. The blockchain’s mission is to have a robust ecosystem for decentralised services, storage, instant payment, and a domain name system. It is regarded as one of the fastest blockchains. In September 2021, at the height of the crypto boom, Ton processed a then-world record 55,000 transactions per second in a contest. The TPS has since grown rapidly in line with improving technology.

    TONCOIN, the native token, has, however, succumbed to the bear market. The token topped $4.8 in December 2021. It now trades at less than half the value, although the price is still sound compared to most cryptocurrencies. TONCOIN is now giving bulls an alert ahead of its next move.

    TONCOIN retests the $1.97 resistance

    TONCOIN/USD Chart by TradingView

    Technically, TONCOIN is trading with bullish and improving momentum. The MACD indicator is bullish as the cryptocurrency retests the $1.97 resistance. A break above the resistance would allow TONCOIN bulls to push the price to the next possible resistance at $2.8.

    What to do next for TONCOIN?

    Wait for a confirmation of a breakout at $1.97 before buying TONCOIN. With the cryptocurrency getting rejected at the crucial level three times, investors should also be prepared for a correction. A rejection of the upside will pit TONCOIN back to $1.

    Where to buy TONCOIN 

    As TONCOIN is such a new asset, it’s yet to be listed on major exchanges. You can still purchase TONCOIN using a DEX (decentralised exchange) though, which just means there are a few extra steps. To buy TONCOIN right now, follow these steps:

    1. Buy ETH on a regulated exchange or broker, like eToro ›

    We suggest eToro because it’s one of the world’s leading multi-asset trading platforms, an exchange and wallet all-in-one with some of the lowest fees in the industry. It’s also beginner-friendly, and has more payment methods available to users than any other available service.

    2. Send your ETH to a compatible wallet like Trust Wallet or MetaMask

    You’ll need to create your wallet, grab your address, and send your coins there.

    3. Connect your wallet to the 1Inch DEX

    Head to 1Inch, and ‘connect’ your wallet to it.

    4. You can now swap your ETH for TONCOIN

    Now that you’re connected, you’ll be able to swap for 100s of coins including TONCOIN.

    Source link

  • JasmyCoin (JASMY/USD) attempts breakout at 50-day MA

    JasmyCoin (JASMY/USD) attempts breakout at 50-day MA

    • JasmyCoin has recovered by double digits in a week

    • The token has hit a descending trendline 

    • JASMY could correct in line with the longer-term bearish momentum

    JasmyCoin (JASMY/USD) saw rising trading volumes on Friday amid a mixed cryptocurrencies trading. The token, ranked lowly at #543 on CoinMarketCap, has witnessed a 13% surge in the past week. The weekly gains now take bulls to an important level that would determine if investors will see further gains.

    JASMY is the native token of the Internet of Things’ Tokyo-based firm Jasmy Corporation. The company enables the buying and selling of data by connecting service providers and users. From the decentralisation perspective, the Jasmy platform allows users complete control of their personal information. This is enabled by enabling IoT through blockchain technology. In short, Jasmy aims to provide a platform where users can freely, easily, and safely move data. 

    JASMY saw increased interest in 2021 at the height of the crypto boom. It has since crashed and trades at just $0.004. The price compares to a high of $0.35 in November 2021 – a significantly depressed price level. With the renewed gains, how far can this token go?

    JASMY meets resistance at the descending trendline

    JASMY Chart by TradingView

    The technical outlook shows that JASMY has met resistance at the descending trendline and 50-day MA. Since August, JASMY has always been rejected at the descending trendline. Although bulls are attempting a break above the 50-day MA, they are under bear pressure. 

    The MACD indicator shows improving momentum for JASMY. Nonetheless, we see that the token has always corrected anytime the MACD has approached the neutral level since August.

    What next for JASMY?

    The bear momentum is in place for JasmyCoin despite the weekly recoveries. To buy the cryptocurrency, wait for the price to break above the descending trendline or the 50-day MA. 

    The bullish expectation could be invalidated if the past price action of the cryptocurrency repeats itself. Bulls should keep off for now until the cryptocurrencies sentiment improves.

    Where to buy JASMY

    KuCoin

    Kucoin is a cryptocurrency exchange which offers over 200 cryptocurrencies.

    Kucoin has a wide range of services, such as; a built-in peer-to-peer exchange, spot and margin trading, bank level security and a wide range of accepted payment methods.

    Users can benefit from a beginner-friendly interface and relatively low fees.


    Buy JASMY with KuCoin today

    Swapzone

    Swapzone is a crypto exchange aggregator that operates as a gateway between the cryptocurrency community and exchange services. Swapzone aims to provide a convenient interface, safe user flow, and crystal-clear data for users to find the best exchange rates among the whole cryptocurrency market.


    Buy JASMY with Swapzone today

    Source link

  • Fantom (FTM/USD) eyes a breakout. Is the token about to post sustainable gains?

    Fantom (FTM/USD) eyes a breakout. Is the token about to post sustainable gains?

    • Fantom token has recovered by 28% in the last seven days

    • Developments around Fantom asset base have boosted the cryptocurrency

    • FTM has hit a descending trendline and could correct 

    Fantom (FTM/USD) trades at $0.24 as of press time, its highest level in nearly a month. The cryptocurrency has risen by 28% in the past week, a robust recovery since it bottomed at $0.17. The gains come amid positive cryptocurrency news.

    The latest FTM gains came as reports suggested that the Fantom Foundation earns consistent profits. According to the financial records dated November 28, Fantom was generating more than $10 million annually. The reports also indicated that Fantom could have about $340 million worth of digital assets. The assets could last 30 years without the foundation having to sell its stash of FTM tokens.

    With many crypto firms and exchanges under a liquidity crunch, the records of Fantom boosted investors’ confidence. Addresses holding Fantom tokens saw a strong increase in November from the smallest to the largest investors. The accumulation suggests that investors anticipate a recovery in the cryptocurrency’s price, which has lost 93% from its ATH. But can buyers sustain the recovery?

    FTM heading to the descending trendline 

    FTM/USD Chart by TradingView

    Technically, the Fantom token has recovered above crucial support at $0.20. The recovery has seen the cryptocurrency move above the moving averages. However, the token remains trapped by a long-term descending trendline. 

    The RSI reading shows that FTM is nearing overbought levels at the descending trendline. A possible correction could occur before buyers have a chance to break the crucial barrier.

    What next for FTM?

    A breakout above the descending trendline will confirm further gains in Fantom token. A breakout will allow buyers to ride to $0.30 next and $0.40.

    On the flip side, FTM will be rejected at the descending trendline. That will allow bears to force a correction back to $0.20. However, with growing FTM accumulation, buyers may crave another chance to break above the descending trendline.

    Where to buy FTM

    eToro

    eToro offers a wide range of cryptos, such as Bitcoin, XRP and others, alongside crypto/fiat and crypto/crypto pairs. eToro users can connect with, learn from, and copy or get copied by other users.


    Buy FTM with eToro today

    Binance

    Binance is one of the largest cryptocurrency exchanges in the world. It is better suited to more experienced investors and it offers a large number of cryptocurrencies to choose from, at over 600.

    Binance is also known for having low trading fees and a multiple of trading options that its users can benefit from, such as; peer-to-peer trading, margin trading and spot trading.


    Buy FTM with Binance today

    Source link

  • Bitcoin (BTC/USD) choppy pattern continues. Here is why the next breakout could be catastrophic

    Bitcoin (BTC/USD) choppy pattern continues. Here is why the next breakout could be catastrophic

    Since breaking below $19,000, Bitcoin (BTC/USD) has been unable to recover to the crucial psychological level. As of press time, the cryptocurrency trades slightly above $16,000, the level it bottomed at post-FTX collapse. It’s nearly two weeks now, and the price of BTC has been consolidating at this yearly low. Can it recover in the next few days?

    It is hard to tell if BTC will find a bullish footing as crypto sentiment remains weak. Besides the FTX-inspired crash, BTC remains a key barometer of global economic health. Central banks are tightening the belts with rate increases to tame high inflation. With the situation looking gloomy, it could take a while before we find the right balance to take BTC higher. 

    Once again, BTC’s decline below $19,000 indicated its bottom still needs to be found. Is $16,000 the likely bottom, or could we see a further decline below this level? A potential breakout is imminent that could help answer the question. Let’s turn to the technical levels and price action:

    BTC eyes a potential bearish inside bar breakout at $16,000

    BTC/USD Chart by TradingView

    On the daily chart, BTC trades with weakening momentum at the support of $16,000. The MACD indicator shows a strong bear market for BTC. Multiple pin bars formed at the level, indicating indecision in the market.

    What’s likely to happen for BTC?

    Two possible scenarios are likely for the BTC price in the coming days. If bulls defend the $16,000 level successfully, it will set BTC for a recovery to $19,000. An improved market outlook or momentum will strengthen a bullish market. A bullish signal at the crucial support zone will be needed to confirm an upside. 

    On the flip side, Bitcoin could fall to $11,000 if bulls fail at the $16,000 level. This is a more likely outcome, given the weak momentum at the current BTC price. In the bear scenario, a bearish breakout of the inside bars formed at $16,000 will be confirmed. That will give bears control to take BTC lower.

    Where to buy BTC    

    eToro

    eToro offers a wide range of cryptos, such as Bitcoin, XRP and others, alongside crypto/fiat and crypto/crypto pairs. eToro users can connect with, learn from, and copy or get copied by other users.


    Buy BTC with eToro today

    Bitstamp

    Bitstamp is a leading cryptocurrency exchange which offers trading in fiat currencies or popular cryptocurrencies.

    Bitstamp is a fully regulated company which offers users an intuitive interface, a high degree of security for your digital assets, excellent customer support and multiple withdrawal methods.


    Buy BTC with Bitstamp today

    Source link