Tag: consolidation

  • Bitcoin extends consolidation amid ETF outflows, echoing pre‑2025 surge patterns

    Bitcoin extends consolidation amid ETF outflows, echoing pre‑2025 surge patterns

    Bitcoin echoes pre-2025 rally patterns

    • Bitcoin currently trades in a tight range near $90K amid a 3-day streak of ETF outflows.
    • The current market consolidation mirrors pre‑2025 surge patterns with low volatility.
    • The key levels to watch include the support at $90K, the immediate resistance at $95K, and $100k in case of a breakout.

    Bitcoin (BTC) price has remained stuck in a narrow trading range around $90,000.

    The cryptocurrency is showing signs of consolidation after a volatile start to 2026.

    Bitcoin ETF flows and macroeconomic uncertainties are playing a key role in the price movement.

    Bitcoin ETF outflows weigh on BTC price

    In early January, Bitcoin spot ETFs initially attracted strong inflows, signalling renewed institutional interest.

    However, a three-day streak of outflows totalling over $1 billion has nearly erased those gains.

    This shift indicates waning conviction among institutional investors.

    The outflows have contributed to Bitcoin’s inability to break above $95,000.

    Traders are cautious as geopolitical tensions between the USA, Latin American countries and Iran, and broader risk-off sentiment, weigh on the market.

    ETF redemption patterns are currently a major driver of near-term price behaviour.

    These flows may represent tactical rotation rather than long-term liquidation.

    Investors could be reallocating capital to other assets while maintaining exposure to Bitcoin.

    Nonetheless, the short-term pressure has kept BTC trading in a tight range between roughly $88,000 and $95,000.

    Echoes of pre‑2025 rally patterns

    Bitcoin’s current sideways trading resembles the consolidation phase before its 2025 rally.

    In the months leading up to the surge, BTC spent nearly 50 days in a narrow range, a phenomenon called time-based capitulation.

    This period allowed weak hands to exit and set the stage for a powerful upward move.

    The current market consolidation mirrors that pattern, suggesting the market may be quietly building momentum.

    Bitcoin price analysis
    Current consolidation mirrors pre-2025 rally consolidation | Source: TradingView

    Unlike traditional capitulation, this phase does not involve panic selling or sharp drops.

    Instead, low volatility and a steady range characterise this pre-rally accumulation period.

    Some analysts see this as a signal that Bitcoin could be preparing for a significant breakout.

    The ETF outflows and geopolitical pressures may simply be temporary obstacles.

    If history repeats, a sustained push above resistance could trigger renewed bullish momentum.

    The key Bitcoin price levels to watch

    One of the key price levels to watch out for is the key support that remains near $90,000.

    A break below this support could open the door to further declines toward $86,000–$88,000.

    However, a sustained move above $95,000 would signal renewed institutional buying and potential acceleration.

    If Bitcoin overcomes $100,000, the market could revisit mid‑2025 highs and even target $110,000 in the medium term.

    Moving forward, traders and investors should monitor both technical levels and macro catalysts to gauge the timing and scale of the next potential surge.

    Source link

  • Is Solana (SOL/USD) consolidation a wait for takeoff or a further slide?

    Is Solana (SOL/USD) consolidation a wait for takeoff or a further slide?

    • Solana token fell the most in November

    • Social metrics are negative for the cryptocurrency

    • SOL has been consolidating for weeks and faces further downside

    Solana (SOL/USD) was one of the worst-performing cryptocurrencies in November. The cryptocurrency came from a high of $38 on November 5 but now trades at just$13.55. The losses came in the wake of the FTX collapse. However, for almost three weeks, SOL has been consolidating at or above $13. Does this signal the entry of buyers?

    Solana’s consolidation comes amid a troubling on-chain activity. According to Santiment data, Solana’s spot and futures markets are struggling, with the trade volumes at monthly lows. As of December 2, the open interest on Solana was $208.9 million, a decline of 1.25%.

    Besides, short-position trades were active on Solana, with the funding rates remaining in the negative territory. Further indications were that there were more long liquidations ($207,000) than short liquidations ($89,000) worth of SOL.

    Clearly, the data is against SOL. Social metrics show limited upside, with the sentiment negative. Consequently, the latest consolidation may signal sellers’ exhaustion rather than buyers’ entry. A break to the downside would welcome a lower price for SOL.

    SOL consolidates at $13 amid bearish momentum

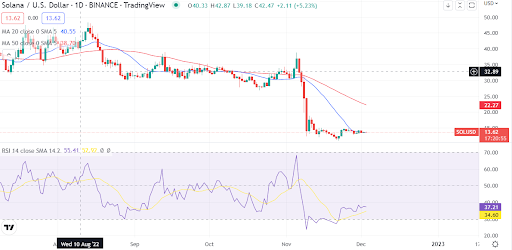
    SOL/USD Chart by TradingView

    Technically, SOL is bearish in the longer-term outlook. The RSI is escaping the oversold level but still remains way below the midpoint. A slight recovery saw SOL move to the 20-day MA, but the price upside is still muted.

    When to buy SOL?

    Solana’s price is still bearish. Investors looking to buy SOL should wait for the bear market to subside before scooping the token. A break below the consolidation zone could see SOL hit single-digit prices.

    Where to buy SOL

    eToro

    eToro offers a wide range of cryptos, such as Bitcoin, XRP and others, alongside crypto/fiat and crypto/crypto pairs. eToro users can connect with, learn from, and copy or get copied by other users.


    Buy SOL with eToro today

    Binance

    Binance is one of the largest cryptocurrency exchanges in the world. It is better suited to more experienced investors and it offers a large number of cryptocurrencies to choose from, at over 600.

    Binance is also known for having low trading fees and a multiple of trading options that its users can benefit from, such as; peer-to-peer trading, margin trading and spot trading.


    Buy SOL with Binance today

    Source link

  • GMX token (GMX/USD) benefits from FTX collapse and breaks from consolidation

    GMX token (GMX/USD) benefits from FTX collapse and breaks from consolidation

    • GMX token has more than doubled in price

    • The DEX has witnessed increased activity in November

    • GMX broke from consolidation and is a buy on a retracement

    GMX token (GMX/USD) has doubled in price. Trading at just $25 on November 10, the cryptocurrency touched a high of $59 on December 2. The gains come amid an influx of investors post-FTX collapse. As of press time, GMX was trading at $56.

    The collapse of the FTX exchange fueled demand for decentralised exchanges or DEX. Among the DEXs that became popular were GMX and Uniswap. Both platforms saw increased investors’ interest, fueling gains in the native tokens. Yet, on November 28, GMX saw $1.15 million in daily trading fees. The fees surpassed those earned by Uniswap for the first time in history. That underlined that investors look at the lesser-known DEX as a serious rival to Uniswap.

    Market analyst Zen commented on the recent performance of GMX compared to Uniswap. The market analyst says GMX’s performance stems from investors receiving favourable trading fees of about 30%. Users on Uniswap do not get shares from the protocol’s trading fees. Zen says that GMX is a buy-and-hold in the bear market. He also lauds the platform as being the second-highest platform consistently after Uniswap.

    GMX technical outlook as price aims for the stars

    GMX/USD Chart by TradingView

    Technically, GMX broke above a resistance at $49. The cryptocurrency has also been trading on an ascending channel, now invalidated as the price broke out on the upper band.

    An RSI reading of 70 suggests that GMX is entering overbought levels. The cryptocurrency is also facing minor resistance, and a correction could occur before the next bull leg.

    When to buy GMX?

    A breakout at the crucial resistance and strong fundamentals supports buying GMX. However, from the price action and indicators, GMX could be due for a correction. 

    A potential price retracement towards $49 is on the horizon. Investors should take advantage of a correction and buy lower. 

    Where to buy GMX

    Source link