Tag: continues
-

Bitcoin’s “hedge” narrative is dead, as speculative price action continues
Key Takeaways
- Crypto has risen to start the year off the back of expectations that interest rates may be cut sooner than anticipated
- This contrasts with the view that crypto is uncorrelated, proving it false
- Assessing the price action of crypto through the pandemic and subsequent rate-raising cycle shows an extremely risky asset class that moves in line with other speculative asset classes
Over the last couple of months, markets have turned green off the back of inflation data softening around the globe. Crypto hasn’t been left off the invite list, with digital assets surging to their strongest rally in 9 months.
If there was ever any doubt (and by now, there really shouldn’t be), this proves once and for all that any narrative around crypto being an uncorrelated asset is dead.
Pandemic bull run
To quickly recap on the last few years in cryptoland, the asset class initially moved violently upward as central banks worldwide pursued ultra-low interest rate policy.
As economies ground to a halt for the ultimate black swan, the COVID-19 pandemic, nations faced a highly uncertain outlook in Q1 of 2020. With lockdowns sweeping the world, central banks were forced to do what they could to stimulate these abruptly-shut societies.
Out came stimulus packages of an unprecedented scale.
With all this stimulus and generationally cheap money, risk assets went bananas. The biggest leader of all was cryptocurrency. Some argued that the assets were rising as a result of the inevitable inflation that would result from all this expansionary monetary policy, as crypto was a hedge against the fiat system. The argument wouldn’t hold.
The transition to a new interest rate paradigm
The year 2022 did indeed bring a spike in inflation, and this time central banks were forced to do the opposite – aggressively hike rates as the cost of living spiralled relentlessly.
This has reined in risk assets, as per the playbook. Liquidity is sucked out of the system, suppressing demand. Investors now have alternate vehicles in which to park their wealth and earn a yield, with government-guaranteed T-bills now offering reasonable alternatives, as opposed to the zero rates previously (or negative in some nations).
But cryptocurrency followed the rest of the world’s risk assets down. Not only that, but the scale of the meltdown in the sector was unlike anything we have seen in a major asset class in a long time. Bitcoin shaved over three-quarters of its market cap, and it came out favourably compared to altcoins, many of which were decimated.
And now, the last couple of months have brought more optimistic readings regarding inflation. The numbers are still scary, but just a little bit of positivity has crept in that the worst may have passed. Of course, there is still a war ongoing in Europe and now fear has elevated that a recession may be imminent (if not here already), but hey – let’s celebrate whatever wins we can.
The stock market has cautiously crept upwards, as the market moves to the expectation that high interest rates will cease sooner than previously expected.
The only thing is, crypto has also risen. Not only that, but it has printed gains which blow the moves in equity markets out of the water.
Which, you know, kind of suggests that this may not be an inflation hedge at all. As inflation comes back down and the likelihood of lower rates and another expansionary period grows, crypto rises. Go figure.
Correlation vs stock market remains high
The proof is in the pudding. It is pretty clear by simply looking at the price chart of S&P 500 vs Bitcoin that the correlation here is stark – with the key lurking variable being interest rates.
Quite literally, crypto is the opposite of an uncorrelated asset – it has moved in lockstep with the stock market for the last few years.
Interestingly, there have been periods of decoupling, however. Unfortunately, they have come amid crypto-specific crashes. To show this, I plotted the Bitcoin/S&P 500 correlation against the Bitcoin price over the last couple of years.
The correlation has been high, aside from a few noticeable periods – all occurring when the Bitcoin price plummeted. The most recent example was November 2022, when crypto wobbled amid the FTX crash.
There really is no debate here. Crypto is a highly correlated, extreme-risk asset. The only question is whether it can shed this moniker in the long term. But any thought contesting that it is not currently wildly speculative is wide of the mark.
-
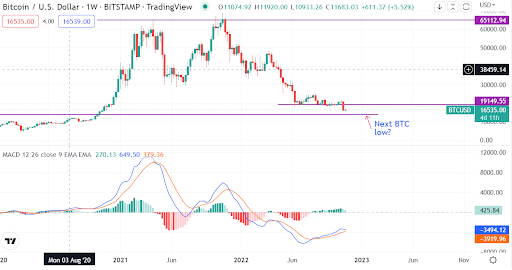
Bitcoin (BTC/USD) choppy pattern continues. Here is why the next breakout could be catastrophic

Since breaking below $19,000, Bitcoin (BTC/USD) has been unable to recover to the crucial psychological level. As of press time, the cryptocurrency trades slightly above $16,000, the level it bottomed at post-FTX collapse. It’s nearly two weeks now, and the price of BTC has been consolidating at this yearly low. Can it recover in the next few days?
It is hard to tell if BTC will find a bullish footing as crypto sentiment remains weak. Besides the FTX-inspired crash, BTC remains a key barometer of global economic health. Central banks are tightening the belts with rate increases to tame high inflation. With the situation looking gloomy, it could take a while before we find the right balance to take BTC higher.
Once again, BTC’s decline below $19,000 indicated its bottom still needs to be found. Is $16,000 the likely bottom, or could we see a further decline below this level? A potential breakout is imminent that could help answer the question. Let’s turn to the technical levels and price action:
BTC eyes a potential bearish inside bar breakout at $16,000
On the daily chart, BTC trades with weakening momentum at the support of $16,000. The MACD indicator shows a strong bear market for BTC. Multiple pin bars formed at the level, indicating indecision in the market.
What’s likely to happen for BTC?
Two possible scenarios are likely for the BTC price in the coming days. If bulls defend the $16,000 level successfully, it will set BTC for a recovery to $19,000. An improved market outlook or momentum will strengthen a bullish market. A bullish signal at the crucial support zone will be needed to confirm an upside.
On the flip side, Bitcoin could fall to $11,000 if bulls fail at the $16,000 level. This is a more likely outcome, given the weak momentum at the current BTC price. In the bear scenario, a bearish breakout of the inside bars formed at $16,000 will be confirmed. That will give bears control to take BTC lower.
Where to buy BTC
eToro
eToro offers a wide range of cryptos, such as Bitcoin, XRP and others, alongside crypto/fiat and crypto/crypto pairs. eToro users can connect with, learn from, and copy or get copied by other users.
Bitstamp
Bitstamp is a leading cryptocurrency exchange which offers trading in fiat currencies or popular cryptocurrencies.
Bitstamp is a fully regulated company which offers users an intuitive interface, a high degree of security for your digital assets, excellent customer support and multiple withdrawal methods.
-

Bitcoin BTC prediction as the token continues to stall

Bitcoin (BTC/USD) may have settled above $15,000, but the pressure is mounting. As of press time, the cryptocurrency was trading at $16,623, losing 1.32% on the day. BTC is also largely consolidating rather than making a directional move. A technical outlook shows a potential decline to the next low.
Bitcoin’s price action comes when data shows that BTC holders are withdrawing their holdings from crypto exchanges. According to Glassnode, there is over $1.75 billion per month of mass exodus of Bitcoin from exchanges. The withdrawals come after the collapse of the crypto exchange FTX.
Further, Glassnode data shows investors are flooding exchanges with dollar-pegged digital assets. More than $1.04 billion worth of stablecoins flowed into exchanges after the FTX fiasco. The rising suggests that investors are gearing up to buy the dip as most cryptocurrencies tanked.
An increase in stablecoins flowing to the exchanges preempts investors’ expectations. However, it does not indicate that we have hit the market bottom. From the BTC perspective, this is illustrated by increasing bear pressure for the cryptocurrency.
BTC analysis as price stalls below key level
On the weekly chart outlook, BTC has a confirmed break below the $19,500 level. The MACD indicator shows the cryptocurrency is bearish. The momentum is also weakening further.
Will Bitcoin proceed lower?
The current BTC price level could fail to hold due to weak momentum. The price also trades at a non-support zone, meaning the cryptocurrency is yet to settle.
Based on the technical indicators, a lower price is possible for BTC. The next established support for BTC lies lower at $11,000. However, the level around $14,000 has shown price action before and could provide support for BTC.
Where to buy BTC
eToro
eToro offers a wide range of cryptos, such as Bitcoin, XRP and others, alongside crypto/fiat and crypto/crypto pairs. eToro users can connect with, learn from, and copy or get copied by other users.
Bitstamp
Bitstamp is a leading cryptocurrency exchange which offers trading in fiat currencies or popular cryptocurrencies.
Bitstamp is a fully regulated company which offers users an intuitive interface, a high degree of security for your digital assets, excellent customer support and multiple withdrawal methods.
-

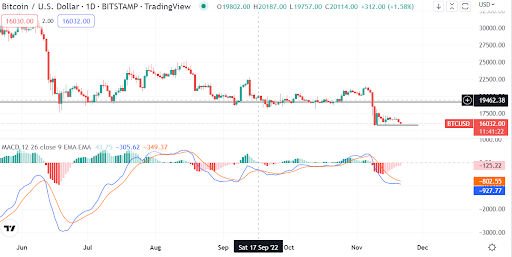
Bitcoin could drop below $16k as the bearish trend continues
Bitcoin has lost more than 20% of its value over the last seven days and could record further losses this week.
The cryptocurrency market has recorded perhaps its worst week so far this week. Bitcoin and the other leading cryptocurrencies have been underperforming over the past few days.
Bitcoin, the world’s leading cryptocurrency, has lost more than 20% of its value over the last seven days. It was trading above $20k per coin a week ago but is now trading around $16,500 per week.
The bearish performance comes following the collapse of the cryptocurrency exchange FTX. FTX was one of the top five crypto exchanges in the world, and its collapse has thrown the crypto market into a deep bearish trend.
The crypto exchange filed for Chapter 11 bankruptcy last week following its collapse. The total cryptocurrency market currently stands at around $831 billion, having lost more than $150 billion over the past few days.
With Bitcoin holding its ground above $16k, the leading cryptocurrency could record further losses over the coming days.
Key levels to watch
The BTC/USD 4-hour chart is extremely bearish, as Bitcoin has been underperforming over the past few days. Bitcoin’s technical indicators show that the bears are currently in control.
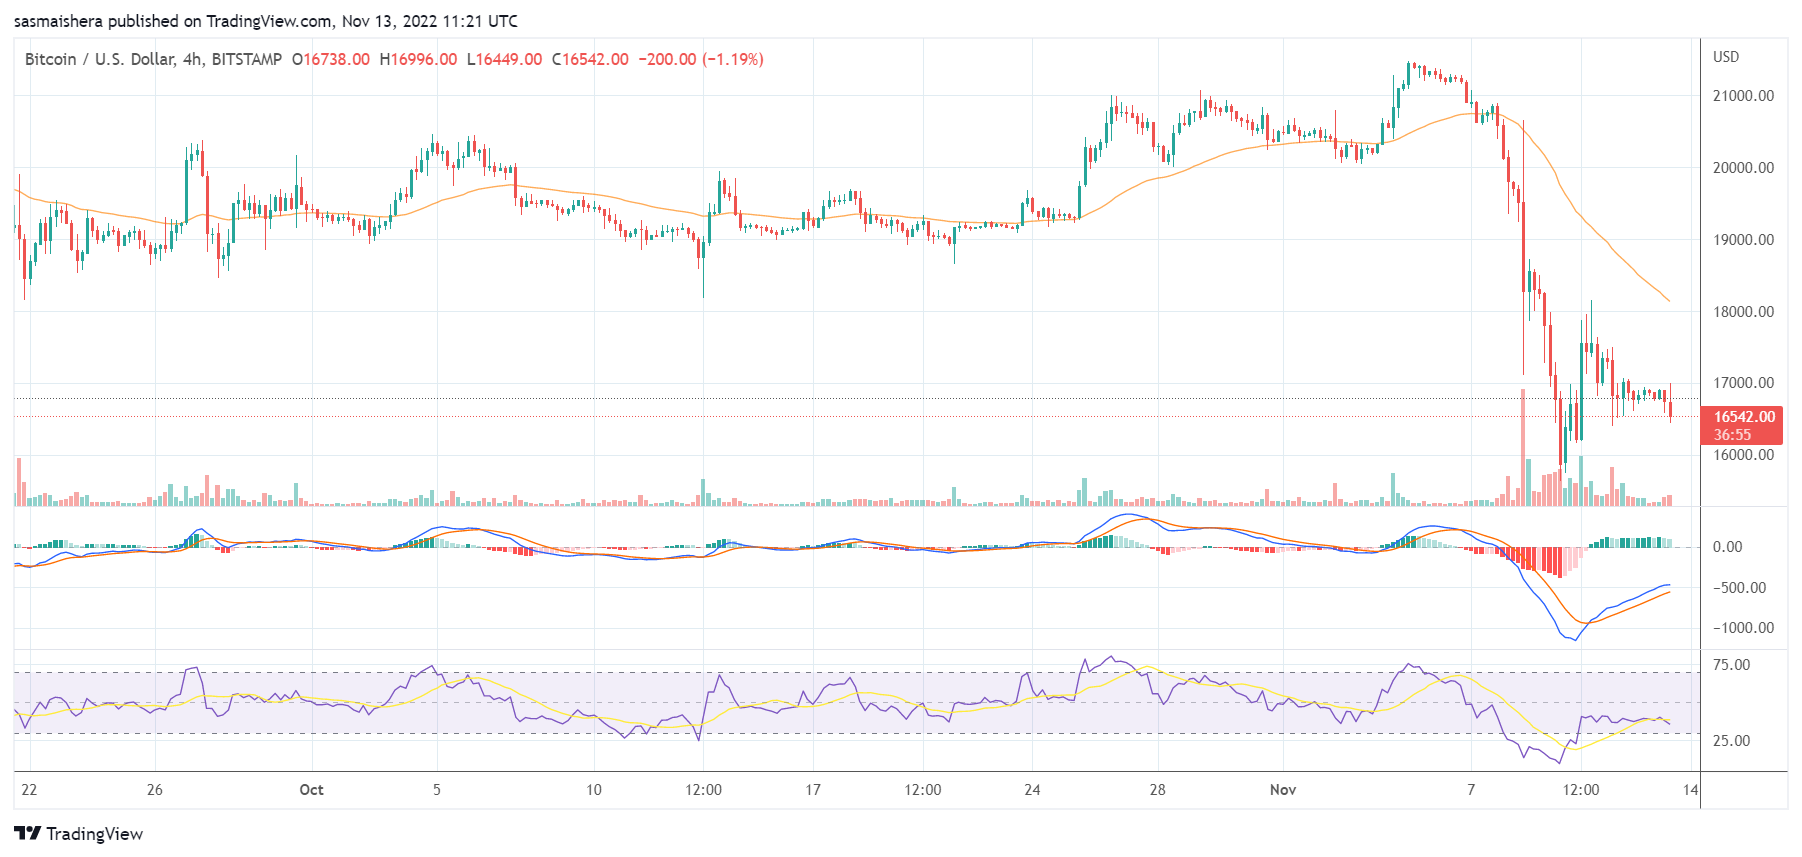
The MACD line is deep within the negative territory, indicating that the bulls might not regain control for a while. The 14-day relative strength index of 35 shows that Bitcoin could enter the oversold region if the bearish trend continues.
At press time, BTC is trading at $16,620 per coin, down by more than 1% in the last 24 hours. With the bears still in control, BTC could dip below the $16,004 support level in the near term.
In the event of an extended bearish run, Bitcoin could trade around the $15,669 level for the second time in a week.
Where to buy Bitcoin now
eToro
eToro offers a wide range of cryptos, such as Bitcoin, XRP and others, alongside crypto/fiat and crypto/crypto pairs. eToro users can connect with, learn from, and copy or get copied by other users.
Bitstamp
Bitstamp is a leading cryptocurrency exchange which offers trading in fiat currencies or popular cryptocurrencies.
Bitstamp is a fully regulated company which offers users an intuitive interface, a high degree of security for your digital assets, excellent customer support and multiple withdrawal methods.
-

Shiba Inu (SHIB/USD) continues to struggle. Here is the price outlook

Shiba Inu (SHIB/USD) has added another zero after the decimal point for its current price. As of press time, the cryptocurrency was exchanging hands at $0.00000996, losing 3% in the week. A brief technical outlook shows the meme token is back to its June and July lows. There are positive things, however, to note.
As the Shiba community ponders when the SHIB Metaverse will come to fruition, the developers are keeping hopes alive. The team has unveiled a new concept art for its virtual reality world, dubbed Dunes.
Of course, it’s not the first time the developers have released concept art. The previous ones included the WAGNI Temple, the Rocket Pond, and Canyon. The Shiba Inu community may be less excited about the concept art, going by the lack of enthusiasm around SHIB’s price. However, it at least shows the work in progress for Shiba Inu’s virtual reality world.
Meanwhile, the SHIB burn rate is also on the rise. In the last 24 hours, over 45 million tokens were burned. That represented a 1,860% spike in burn for the meme cryptocurrency. The burning mechanism aims to tame falling SHIB prices. However, investors are hearing none of it. Some are even questioning whether SHIB will survive till the end of 2023. How can that be?
The community is concerned that despite the introduced burn mechanism, SHIB continues to decline. The lack of real utility of the token has been blamed for limited network activity and growth.
SHIB continues to slide below moving averages
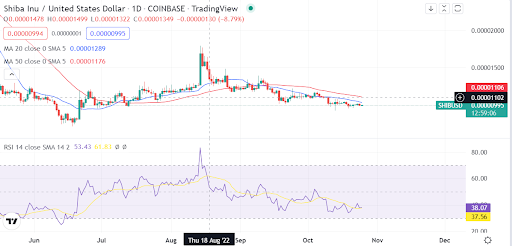 Source – TradingView
The technical outlook is bleak for SHIB. Despite sitting at support, sellers are active at the current price. An RSI reading of 38 suggests that there are more sellers, and we are yet to get to the oversold zone. The price momentum is weak as moving averages continue to offer resistance above.
What next for SHIB?
The technical indicators and price momentum pits SHIB back to the June lows of $0.0000072.
However, with the extremely low valuations, more utility for the meme token could allow SHIB to surprise markets. That’s what SHIB is known for – making parabolic moves at the slightest of positive news. Consequently, whereas there is a risk for SHIB, it also carries an unprofaned opportunity.
Where to buy SHIB
eToro
eToro offers a wide range of cryptos, such as Bitcoin, XRP and others, alongside crypto/fiat and crypto/crypto pairs. eToro users can connect with, learn from, and copy or get copied by other users.
Bitstamp
Bitstamp is a leading cryptocurrency exchange which offers trading in fiat currencies or popular cryptocurrencies.
Bitstamp is a fully regulated company which offers users an intuitive interface, a high degree of security for your digital assets, excellent customer support and multiple withdrawal methods.