Tag: data

  • Bitcoin price surges to $26K as bulls react to CPI data

    Bitcoin price surges to $26K as bulls react to CPI data

    • Bitcoin price hit highs of $26,553 on Coinbase, with 16% upside in 24 hours.
    • US inflation data showed CPI rose 6% in the past 12 months in February.
    • On-chain data suggests BTC price could rally to $30,000 in the short term.

    Bitcoin rose sharply on Tuesday, breaking past $26,000 as the crypto market reacted positively to the latest Consumer Price Index (CPI) data by the US Department of Labor.

    Bitcoin breaks $26k amid market reaction to CPI data

    According to data from TradingView, the price of Bitcoin spiked 16% to highs of $26,553 on the cryptocurrency Coinbase

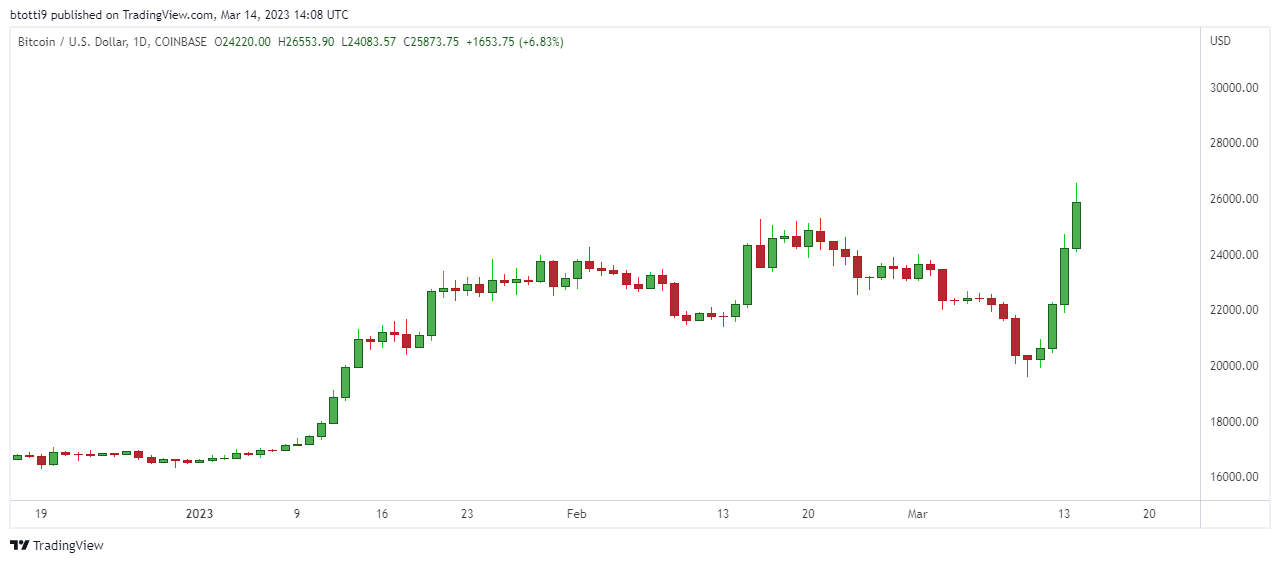
    Bitcoin price rallied above $26,000 on Tuesday. Chart courtesy of TradingView

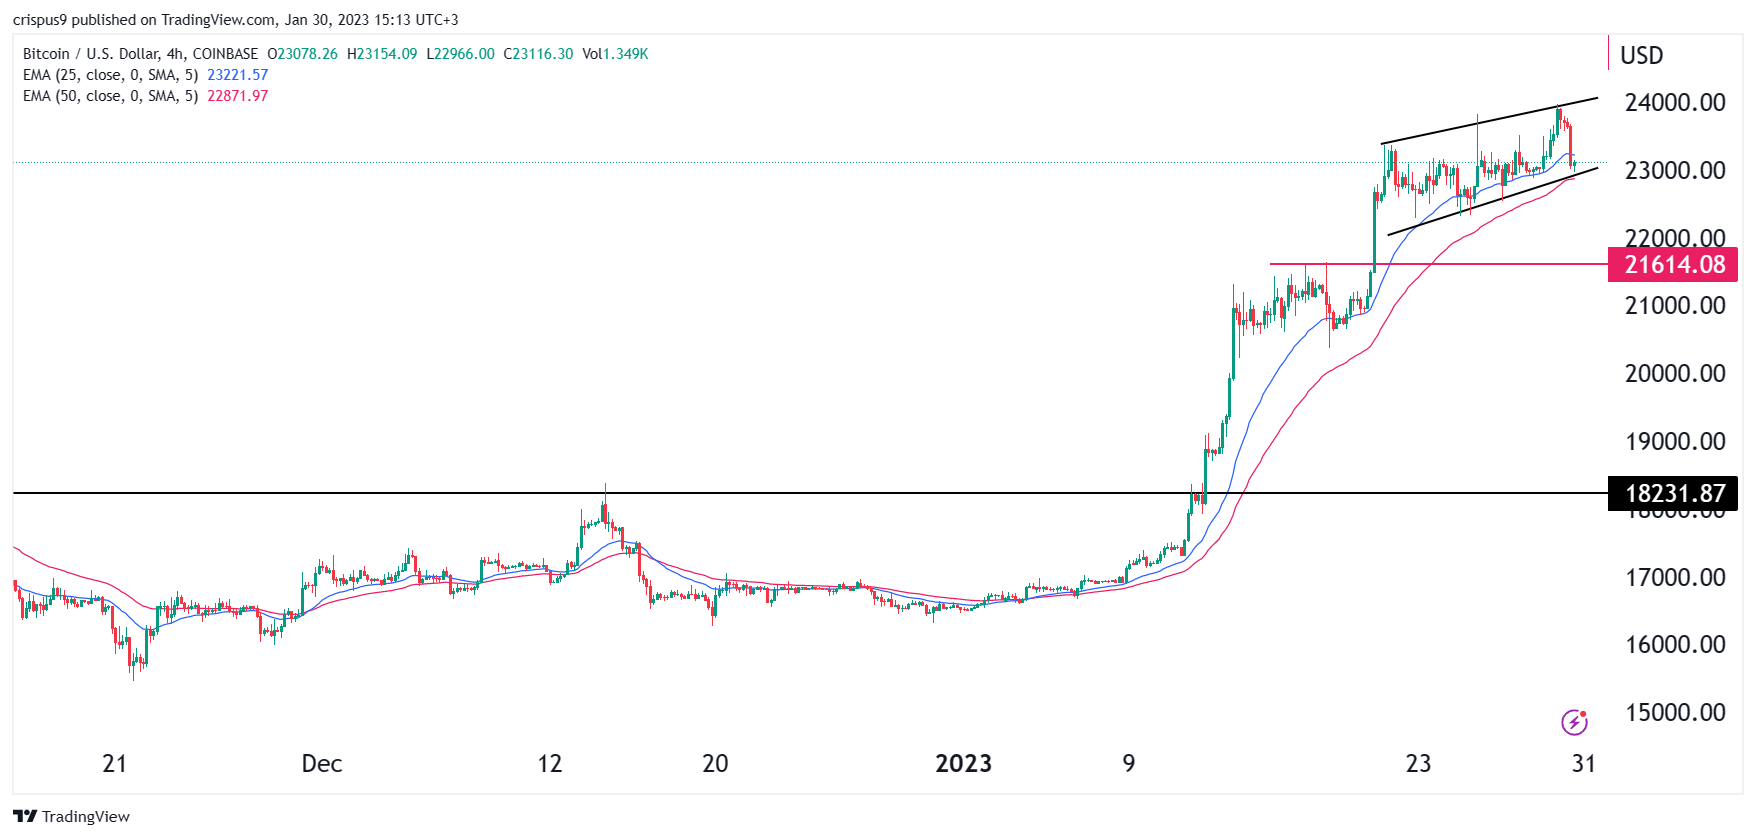
     As noted yesterday, BTC price soared from lows of $20,000 to break above $24,000 – the bullish sentiment buoyed by the US government’s actions in the wake of Silicon Valley Bank’s collapse.

    On-chain data shared by market research platform IntoTheBlock shows Bitcoin faces minimal selling pressure to around $30,000.

    The aggregate market data from CoinGecko showed the total crypto market cap has surged by more than 14% as major altcoins like Ethereum and BNB hit highs of $1,750 and $315 respectively.

    Per the US Department of Labor, CPI rose 0.4% in February and 6% over the last year to align with market expectations. Notably, the data showed US inflation had increased at its slowest pace since September 2021. The core CPI, which strikes off the more volatile food and energy items, increased by 5.5% to also fall within expectations.

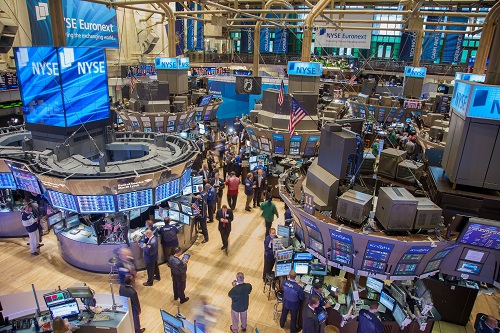
    Stocks also opened higher on Tuesday, with the S&P 500 up 1.5% as investors turned attention to the Federal Reserve and its interest rates path. Market analyst Carl Quantanilla points out this scenario.

    The Dow Jones Industrial Average had added 320 points, or 1%, while the Nasdaq Composite was up 1.7% at 9:50 am ET.


    Source link

  • Bitcoin touches $23k support as stocks fall on hot PCE data

    Bitcoin touches $23k support as stocks fall on hot PCE data

    • Bitcoin and crypto prices fell as markets reacted to January PCE data.
    • The Fed’s favourite inflation measure came in hot, jolting markets lower with S&P 500 declining nearly 1.4% and Dow dropping about 400 points.
    • Crypto analyst Rekt Capital says BTC price remains in positive territory as long as bulls hold support above $23k.

    Bitcoin price continues to struggle after the rejection from the $25k resistance, but today’s dip comes as the market reacts to hotter-than-expected Personal Consumer Expenditure (PCE) data.

    As stocks got whacked on Friday, with the S&P 500 falling nearly 1.5% and the Dow Jones Industrial Average dropping 400 points, BTC price retreated under $24k to hit lows of $23,130 across major exchanges.

    Crypto, Wall Street drops on CPE data

    The CPE is the Federal Reserve’s most preferred inflation measure and sentiment has shifted on the latest data release as investor jitters fill up again. 

    The Fed uses the CPE price index to assess how sharply prices have risen within the US economy, and data shows prices spiked 0.6% in January and 5.4% year-over-year. Core CPE also came in hot, at 4.7% against the forecast 4.3% to suggest inflation remains an issue.

    Inflation remains too high. We’re going to have to do more to get back to 2%,” said Cleveland Federal Reserve President Loretta Mester. “I see a little more impetus in the inflation measures than my colleagues. We’re going to have to bring interest rates above 5% and hold there for a time,” she added during an interview with CNBC.

    Bitcoin price outlook

    The reaction on Wall Street also cascaded into the crypto market, with BTC price declining below a key support line recently highlighted as a “confluent support zone.” The uncertainty around the Fed’s interest rates saw most stocks scorched in early trades, a scenario also replicated in crypto with Ethereum dropping below $1,600.

    For Bitcoin’s short-term price outlook, popular crypto trader and analyst Rekt Capital says bulls could remain in control if BTC holds above $23k. However, a bearish outlook would materialize if price breaks lower.

    BTC Weekly retest of the confluent area that is the Lower High and Monthly Range High resistance is now in progress. Price needs to hold here for the retest to be successful. However, Weekly Close below this area would be a bearish sign,” the analyst noted.


    Source link

  • Bitcoin, stocks swing as markets react to CPI data

    Bitcoin, stocks swing as markets react to CPI data

    • Bitcoin price was trading sideways after hitting highs of $22,300, with major US indexes also down.
    • The markets’ reaction comes after hotter-than-expected inflation data for the first month of 2023.
    • US CPI rose 0.5% over the month and 6.5% year-over-year.

    Bitcoin was holding just above $22,000 at around 11:00 am ET, with the flagship cryptocurrency having swung from highs of $22,300 as the broader crypto market mirrored Wall Street following Tuesday’s US inflation data.

    Across crypto, Ethereum first ticked closer to $1,570 across major exchanges, rising as much as 5% before the upside cooled to see ETH trade near $1,540 at the time of writing. A similar picture held for Binance Coin, with BNB nearing $300 with about 3.5% in gains before shedding some of the gains.

    The action across US stocks also had the major indexes in the green premarket, before broader reaction to consumer price data released on Tuesday saw the major indexes trade lower.

    The S&P 500 rose nearly 0.7% but had flipped negative after the latest Consumer Price Index (CPI) data from the US Bureau of Labor Statistics showed inflation picked up over the past one month after consecutive months of declines. The S&P 500 was down 0.6% at the time of this report.

    The outlook was similar for the Dow Jones Industrial Average and the Nasdaq Composite, which were down about 0.8% and 0.6% respectively.

    Markets react to January CPI data

    On Tuesday morning, the US government’s data on inflation showed consumer prices rose 0.5% in January and 6.4% over the past twelve months, higher than the forecast 6.2%. 

    Even for the Core CPI, which leaves out the more volatile food and energy components, the readings were 0.4% in January and 5.6% year-over-year.

    The data thus showed inflation had picked up in the first month of 2023, coming in hotter than economists expected, with Wall Street reacting lower on the news as investors weigh what this means for the Fed’s interest rates path. Market observers say this could point to a higher for longer path that the Fed has previously pointed out.

    Tim Seymour, the CIO of Seymour Asset Management certainly thinks this could be on the cards now.


    Source link

  • Bitcoin price prediction ahead of Fed decision, NFP data

    Bitcoin price prediction ahead of Fed decision, NFP data

    • Bitcoin price declined slightly on Monday after nearing the resistance at $24,000.

    • Macro factors will be the key drivers for Bitcoin and other asset prices.

    • Consumer confidence, Fed decision, and NFP data will be in focus.

    Bitcoin price pulled back slightly on Monday as investors started focusing on the key economic data from the US and the upcoming Fed decision. The BTC price was trading at $23,125, which was a few points below this year’s high of near $24,000.

    Fed decision and NFP data

    Macro data and events will be the key things that will drive the price of Bitcoin – and other assets this week. On Tuesday, the Conference Board will publish January’s consumer confidence data. This is an important figure that is watched closely by investors and policymakers because of the vital role that consumer spending plays in the economy. Economists expect that confidence continued rising in January as inflation eased.

    The US consumer confidence data will be followed by the first FOMC decision of the year. With inflation easing and stocks and crypto prices rising, analysts believe that the Fed will deliver the second consecutive 0.50% hike. It will be extremely hawkish in a bid to reduce the enthusiasm among investors and traders.

    In theory, an extremely hawkish tone will be bearish for the price of Bitcoin. Historically, crypto prices tend to rally in periods of easy money policies. However, in reality, there is a possibility that Bitcoin will rise even if the Fed sounds hawkish. That’s because investors may not believe the tone of the FOMC officials.

    The Fed will likely guide to two more 0.50% rate hikes followed by a pause on interest rates as it seeks to lower inflation.

    Finally, Bitcoin price will react to the latest non-farm payrolls (NFP) scheduled for Friday this week. These numbers will be important because they will guide the Fed in making its future decisions. Strong jobs numbers mean that the bank will continue sounding more hawkish in the coming meetings. 

    Bitcoin price prediction

    BTC/USD chart by TradingView

    The BTC price has been in a strong bullish trend in the past few weeks. It has formed an ascending channel shown in black. The coin has moved above all moving averages. Further, it has moved above the important support at $21,615, the highest point on January 18. 

    Therefore, there is a possibility that Bitcoin will pull back slightly ahead of the Fed decision and then rebound after the decision. As such, the coin could retest the support at $22,000 and then rise to $25,000.

    Source link

  • The Sandbox (SAND/USD) falls further, but you would want to buy based on this Santiment data

    The Sandbox (SAND/USD) falls further, but you would want to buy based on this Santiment data

    • The Sandbox token trades at the lowest level in the year

    • Santiment data indicates SAND is at “opportunity zones”

    • We expect the Sandbox token price to sink further until the bear market subsides

    It continues to be lonely in the metaverse. With few fundamentals and developments coming up, investors are still dumping the metaverse-related tokens. In the past week, the token of the popular metaverse platform, The Sandbox (SAND/USD), has lost almost a quarter of its value. Take into account that this cryptocurrency was already trading at exceedingly depressed levels. SAND now trades at $0.44, although Santiment data gave an “opportunity” signal. Would you take it?

    Santiment is a crypto analytics firm known for data feeds and updates. According to the firm, tokens of metaverse platforms, including SAND, are trading at “opportunity zones.” The analytics firm uses the market-value-to-realised value or MVRV to make the judgement. MVRV relates an asset market cap and compares it with the realised capitalization. The resulting ratio is used to identify overbought and oversold conditions. 

    Using MVRV, Santiment says the Sandbox token, in addition to Decentraland’s MANA, is at historical pain points. These are underbought and semi-underbought zones where big bounces occur. A technical outlook shows RSI flushing overbought conditions on a clear downtrend.

    SAND on a downtrend as it touches a new low in the year

    SAND/USD Chart by TradingView

    From the technical outlook, SAND trades at the lowest level in the year. The bottom price was last reached in July 2021. The cryptocurrency is currently oversold, with the RSI reading now at 30. SAND maintains a clear downtrend.

    Is a rebound likely for SAND?

    It could be too soon to think of buying SAND. Despite the Santiment data and RSI pointing to underbought and oversold conditions, respectively, the price is bearish.

    Again, the market sentiment remains bearish. Since SAND trades alongside the broader market, it could be too early to make a bull call. SAND could find support next at $0.36.

    Where to buy SAND

    eToro

    eToro offers a wide range of cryptos, such as Bitcoin, XRP and others, alongside crypto/fiat and crypto/crypto pairs. eToro users can connect with, learn from, and copy or get copied by other users.


    Buy SAND with eToro today

    Bitstamp

    Bitstamp is a leading cryptocurrency exchange which offers trading in fiat currencies or popular cryptocurrencies.

    Bitstamp is a fully regulated company which offers users an intuitive interface, a high degree of security for your digital assets, excellent customer support and multiple withdrawal methods.


    Buy SAND with Bitstamp today

    Source link

  • Normalcy returning to crypto markets, on-chain data shows

    Normalcy returning to crypto markets, on-chain data shows

    Over the last few months, the crypto market has largely been pretty serene. Bitcoin had been in crab motion around $20,000 for quite a while, as it plodded along while waiting for the wider macro conditions to make a move.

    I wrote in late October to be cautious around this price action, and that Bitcoin could be one bearish event away from an aggressive downward wick. What I did not except was that event to be shake crypto to its bones, as one of the blue-chip companies in the space, FTX, inexplicably descended into insolvency.  

    This obviously shook markets. Last week I assessed how the flow of bitcoins out of exchanges has been fierce, as people’s trust in these central entities to store their coins was understandably at an all-time low. 

    In fact, I saw yesterday that 200,000 bitcoins have left exchanges since the FTX implosion. But now, the data suggests that the market is calming down a bit. And again, it seems like we may enter crab mode until macro provides an impetus one way or another – or an unexpected crypto-specific development comes out of the woodwork. 

    The first way to demonstrate that the dust is beginning to settle is by looking at Bitcoin’s volatility. This obviously spiked as Sam Bankman-Fried’s “games” were revealed to the public. But after remaining elevated throughout the last few weeks, it has fallen back down to more standard levels in the last few days.  

    Another way to view this is the falloff in large transactions. These transactions (defined as greater than $100,000) jumped up in the few days around the bankruptcy, but have fallen gradually since, back to the same levels we have seen throughout much of 2022.

    Another useful metric to track is the net realised profit or loss of moved coins. This spikes in times of crisis as the price abruptly drops, before typically coming back towards the $0 mark as the markets calm down.

    The below chart shows this well, with trades on November 9th netting an ugly $2 billion loss, before November 18th then topped this with a $4.3 billion loss. That is lower than the worst mark post-Celsius crash ($4.2 billion loss) and Luna ($2.5 billion loss).

    This reflects the continued downward pressure on Bitcoin’s price, but the trend has bounced back up to close to zero again.

    FTX was a central part of the ecosystem, and its bankruptcy understandably rocked the market. As I wrote recently, this contagion is not over.

    Yet data from the last week or so suggests that normalcy is returning to the crypto markets. Going forward, it may tread water again for a while. With China opening up post-lockdown, the latest inflation numbers imminent and the EU ban on Russian crude imports, macro certainly has a lot going on. 

    Crypto investors will just need to hope that the crypto-native scandals are out of the way for the time being.  

    Source link