Tag: decline

  • Bitcoin slips below $104K on ETF outflows, decline fears mount

    Bitcoin slips below $104K on ETF outflows, decline fears mount

    Bitcoin drops below $104k amid fears of further decline as ETF outflows kick in

    • Bitcoin falls below $104K amid heavy ETF outflows.
    • Key resistance at $106K–$107K amid rebound attempts.
    • Whale selling is on the rise as retail buys surge.

    Bitcoin (BTC) has started June on the back foot, dipping below $104,000 to a low of $103,833.57 on June 2 as investors react to a fresh wave of ETF outflows and technical uncertainty.

    Despite closing May with its highest monthly close ever near $105,700, the market mood has quickly shifted, driven by signs of distribution from whales and institutional sellers.

    Bitcoin ETF outflows outweigh inflows

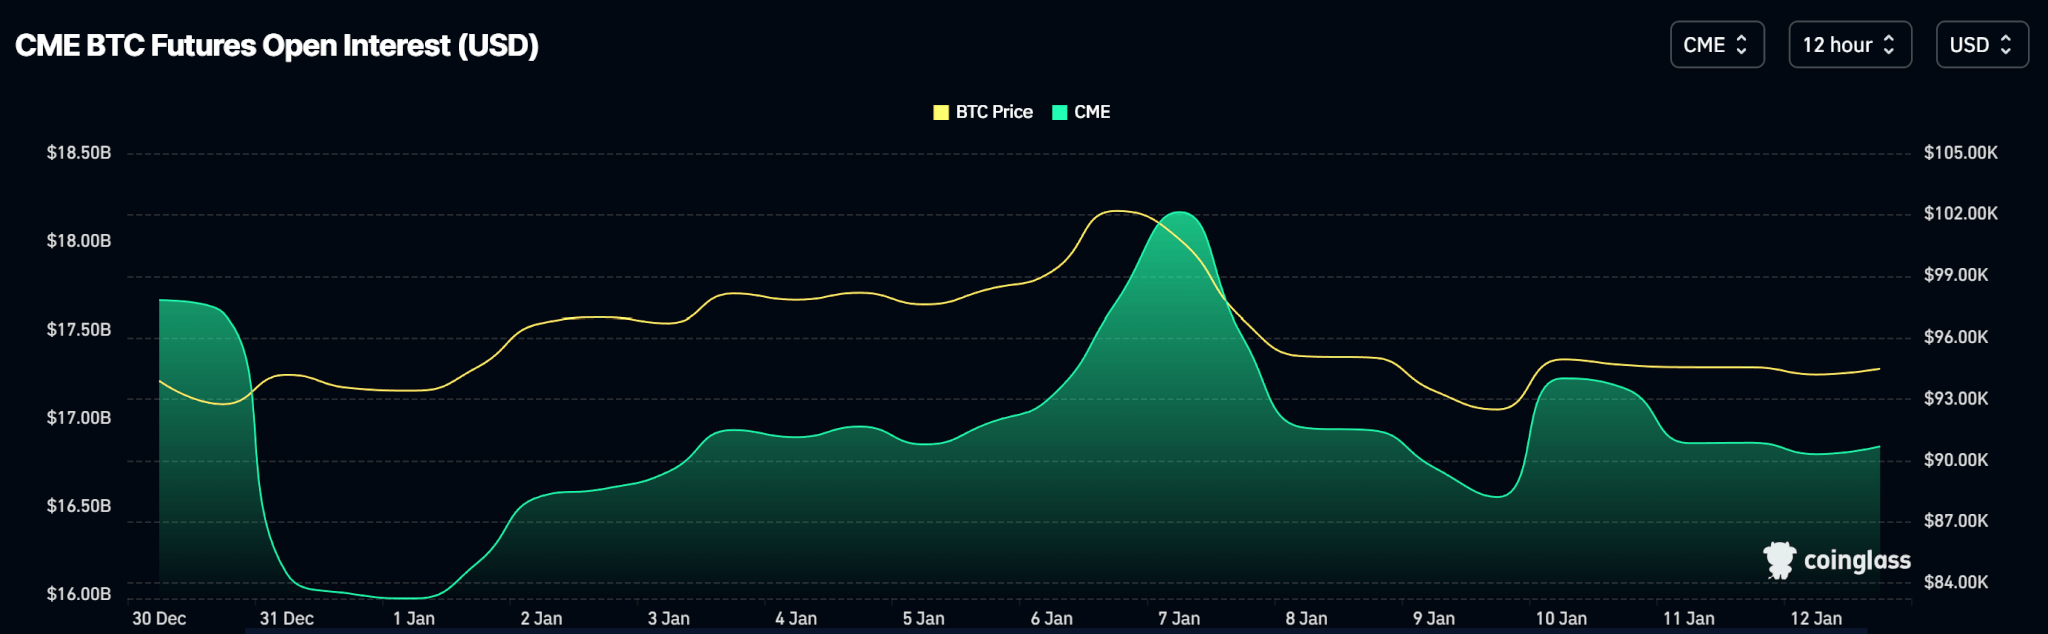
    The six-week streak of inflows into US spot Bitcoin ETFs came to an abrupt end on May 30, when funds collectively recorded a staggering $616.22 million in outflows according to Coinglass data.

    Bitcoin ETF outflows

    This reversal marks a sharp deviation from previous weeks, where ETF flows had reinforced the bullish narrative and contributed to Bitcoin’s 11% monthly gain.

    BlackRock’s IBIT, the largest fund in the cohort, leads the exit with $430.82 million in withdrawals, even though it still maintains over $69 billion in assets under management.

    Fidelity’s FBTC and ARK 21Shares’ ARKB follow suit with $113.71 million and $120.14 million in outflows, respectively, underscoring the broad-based nature of the sell-off.

    Although the total cumulative inflows across all ETFs remain positive at $44.37 billion, the sudden withdrawal suggests that investors are now acting cautiously amid growing macroeconomic and technical risks.

    Bitcoin price pullback

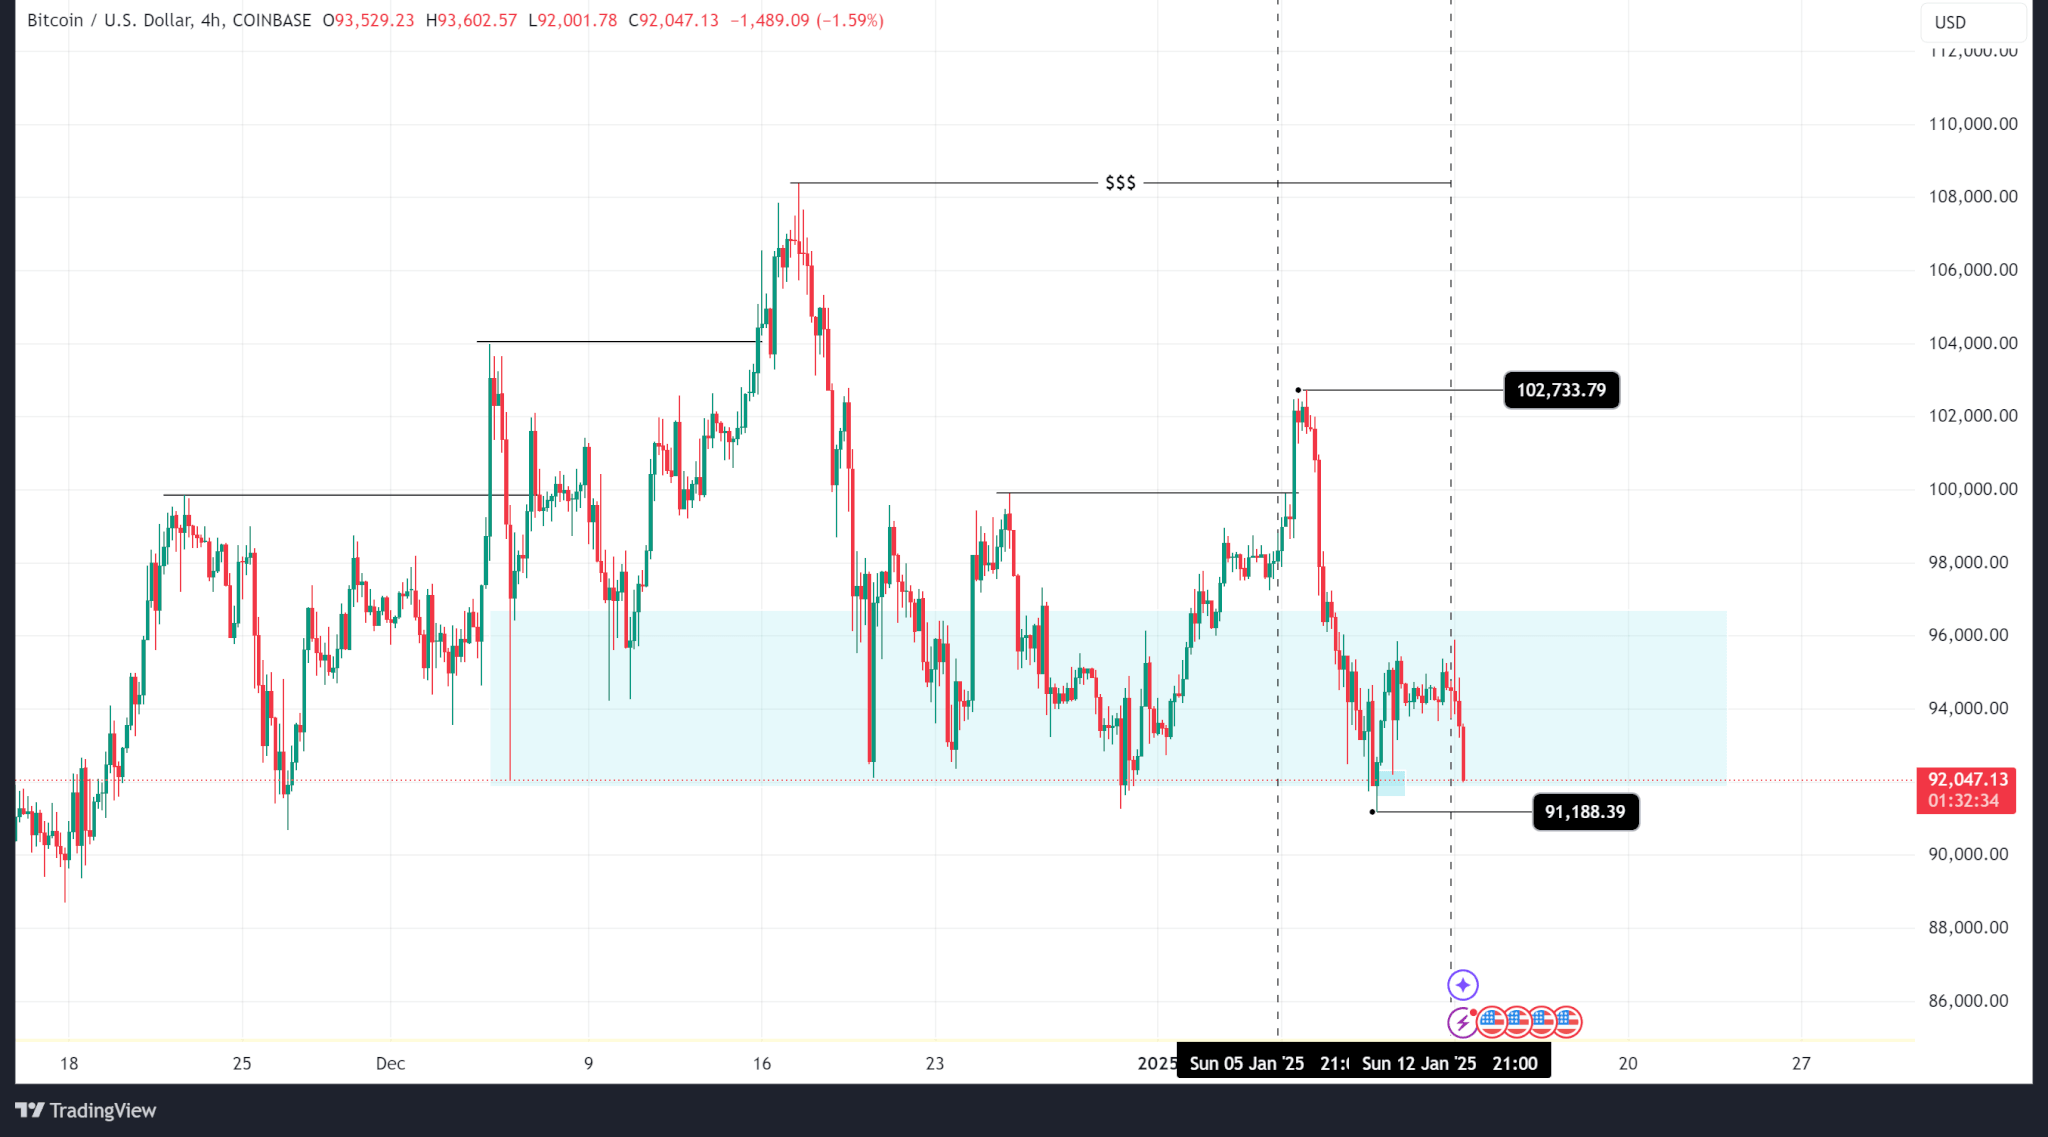
    On the price charts, Bitcoin’s recent pullback from $109,000 to $103,833 has brought it below the 0.786 Fibonacci retracement of the rally to its all-time high of $112,000.

    That dip reflected heavy profit-taking into the end of May, exacerbated by the rising influence of bearish technical patterns such as the death cross on the 4-hour chart.

    During Monday’s European session, BTC briefly rebounded to $105,500 but quickly stalled near $105,800 — a zone that combines the 0.618 Fibonacci level with the 100 EMA, forming a critical confluence of resistance.

    While the 20 EMA has been reclaimed, the price continues to struggle beneath the 50 EMA at $106,000, reinforcing the view that bulls face an uphill task in regaining upward momentum.

    If Bitcoin fails to break through the resistance between $106,000 and $107,000, the downside pressure could intensify, possibly dragging the asset back to the recent low near $103,200.

    Adding to the volatility is James Wynn, the controversial high-leverage trader who once again opened a $100 million BTC long at 40X leverage on Hyperliquid, with a liquidation price precariously close at $101,999.

    Wynn’s repeated attempts to go long on BTC have not only ended in substantial floating losses but have also fueled wider speculation-driven activity on the Hyperliquid platform.

    After another failed attempt by the market to liquidate him, Wynn has announced that he has decided to give perp trading a break, further amplifying concerns of exaggerated leverage in the market.

    On-chain metrics are sending diverging signals

    Meanwhile, on-chain metrics show a divergence in behaviour between whales and retail traders, with large holders reducing exposure steadily since BTC crossed $81,000.

    Retail participants, by contrast, are showing signs of buying the top, a dynamic that historically aligns with periods of short-term market corrections.

    Santiment flagged increased whale activity around the May 22 peak, noting that similar past patterns typically signal local tops rather than sustainable breakouts.

    Even though Bitcoin remains up 11% over the past month, relative strength index (RSI) signals have turned bearish, flashing clear divergence as price attempts to recover above key resistance zones.

    At the same time, broader macro conditions continue to cast a shadow, with traders watching closely for signals from the Federal Reserve amid slowing job growth and cooling inflation.

    The falling US Dollar Index could provide a short-term tailwind for Bitcoin, but analysts remain divided on whether current levels represent a springboard for a fresh rally or a prelude to further losses.

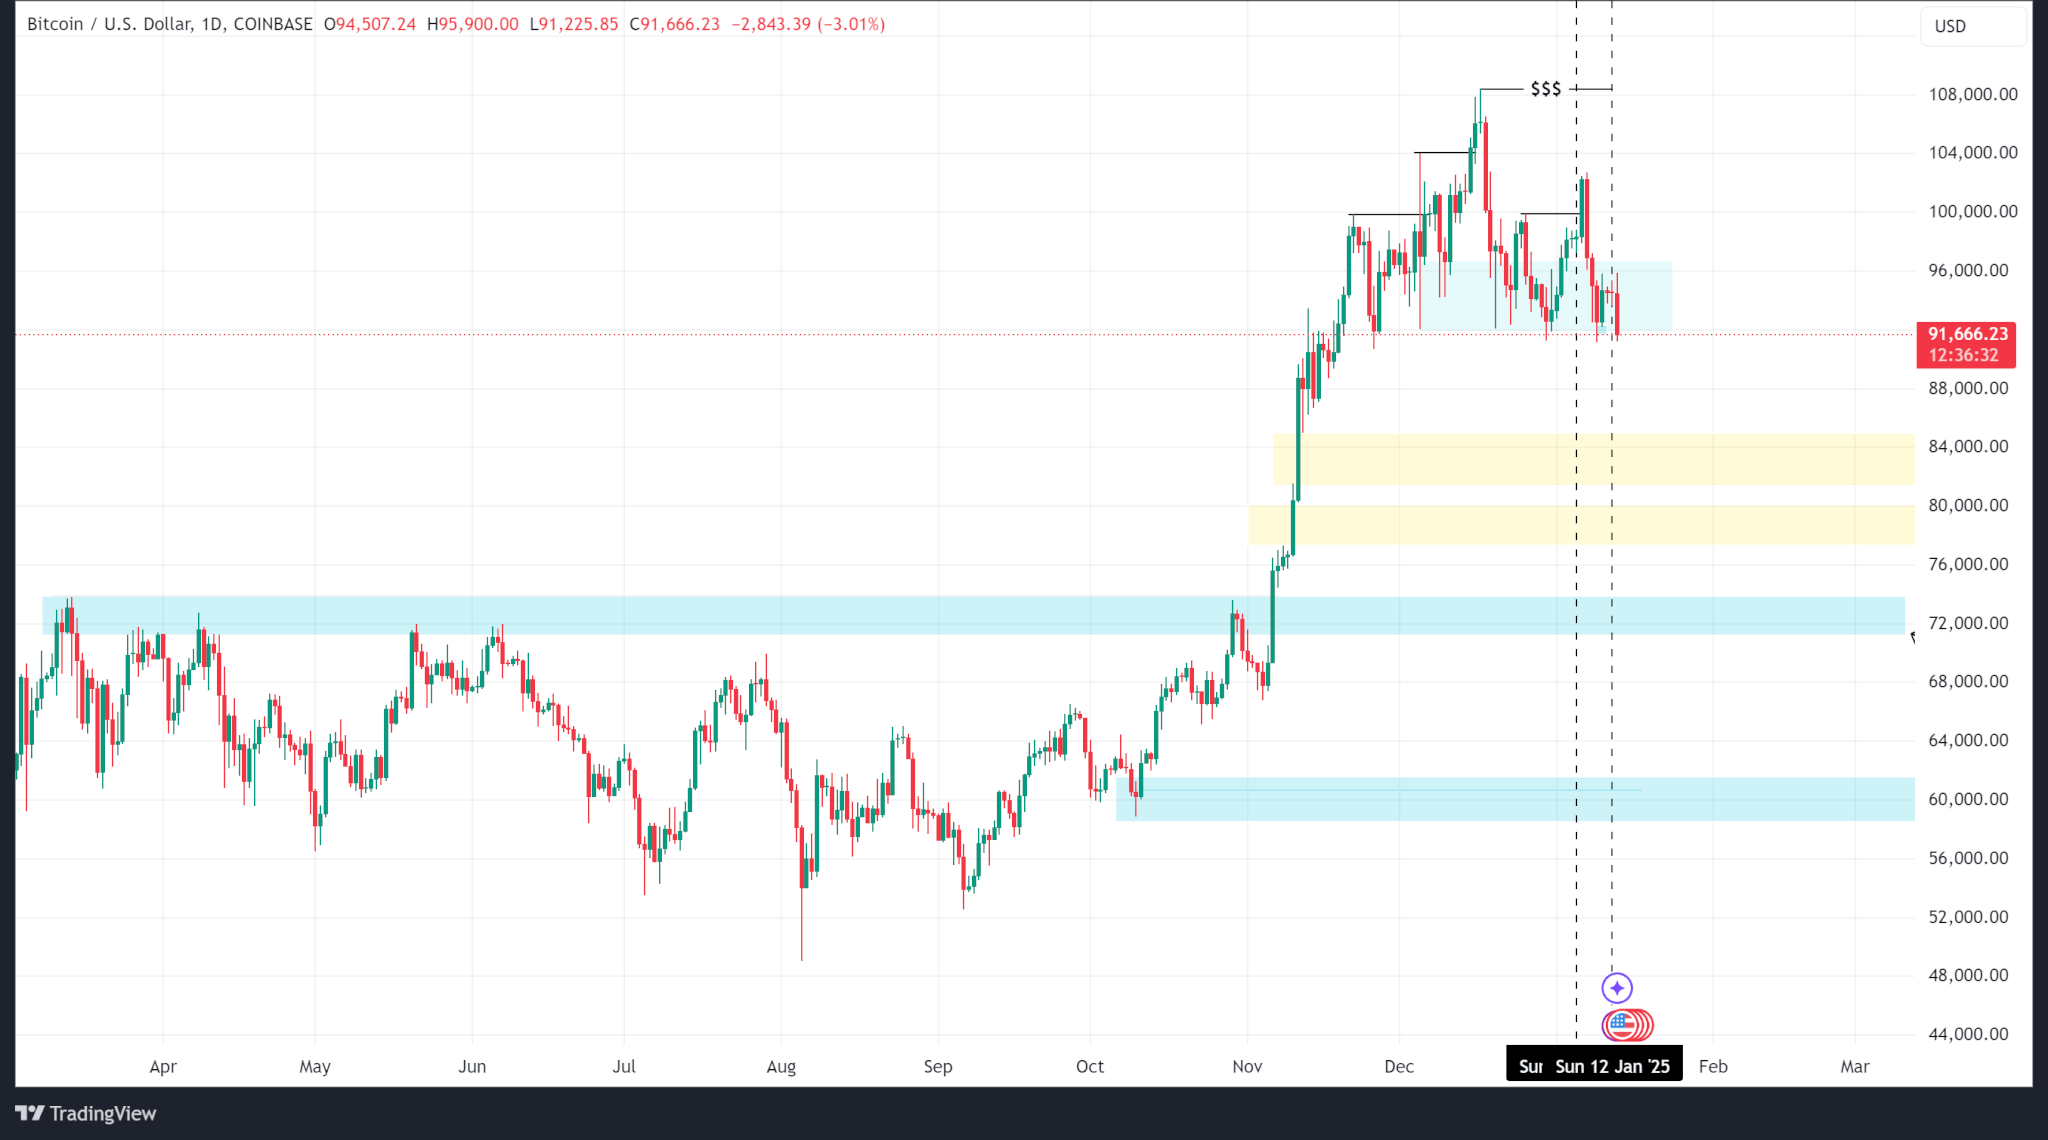
    Data from Glassnode’s MVRV ratio shows BTC is trading between critical bands that historically precede local tops, with the +1σ level near $119,400 acting as a psychological ceiling for many profit-takers.

    While some traders anticipate a bounce from the $100K support to as high as $113K, the risk of a deeper correction continues to dominate sentiment across both spot and derivative markets.

    As June unfolds, all eyes will remain fixed on ETF flows, macro indicators, and whether Bitcoin can decisively reclaim the $106,000–$107,000 band to avoid slipping further into bearish territory.


    Source link

  • Crypto market decline accelerates in Q1 with $633.5B in losses

    Crypto market decline accelerates in Q1 with $633.5B in losses

    • Bitcoin’s market share rose to 59.1% despite falling 11.8%.
    • Ethereum’s 2024 gains wiped out in Q1 2025.
    • DeFi TVL fell 27.5% across multichain platforms.

    The global cryptocurrency market started 2025 with optimism, fuelled by expectations of favourable policy shifts under Donald Trump’s presidency and a strong rally across meme coins.

    But those hopes have since been dashed. According to CoinGecko’s latest quarterly report, crypto’s total market capitalisation fell 18.6% in Q1 2025, wiping out $633.5 billion in value.

    Trading volumes also took a hit. The report shows that average daily trading volume fell 27.3% compared to the previous quarter. Spot trading on centralised exchanges declined 16.3%, a drop that was partly attributed to the Bybit hack earlier this year.

    Despite signs of strength in early January, recession concerns and fragmented investor interest led to a broad sell-off across digital assets.

    Bitcoin outperforms altcoins but still falls 11.8%

    Bitcoin retained its dominance over the broader market in Q1, accounting for 59.1% of the total crypto market cap — its highest level since 2021.

    This shift highlights how investors have treated Bitcoin as a relatively more stable asset compared to altcoins during uncertain periods.

    However, Bitcoin itself was not immune to losses. It declined 11.8% during the quarter and underperformed traditional safe havens like gold and US Treasury bonds.

    The report also noted that Trump’s newly imposed tariffs triggered volatility in the bond market, impacting yields — a key metric closely linked to digital asset flows.

    Ethereum saw an even sharper reversal. It gave up all of its 2024 gains, returning to levels last seen before its Shanghai upgrade. The report attributed this trend to declining decentralised finance (DeFi) activity and persistent concerns around gas fees and scalability.

    DeFi TVL and Solana activity decline sharply

    Multichain DeFi protocols suffered significantly, with total value locked (TVL) falling 27.5% over the three-month period.

    Solana, which led the decentralised exchange (DEX) trading space during the meme coin frenzy in January, saw its own TVL drop by more than 20%.

    CoinGecko’s data indicates that market excitement around Trump-themed tokens, particularly the TRUMP coin on Solana, sparked a temporary spike in transaction volumes. However, this activity failed to sustain investor interest beyond January.

    The LIBRA scandal, which emerged shortly after, added further pressure on altcoin sentiment and liquidity.

    Despite these setbacks, Bitcoin exchange-traded funds (ETFs) recorded $1 billion in fresh inflows in Q1.

    But the total assets under management (AUM) across these ETFs still fell by nearly $9 billion due to declining prices, highlighting the gap between investment inflows and market returns.

    Structural concerns deepen

    While some data points suggested limited resilience, nearly every positive trend in the report was accompanied by a downside risk.

    The report shows that centralised exchanges, stablecoin volumes, and DeFi applications all registered lower activity in February and March. Many projects lost traction as macroeconomic concerns mounted and investor caution grew.

    CoinGecko noted that the first quarter of 2025 represents one of the most challenging periods for crypto since the FTX collapse in late 2022.

    The report reflects broader market concerns that the crypto sector, despite structural improvements in infrastructure and compliance, remains deeply vulnerable to global economic shocks.

    As recession fears take hold and regulatory uncertainties continue to loom in major markets, the path forward for crypto in the coming months remains highly uncertain.

    Although Bitcoin’s rising market share signals a flight to perceived safety, the broader market may need more than optimism and meme coin rallies to recover from this quarter’s losses.

    Source link

  • Weekly price analysis: prices decline on risk-off sentiments

    Weekly price analysis: prices decline on risk-off sentiments

    • The crypto market trended lower last week, driven largely by risk-off sentiments on newly released Fed meeting notes and economic data
    • The Fed expressed caution around inflation, especially as President-elect Donald Trump’s policies will kick in after his inauguration on January 20
    • Meanwhile, spot crypto exchange-traded funds (ETFs) logged outflows from Wednesday, January 8

    Bitcoin

    Bitcoin’s price logged a negative week falling from a high of $102,733 to a low of $91,188 before eventually closing at $94,547.

    Technical analysis shows a break above the last lower high and a push back down into the H4 demand zone, which means that although the price took a bearish turn, it is still in overall bullish territory.

    BTC/USD Chart by TradingView

    Much of this bearish sentiment is driven by bleak economic expectations. The US Federal Reserve meeting minutes, released on January 8, showed that the reserve bank is cautious about inflation it expects will follow President-elect Donald Trump’s policies.

    As such, the likelihood of continued rate cuts has dwindled, with some analysts seeing an end to cuts early this year. The market’s reaction reflects this updated risk-off sentiment.

    Bitcoin’s open interest chart shows a decline in open contracts between Wednesday and now. Open interest hit a weekly high on Tuesday at $18.16 billion on the CME, fell to a low on Thursday ($16.55 billion), and mellowed out the rest of the week.

    CME BTC Futures Open Interest (USD) Chart by Coinglass

    Meanwhile, spot Bitcoin ETFs logged outflows after the release of the Fed’s meeting minutes on Wednesday. Outflows totalled $718.20 million while inflows totalled $1.03 billion.

    Outlook

    Bitcoin’s price currently hovers around the bottom of the demand zone. If it breaks below, its price could be pushed down to $85,100 where a fair value gap could act as support.

    BTC/USD Chart by TradingView

    BTC trades at $91,622 as of publishing.

    Ethereum

    Ethereum’s price also logged a negative week, falling from a high of $3,744 to a low of $3,157 before closing at $3,236. ETH price action tested March 2024’s high of $4,089  in early December 2024, but failed to break above and has been logging lower lows since.

    ETH/USD Chart by TradingView

    Open interest dropped from a January 7 high of $3.50 billion and continued to decline until it was $2.63 billion as of this publication.

    CME ETH Futures Open Interest (USD) Chart by Coinglass

    Meanwhile, Ethereum spot ETFs logged a weekly net outflow of $186.00 million following risk-off sentiments in the market.

    Outlook

    As Ethereum’s price continues to trend lower, the next technical level that could provide support is the fair value gap at the $2,893 price level.

    ETH trades at $3,071 as of publishing.

    Solana

    Solana’s price fell from a weekly high of $223 to a weekly low of $181 before eventually closing at $188, logging a total loss of 12.53%. SOL continues to trend lower after failing to close above its all-time high of $260.

    Open interest data shows a steep fall from $1.89Bn on Binance on Jan. 7 to $1.58Bn on Jan. 10. As of this publication, OI levels have improved to $1.63Bn.

    Outlook

    The next technical support zone is at the $164 price level. However, although the order block is a support, it is a poor low that could be taken out even if price reverses from that zone.

    SOL trades at $176 as of publishing.

    Ripple

    Ripple’s price fared better last week, closing higher at $2.55 from $2.38 at the start of the week as price continued to log higher highs. Zooming out, the price continues to range between $1.90 and $2.90 as the market cools.

    Open interest rose on Bitget, the exchange with the highest XRP derivative trading volume, over the last week, supporting upward price movement as positive news around Ripple’s case with the SEC boosted sentiments.

    Outlook

    Ripple’s price is buoyed by news around the SEC’s lawsuit against its parent company, a case which could be thrown out with the outgoing administration.

    However, technical analysis shows that XRP trades at a premium and a pullback is expected. The most likely levels are the fair value gap at $1.75 and the order block at $1.46.

    XRP trades at $2.37 as of publishing.

    Source link

  • These altcoins are poised for growth amid recent Bitcoin decline causing $83M liquidations

    These altcoins are poised for growth amid recent Bitcoin decline causing $83M liquidations

    • Bitcoin’s recent dip below $40,000 triggered $83 million in liquidations.
    • Cardano (ADA) stands resilient, leading in development and boasting a diverse ecosystem.
    • Optimism (OP) gains momentum with the rising adoption of L2 solutions.

    The cryptocurrency market is navigating turbulent waters as Bitcoin’s recent price decline triggered nearly $83 million in liquidations. The impact of this downturn is reverberating across the crypto space, presenting challenges but also opportunities for certain altcoins.

    However, amid this chaos, altcoins like Cardano (ADA), Optimism (OP), and the new Memeinator (MMTR) meme coin are positioned for growth.

    Bitcoin price decline sparks $83M liquidations

    The crypto market witnessed a significant setback as Bitcoin’s price nosedived to $38,555 on Tuesday, triggering a cascade of liquidations totalling $83 million in the futures market.

    Analysts attribute this sharp decline to several factors, including the recent approval of spot Bitcoin ETFs by the SEC. Traders, seizing the opportunity for profits, engaged in a sell-off that further fueled the downward trend.

    Additionally, experts suggest a connection between the Bitcoin price decline and GBTC redemptions by the bankrupt crypto exchange FTX.

    Cardano (ADA) emerges strong amid market downturn

    While the broader market faces headwinds, Cardano (ADA) stands out with a surge in development activity, surpassing major players like Ethereum. With a bustling GitHub and a diverse ecosystem comprising 9.45 million projects and 6,332 unique tokens, ADA remains resilient.

    Trading within the range of $0.418 to $0.724, ADA’s 10-day Moving Average at $0.504 and 100-day Moving Average at $0.452 provide stability. Despite market challenges, Cardano’s innovative prowess positions it as a potential growth asset, drawing attention with relentless progress.

    Optimism (OP) gains momentum amid expanding adoption

    Optimism (OP) experiences a notable uptick in value driven by increasing adoption of its layer-2 (L2) solutions. Boasting over 936,000 addresses currently in the money, OP’s sharp focus on crafting efficient and scalable Ethereum solutions is paying off.

    Trading between $2.61 and $3.01, with support levels at $2 and $2.4, OP reflects a bullish trend. As the platform’s user base grows and infrastructure solidifies, Optimism remains poised for sustained growth in the competitive landscape of layer-2 solutions.

    Memeinator emerging as an intriguing meme coin player

    Amid these market fluctuations, Memeinator has emerged as an intriguing player, fueled by AI technology and a disdain for sub-par memes. The MMTR token presale has raised an impressive $3,887,372, nearing the $4 million mark across thirteen stages.

    The MMTR token is going for $0.0197 in the current presale stage and is expected to rise to $0.0208 in the next stage. With the current stage more than 90% sold out, investors are angling to have a stake in this intriguing meme coin. If interested in the project, you could as well visit the Memeinator presale website to purchase your share of the MMTR tokens.

    Memeinator’s approach involves leveraging AI insights and innovative products like the Memescanner and the Memeinator Game.

    Conclusion

    While the crypto market grapples with external factors, including the recent Bitcoin price decline and global economic challenges, altcoins like Memeinator (MMTR), Cardano (ADA), and Optimism (OP) could offer an alternative opportunity for crypto investors.

    However, as investors explore opportunities, caution is advised, especially in the case of emerging projects like Memeinator, where risks and uncertainties warrant careful consideration.

    Source link