Tag: DIP

  • Crypto update: Bitcoin ETFs see $300M inflow as investors ‘buy the dip’

    Crypto update: Bitcoin ETFs see $300M inflow as investors ‘buy the dip’

    Crypto update: Bitcoin ETFs see $300M inflow as investors 'buy the dip'

    • US Bitcoin ETFs saw nearly $300 million in net inflows on Tuesday.
    • The inflows snapped a two-week streak of redemptions from the products.
    • Fidelity’s FBTC led the way with $165.9 million, followed by Ark’s ARKB.

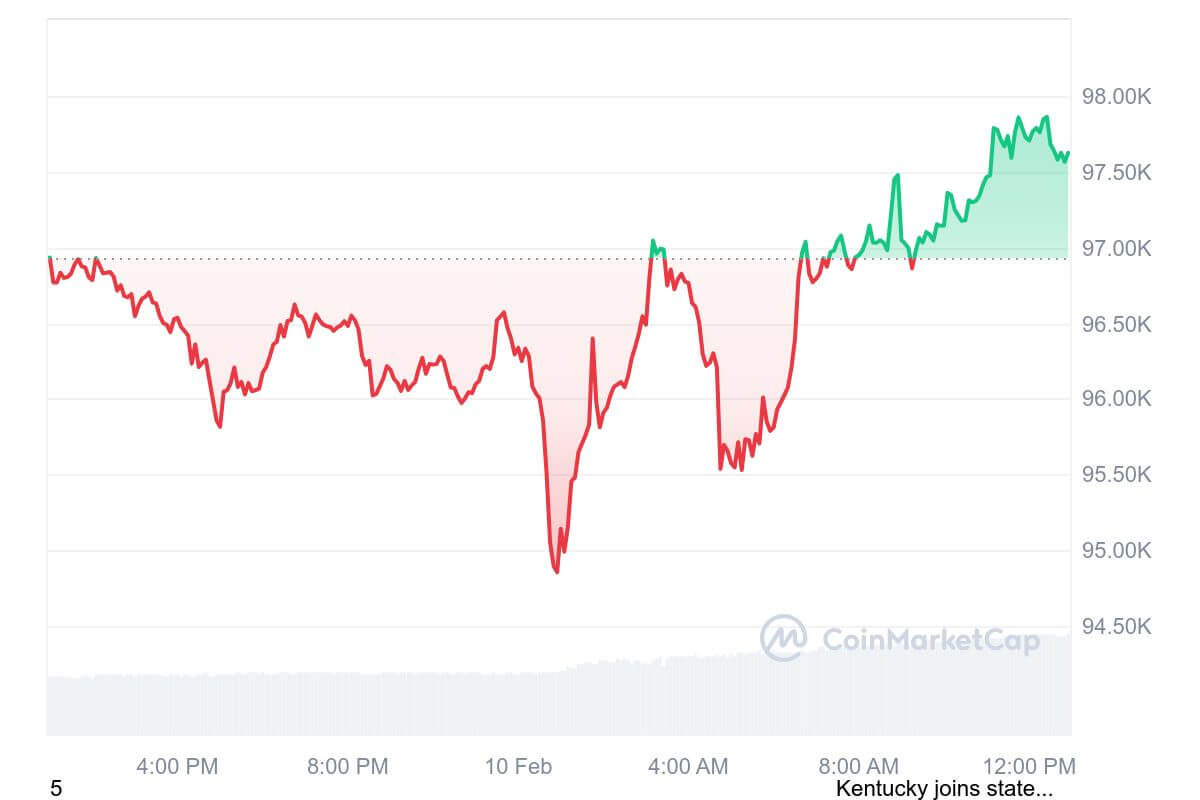
    US-based Bitcoin ETFs have snapped a two-week streak of redemptions, pulling in nearly $300 million in net inflows on Tuesday as investors took advantage of lower prices to rotate back into cryptocurrency-linked products.

    The renewed buying interest, which follows a period of significant outflows, suggests that institutional investors are viewing the recent market dip as a buying opportunity, reaffirming their long-term conviction in the asset despite short-term volatility.

    A decisive reversal after weeks of outflows

    Early data from SoSoValue shows a significant reversal of last week’s trend, which saw over $1.17 billion withdrawn from digital asset investment products.

    Fidelity’s FBTC led the charge with $165.9 million in fresh capital, while Ark 21Shares’ ARKB added $102.5 million.

    Notably, even Grayscale’s GBTC, which has experienced consistent outflows for months, posted a net inflow of $24.1 million.

    This return of capital to US products contrasts with the European market, which has continued to see steady inflows, suggesting a more consistent long-term positioning from investors outside the United States.

    Altcoins continue to attract capital

    While Bitcoin and Ether products have been subject to macro-driven volatility, certain altcoins have continued to attract steady investment.

    According to data from CoinShares, Solana-linked products notched another $118 million in inflows last week, bringing its impressive nine-week total to $2.1 billion.

    This pattern indicates that investors are differentiating between core assets sensitive to macro pressures and emerging networks with strong on-chain momentum.

    Fundamentals remain strong as supply milestone nears

    Despite the recent price turbulence, market experts maintain that Bitcoin’s underlying fundamentals remain robust.

    Thomas Perfumo, a global economist at Kraken, highlighted an upcoming supply milestone as a key factor in the long-term investment case.

    “In approximately seven days, Bitcoin’s circulating supply will cross 19.95 million coins, 95% of its max supply of 21 million coins,” he wrote in a note provided to CoinDesk.

    Perfumo said this event underscores Bitcoin’s programmable scarcity and its enduring role as a “credibly neutral, globally accessible store of value.”

    Gold nears record highs amid fiscal warnings

    In the broader macroeconomic landscape, gold continued to trade near record highs at $4,134.6 per ounce.

    The precious metal’s strength is being fueled by growing concerns over US fiscal stability.

    Economist James Thorne has warned that the US has crossed a fiscal “Rubicon” that could trigger a “Bretton Woods 2.0” style reset, potentially revaluing gold to manage soaring debt levels.

    The impact of surging bullion prices is already being felt, with major producer Barrick Mining reporting a $1.3 billion quarterly profit and a dividend hike.

    Source link

  • Aster price risks dip below $1 despite major buyback plan

    Aster price risks dip below $1 despite major buyback plan

    Aster Bearish Price Outlook

    • The ASTER token is teetering near a critical support level of $1.03-$1.00.
    • A potential drop below $1 risks triggering further declines to $0.90.
    • The outlook is despite a buyback plan the Aster team announced on Friday.

    Aster DEX, a decentralized exchange backed by YZi Labs and linked to Binance co-founder Changpeng Zhao, has unveiled a significant buyback initiative to bolster its native token, ASTER.

    Announced earlier today, the plan proposes allocating 70-80% of Season 3 fees toward ASTER buybacks, contingent on market conditions.

    However, despite this bold move, market data and technical outlook suggest that ASTER faces substantial risks of dipping below the critical $1 psychological support level.

    Aster team plans major token buyback

    The ASTER token is currently trading at $1.06, just in the red.

    However, the DEX token faces notable selling pressure as has been seen in the past week and month.

    On Friday, the cryptocurrency failed to climb despite earlier gains.

    Intraday upticks saw the altcoin’s price reject in the $1.12 and $1.15 region, with gains and the subsequent selling pressure coming amid a major ASTER buyback announcement.

    Why is ASTER price down today?

    Aster fell amid negative news on Thursday. Today, the token’s price action reflects a fragile market, with technical indicators pointing to potential downside risks.

    Notably, Aster has lost over 55% of its value since the peak of $2.42 reached in September.

    The rally that saw the exchange platform challenge and even surpass Hyperliquid in volume has dissipated, and the altcoin’s 24-hour trading volume, while robust, has dropped below $800 million.

    Market sentiment is further strained amid overall crypto action.

    On Friday, following high anticipation, the Bureau of Labor Statistics released the Consumer Price Index inflation for September.

    After an initial uptick alongside stocks, Bitcoin and Ethereum as well as most cryptocurrencies showed subdued action.

    The US CPI report, which indicated cooling inflation, failed to inspire sustained bullish momentum across the crypto sector.

    While the Dow Jones Industrial Average had spiked by over 530 points as of writing, Bitcoin failed to rally above $111,000, and ETH pared gains from near $4,000.

    Aster price signalled a similar outlook despite the team’s buyback announcement.

    Is ASTER set to dump below $1?

    Technical indicators highlight that the current price is at a critical support zone.

    A downturn below $1.03 means bears could strengthen in the $0.93-$0.97 region. ASTER could drop to lows of $0.90.

    Meanwhile, robust resistance lies in the $1.12-$1.15 zone, with a break to above $1.24 potentially triggering an upward momentum toward $1.52 and then $1.60.

    Aster price chart by TraddingView

    In any case, ASTER’s ability to hold above $1 is crucial for this bullish outlook.

    The buyback plan’s execution and broader market stabilization will be key for buyers.

    The token’s institutional backing and multi-chain architecture may also offer a foundation for recovery.

    However, the overall crypto market outlook suggests uncertainty could deter short-term holders.


    Source link

  • Bitcoin drops as bearish data sparks a 10% price dip warning

    Bitcoin drops as bearish data sparks a 10% price dip warning

    Bitcoin drops as bearish data sparks a 10% price dip warning

    • Bitcoin has dropped below the key 120,000 dollar level amid a fresh sell-off.
    • The market is showing signs of low volume and a lack of upward momentum.
    • Key on-chain data shows a lack of bid support below the 120,000 dollar mark.

    The triumphant return of the bulls has proven to be a fleeting and fragile affair.

    Just as the market was beginning to celebrate a new era of price discovery, a wave of determined selling has sent Bitcoin tumbling back below the critical 120,000 dollar level, a brutal rejection that has the bears once again in control and raises the grim prospect of a much deeper correction.

    The sell-off, which has seen the leading cryptocurrency fall nearly 3 percent on the day, is a story of fading momentum and evaporating support.

    The recent all-time highs now feel like a distant memory as the market slices through the bid liquidity that had once held it aloft.

    A market bracing for a deeper cut

    The mood among seasoned traders has shifted from cautious optimism to a grim acceptance of a new, more bearish reality.

    The market is now at a critical inflection point, with the very support that was so hard-won now under a sustained and powerful assault.

    “Market does still quote bid liquidity around 121K-120K but what we need to see next is absorption of sellers to rule out a sweep lower,” the popular trader Skew wrote in his latest market commentary on X.

    His short-term outlook was stark, adding that the market was “quite likely to be dominated by new shorts opening.”

    This view is being reinforced by the data.

    The trading resource Material Indicators highlighted that the market is now facing its “3rd consecutive Daily support test at the trend line,” a technical setup that suggests the bears are growing bolder with each attempt.

    Data from CoinGlass paints an even more worrying picture, showing a distinct lack of bid support much below the 120,000 dollar mark, while a wall of sell orders has multiplied overhead.

    The return of the $108,000 ghost

    This short-term weakness is taking place against a backdrop of a more troubling long-term picture.

    The veteran trader Roman warned his followers on X that the situation for Bitcoin remains tenuous, despite its recent record highs.

    “A friendly reminder that we are once again printing more bearish divergences, low volume, & lack of momentum on HTF. Both 1W & 1M,” he wrote, pointing to a series of classic warning signs that the rally is running out of steam.

    His conclusion is a chilling one for the bulls: the local range lows at 108,000 dollars, a level that has been a key battleground in the past, could soon come back into play.

    The king of crypto may have briefly touched the heavens, but the bears are now doing their best to drag it back down to earth.

    Source link

  • Michael Saylor’s Strategy buys the Bitcoin dip, adds 4,048 BTC

    Michael Saylor’s Strategy buys the Bitcoin dip, adds 4,048 BTC

    AI generated image for Bitcoin in a vault

    • The acquisition cost $449.3 million, with the company paying an average of $110,981 per coin.
    • Following the latest acquisition, Strategy’s total Bitcoin holdings rose to 636,505 BTC.
    • The company’s latest purchase follows a series of smaller acquisitions in August.

    Strategy, the world’s largest public company holding Bitcoin, led by Michael Saylor, disclosed in a US Securities and Exchange Commission filing on Tuesday that it purchased 4,048 Bitcoin between August 25 and September 1.

    The acquisition cost $449.3 million, with the company paying an average of $110,981 per coin.

    According to CoinGecko data cited in the filing, the purchases were made as Bitcoin prices briefly climbed above $113,000 before dropping below $108,000 last Friday.

    Strategy’s BTC bet

    Following the latest acquisition, Strategy’s total Bitcoin holdings rose to 636,505 BTC.

    The company has acquired its reserves for approximately $46.95 billion, at an average purchase price of $73,765 per coin.

    The company said the latest acquisitions were financed through proceeds from at-the-market sales of its Class A common stock (MSTR) as well as its perpetual preferred stock programs, including Strike (STRK), Strife (STRF), and Stride (STRD).

    Strategy reported that it sold 1,237,000 MSTR shares for $425.3 million, with $16.31 billion still available for issue under its at-the-market program.

    In addition, the company sold 199,509 STRK shares for about $19 million, with $20.39 billion remaining, 237,931 STRF shares for $26.5 million, with $1.8 billion remaining, and 12,973 STRD shares for $1 million, leaving $4.17 billion available.

    August buying activity slows

    The company’s latest purchase follows a series of smaller acquisitions in August.

    Strategy had announced the purchase of 3,081 BTC last week, along with earlier acquisitions of 430 BTC and 155 BTC in the same month.

    Combined with the most recent purchase, the company acquired 7,714 BTC in August, significantly lower than the 31,466 BTC bought in July.

    Saylor had signalled the likelihood of additional acquisitions ahead of the filing, posting an update to Strategy’s Bitcoin tracker over the weekend, saying Bitcoin was “still on sale.”

    The company also confirmed that a group of investors dropped a class action lawsuit on Thursday.

    The lawsuit, filed in May, alleged that Strategy had made false and misleading statements about its investment strategy.

    The BTC treasury race

    According to data from Bitcoin Treasuries, 163 public companies have adopted some form of Bitcoin acquisition model.

    Other large holders include MARA with 50,639 BTC, Tether-backed Twenty One with 43,514 BTC, Adam Back and Cantor Fitzgerald-backed Bitcoin Standard Treasury Company with 30,021 BTC, Bullish with 24,000 BTC, Metaplanet with 20,000 BTC, Riot Platforms with 19,239 BTC, Trump Media & Technology Group with 15,000 BTC, CleanSpark with 12,703 BTC, and Coinbase with 11,776 BTC.


    Source link

  • Bitcoin price dip seen as ‘perfect bottom’ by analyst; technicals target $148K

    Bitcoin price dip seen as ‘perfect bottom’ by analyst; technicals target $148K

    Bitcoin price dip seen as 'perfect bottom' by analyst; technicals target $148K

    • Bitcoin has dropped 7.5% since its recent all-time high of ~$123,250, but analysts see this as a potential “perfect bottom.”
    • BTC has successfully retested its 50-day EMA, a support level that preceded a 25% rebound in June.
    • A classic inverted head-and-shoulders (IH&S) technical pattern now targets a price of $148,250.

    Bitcoin has pulled back by 7.50% in the three weeks since it established a new record high of around $123,250.

    However, far from signaling the end of the bull run, some analysts believe this recent dip may be the final “shakeout” before a significant breakout, with technical patterns now pointing towards a potential rally to nearly $150,000.

    On Sunday, Bitcoin successfully reclaimed its 50-day exponential moving average (50-day EMA) as a key support level, after briefly dipping below it a day earlier.

    This particular moving average has historically served as a reliable launchpad for initiating fresh rallies in Bitcoin’s price.

    A similar scenario played out in June, for instance, when a brief drop below this very same wave of support preceded a sharp 25% rebound in the cryptocurrency’s value.

    Now, it appears that Bitcoin may be repeating this same technical setup. Analyst “BitBull” suggests that the cryptocurrency could be poised for a June-like rally in the coming days.

    He argues that even if the price were to drop further into the 110,000-112,000 range, it would effectively establish a “perfect bottom” for Bitcoin, potentially setting the stage for the next significant move higher.

    A classic breakout pattern targets $148,000

    The importance of the 50-day EMA as a support level is further reinforced by its alignment with the “neckline” of Bitcoin’s prevailing inverted head-and-shoulders (IH&S) pattern.

    This classic technical analysis pattern is often seen as a strong indicator of a bullish reversal.

    After initially breaking above this neckline, Bitcoin’s price has now pulled back to retest it—a typical post-breakout move. The fact that the price has bounced off this retested level reinforces the validity of the bullish reversal setup.

    This successful neckline retest now signals that Bitcoin may be entering the continuation phase of its breakout. According to the technicals of the IH&S pattern, the price is now targeting a move toward the $148,250 level.

    This is remarkably close to the widely anticipated $150,000 upside target that many analysts have forecasted for Bitcoin in 2025, with many expecting it to happen around October.

    Whale watching: on-chain data signals a ‘cyclical cooling phase’

    On-chain data provides further evidence that Bitcoin’s ongoing price dip may be a precursor to another major breakout.

    According to data from CryptoQuant, the Bitcoin market has experienced three major waves of profit-taking by large “whale” investors during the 2023–2025 bull market.

    The first of these waves followed the landmark launch of U.S. spot ETFs in March 2024. The second occurred after Bitcoin broke the $100,000 mark following the Trump election in late 2024.

    The third, and most recent, wave took place in July 2025, after a breakout over $120,000 triggered a massive 80,000 BTC sell-off by a long-time “old whale” investor.

    In a report published on Friday, CryptoQuant analysts noted that each of these waves of profit-taking was followed by a period of price consolidation or a moderate correction, typically lasting between two to four months.

    “These cooling phases have historically set the stage for renewed accumulation and a subsequent breakout to new all-time highs,” they wrote.

    The analysts concluded, “The data provides compelling evidence that the market is undergoing another cyclical cooling phase, consistent with prior waves that preceded periods of consolidation and later breakouts to higher prices.”

    This suggests that the current dip is not an end to the bull market, but rather a healthy and necessary part of its cycle.


    Source link

  • Solana price forecast as SOL bulls look to buy the dip

    Solana price forecast as SOL bulls look to buy the dip

    Solana price prediction

    • Solana has fell 7.6% in the past 24 hours to touch lows of $166.
    • The technical outlook on the daily chart shows price is taking on a bearish flip.
    • Bulls bouncing amid crypto recovery could target $200.

    Solana has experienced a 7.6% dip in the past 24 hours to touch lows of $166, with declines coming amid widespread selling across crypto.

    But as the volatility prompts some investors to take profits, bulls are likely eyeing the downturn as a buying opportunity.

    Here’s a look at the technical picture for SOL.

    Solana drops to key support level

    As highlighted, Solana’s price has declined by about 7.6% in the past 24 hours, trading to lows near $166.

    CoinMarketCap data shows Solana’s 24-hour trading volume increased by about 25% to $7.38 billion, which hints at heightened market activity.

    It’s an outlook that mirrors the broader crypto market performance, with Bitcoin (BTC) selling-off to below $115k, Ethereum (ETH) to around $3,500 and XRP down 7% to around $2.90.

    Losses across board saw total liquidations reach $758 million in the last 24 hours, with SOL seeing about $43.8 million liquidated.

    The sudden price dip meant most of the liquidations are of bullish Solana bets, which Coinglass data shows at $42 million of the $43.8 million.

    A bearish sentiment amid this flip has SOL currently hovering at a key support level.

    Could bulls capitalize on the dip to build fresh momentum towards $200? Continued network growth, as highlighted by key metrics such as active users and revenue, suggests Solana is strong long term.

    Solana price prediction

    The Solana price prediction for 2025 is largely bullish, with analysts seeing it as a key breakout level.

    Conservative forecasts put SOL at $500 by the end of 2025, mainly driven by Solana’s robust ecosystem and institutional interest.

    Spot ETFs and regulatory tailwinds could be the main catalyst.

    However, what’s the short-term outlook as cryptocurrencies navigate yet another sell-off phase?

    SOL price chart by TradingView

    The technical outlook on the daily chart shows the price remains within an ascending channel, but has broken below the middle line.

    Meanwhile, the Relative Strength Index (RSI) stands at 45, below the midpoint after SOl flipped from overbought territory.

    The RSI indicator is also downsloping to suggest a potential move toward the oversold zone.

    SOL’s daily chart also shows the Moving Average Convergence Divergence (MACD) indicators hinting at bearish momentum after a bearish crossover.

    While a drop below $160 may test lower supports at $145 and $130, a reversal amid buying pressure will allow buyers to target $200.

    As noted, some analysts are predicting SOL price to $500 in a sharp rally amid spot Solana ETFs approval.


    Source link

  • BTC briefly touches $94k amid sentiment-driven dip

    BTC briefly touches $94k amid sentiment-driven dip

    • BTC fell below $95k as sellers intensified pressure.
    • As well as the sentiment, key events to watch out for this week include tariffs news, Fed chair Jerome Powells testimony and CPI data release.

    Bitcoin (BTC) has witnessed notable downside pressure since recoiling from the all-time high reached in 2024 amid Trump’s victory in the US election.

    The benchmark crypto asset has broken to year-to-date highs with bulls largely unfazed. However, the past few days have seen BTC struggle below the psychological $100k level.

    BTC chart by CoinMarketCap

    On Feb. 10, the price of BTC flipped negative to briefly touch lows of $94.7k. While it has bounced to above $97k at the time of writing, analysts at QCP Capital say the market is cautious.

    What next for Bitcoin, altcoins

    Notably, the dip that pushed Bitcoin price to lows of $94,745 appears to be more of sentiment-driven than a reflection of a fundamental shift in broader markets’ risk appetite. QCP analysts opine that volatility will remain skewed toward puts for the next couple months.

    Among key things to watch out for is also Federal Reserve chair Jerome Powell’s testimony and the upcoming consumer price index data. Trump’s latest tariff move involving a 25% tariff on steel and aluminum could also fuel further uncertainty.

    “A feedback loop is emerging—Trump watches the markets, and the markets test his resolve. Will this embolden him further or force a pivot?” the analysts noted, pointing to the issue of tariffs and the market reaction.

    Despite the potential impact of a short term outlook, whales are strengthening to suggest long term confidence in Bitcoin performance.

    According to crypto analyst and YouTuber ‘CryptoJack’, 14,000 BTC have moved on-chain to suggest whales may be making moves amid an expected bull market.

    Bitcoin traded near $98k as of 11:30 am CET, with bulls likely to target $100k if positive vibes surge.


    Source link

  • Crypto liquidations hit $200m amid Bitcoin dip

    Crypto liquidations hit $200m amid Bitcoin dip

    • Crypto liquidations rose to over $200 million in 24 hours as Bitcoin (ETH) and Ethereum (ETH) dipped.
    • Analysts are however bullish on BTC price as September looks poised to end on a green note.

    The crypto market saw over $200 million in crypto liquidations as Bitcoin slipped to near $64k amid fresh bear moves.

    According to data from Coinglass, the cryptocurrency market saw total liquidations in the past 24 hours surge by 128% to more than $200 million. This came as Bitcoin (BTC) fell 4% to near $63,100 on September 30.  

    24-hour liquidations

    Having posted a significantly better performance in September contrary to expectation with a spike to $66k, BTC retreated sharply to pull most altcoins lower. With Ethereum (ETH) also dumping to under $2.6k amid latest selling from the Ethereum Foundation, total longs rekt soared to $164 million.

    Shorts accounted for about $37 million in 24-hour liquidations at the time of writing.

    Crypto liquidation represents the process by which a trader’s position is forcibly closed when their margin account no longer supports an open position. This happens when a trader suffers substantial losses or has insufficient margin to keep the position open.

    According to Coinglass data, over 68,900 traders have had their positions liquidated in the past 24 hours. The largest single order to be liquidated happened on the crypto exchange OKX in the ETH-USD-SWAP, at a value $1.92 million.

    BTC bounce: Uptober is here

    Despite the decline in BTC price, bulls are likely to strengthen in coming weeks.

    The upbeat mood may be down to the fact that with hours to go, September looks poised to end with BTC up more than 7%. That’s barring a sharp meltdown – not entirely new to the market. Still, analysts are bullish.

    As crypto analyst Kaleo points out in the X post below, October and November have historically been ultra-positive for Bitcoin. If the trend continues, BTC will bounce hard in the coming months.

    Earlier on Monday, digital asset manager CoinShares published its weekly report. It showed crypto investment products registered a third consecutive week of inflows amid recent upside on interest rates cut. Bitcoin topped $1 billion as Ethereum broke a five-week streak of negative flows.

    BTC price hovered near $63,405 at the time of writing.


    Source link

  • Bitcoin begins “historically” rough September with dip to $26k

    Bitcoin begins “historically” rough September with dip to $26k

    • Crypto prices traded lower on Friday as Bitcoin retested the $26k area.
    • Declines across major altcoins added to the forecast of a “bumpy” ride in historically negative September.

    Cryptocurrencies were largely down on Friday, September 1 as major caps slid amid a surprising decline likely fueled by latest delays for spot Bitcoin ETFs. 

    As can be seen in the crypto heat map below, Bitcoin (which has retested levels under $26k) and Ethereum (prices have dipped under $1.7k) lead the 24 hour rot. Most top 20 coins are in the red. CoinGecko data also shows the global crypto market cap has dropped by 3.4% at the time of writing.

    Crypto price heat map by Coin360

    Bitcoin tests $26k area

    Analysts say the crypto market could be in for yet another rough September. According to crypto analyst Will Clemente, historical data shows crypto is on a six-year streak of negative returns during this month. Overall, no other month has had as few green monthly candles as September has for Bitcoin price.

    According to Santiment, Bitcoin’s nearly 5% slip in the past 24 hours has the top crypto “right back where it started prior to the Grayscale news” that catalysed the broader crypto market. The upside that followed the court decision could now be more of a ““buy the rumour, sell the news” event,” the market intelligence provider noted.

    Stock-to-flow model creator PlanB points to the fact that Bitcoin has to shake off “all tourists and weak hands before take-off.”

    While the next few weeks will likely be as choppy as anything, analysts are forecasting a return to upside momentum in mid-October. This outlook bears in mind the potential for a SEC decision on the multiple ETF applications it delayed on Thursday.

    Bitcoin was trading near $26,000 after testing lows of $25,683, with the price range of $25,600-$26,600 a key zone. Both bulls and bears are eyeing control here and a flip lower is likely if we have a “Sept-repeat”.


    Source link

  • Prediction markets tokens rise as other tokens dip: Gnosis, Augur price outlook

    Prediction markets tokens rise as other tokens dip: Gnosis, Augur price outlook

    • Bitcoin has suffered its worst weekly percentage loss since the collapse of FTX.
    • Some of the factors behind the dip include reports of SpaceX selling its BTC holdings and the Chinese property giant Evergrande bankruptcy filing.
    • Top prediction markets tokens have maintained a bullish trend amid the crypto meltdown.

    In what has caught most crypto investors by surprise, the price of Bitcoin (BTC) has decreased by 11.2% to about US$26k. Last week has been the worst week for Bitcoin (BTC) since FTX’s demise in November 2022.

    The market crash has not only affected BTC, seeing that the rest of the asset class has not fared any better. Ethereum (ETH) fell by approximately 9.5% to $1.7K and Binance-coin (BNB) dropped by about 9.8% to $217, just to mention a few of the top cryptocurrencies by market capitalization.

    While most of the top cryptocurrencies experienced a price dip, popular prediction markets tokens like Gnosis (GNO), SX Network (SX), Kleros (PNK), and Augur (REP) registered significant gains. Chancer (CHANCER), a new prediction markets token is also gaining traction as its token presale continues to gain traction.

    What caused the crypto market to drop?

    The price decrease was caused by a number of causes. They included speculation that SpaceX wrote down the value of its Bitcoin assets, the collapse of the Chinese real estate firm Evergrande, and rising yields in the US.

    SpaceX Bitcoin holdings

    The Wall Street Journal published a report late last week stating that Elon Musk’s space exploration company SpaceX marked down the value of the Bitcoin it had on its books by US$373 million for the years 2022 and 2021. The report claims that the business also sold a portion of the BTC it had at one point over the previous two years. The WSJ has identified documents that it claims offer uncommon insights into the business’s finances.

    However, the WSJ’s assertions cannot be independently verified because SpaceX is a privately held corporation. Musk acknowledged that SpaceX did acquire Bitcoin during a panel appearance in 2021, but it is unclear how much or when the commodity was purchased.

    Evergrande bankruptcy 

    In a disclosure made over the weekend, the Chinese real estate tycoon Evergrande filed for bankruptcy protection in the United States. The corporation reportedly took action to secure its assets while still trying to control its creditors.

    Before proposing a comprehensive off-shore debt restructuring program in 2021, Evergrande experienced a public meltdown and went into default on its obligations. The business currently seems to be on life support.

    Investors are worried that China’s enormous real estate market may become contagious. Country Gardens and other significant developers are not paying their debts either, and the industry—which is thought to account for up to 30% of Chinese GDP—is in serious need of government assistance.

    US Treasury yields

    US Treasury yields are skyrocketing and pushing away investors from risky markets like the crypto market and toward saving. As the US Federal Reserve gradually increased rates throughout the previous year to reach a target rate of slightly over 5%, bond yields increased.

    As strong US economic data keeps coming out, yields have increased this week in anticipation that rate rises will continue. Since 2011, the 30-year US Treasury yield has never been higher. Treasury bonds give a high, secure yield, which is detracting from the value of other asset types like shares and cryptocurrencies.

    Gnosis and Augur price prediction

    Gnosis has risen by 0.2% while Augur has registered a 1% surge after a bear week. In the past seven days, Gnosis dropped by 8.8% while Augur fell by 11.7%.

    Gnosis price daily chart


    Having bounced off the support at $97.60, the Gnosis (GNO) token is expected to test the resistance at $104.75. However, that depends on whether the current daily candlestick closes above the lower band line of the Bollinger Bands indicator.

    Augur price daily chart


    Augur, on the other hand, seems to have slid into consolidation after erasing most of the gains it made between July 19 and July 20. All eyes are on the support at $0.3246 and the resistance at $2.1844. If the REP price jumps above the upper Bollinger Bands line, it could test the $2.1844 resistance level and if it drops below the lower Bollinger Bands line, it could drop to the support at $0.3246.

    The prediction markets tokens including Chancer, are expected to experience significant price gains as popular games including the English Premier League and the American MSL gather steam.

    Source link