Tag: eye

  • Bitcoin dips below $122K after 16% rally, altcoins follow as analysts eye rebound

    Bitcoin dips below $122K after 16% rally, altcoins follow as analysts eye rebound

    Bitcoin slips under $122K after a 16% surge fueled by ETFs and futures.

    • Bitcoin slips under $122K after a 16% surge fueled by ETFs and futures.
    • Profit-taking triggers a short-term dip, pulling major altcoins down 4–7%.
    • Analysts eye a potential rebound, with Bitcoin aiming past $130K and altcoins poised for recovery.

    Bitcoin took a bit of a breather on Tuesday, slipping below the $122,000 mark after a blistering rally that had traders buzzing with excitement.

    For the traders following the crypto rollercoaster, this pullback probably didn’t come as a huge surprise.

    The market had been running pretty hot, and sometimes you just need to catch your breath before the next big move.

    Bitcoin price: What’s behind the dip?

    So, what’s causing Bitcoin and its crypto cousins like Solana, Cardano, and XRP to catch some cold feet right now? Well, a lot of it comes down to the fast-paced buying spree we saw over the past several days.

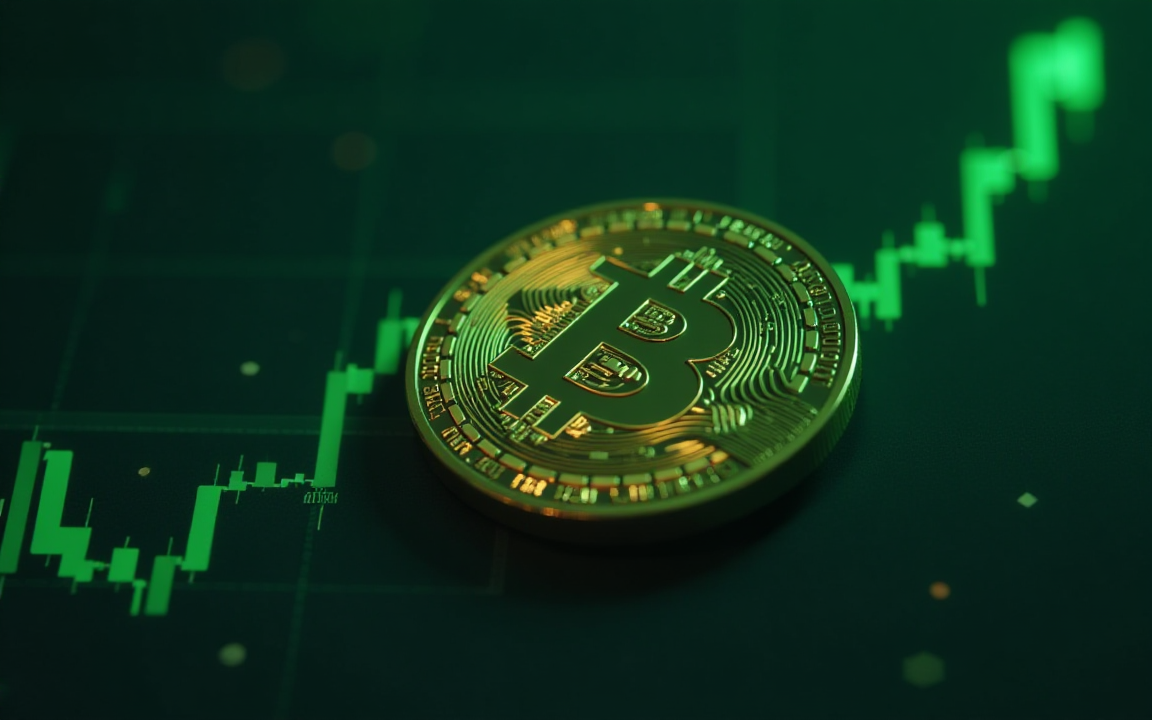
    Bitcoin’s price zoomed up by around 16%, fueled by a flood of fresh investments pouring into ETFs and futures.

    It’s like everyone piled onto the bandwagon at once, which can make things a little wobbly. When the crowd rushes in simultaneously, it often leads to what experts call an “overheated” market.

    Basically, traders get a bit too optimistic, pushing prices higher than what fundamentals might support in the short term. Then, boom, some folks start locking in profits, and the selling begins.

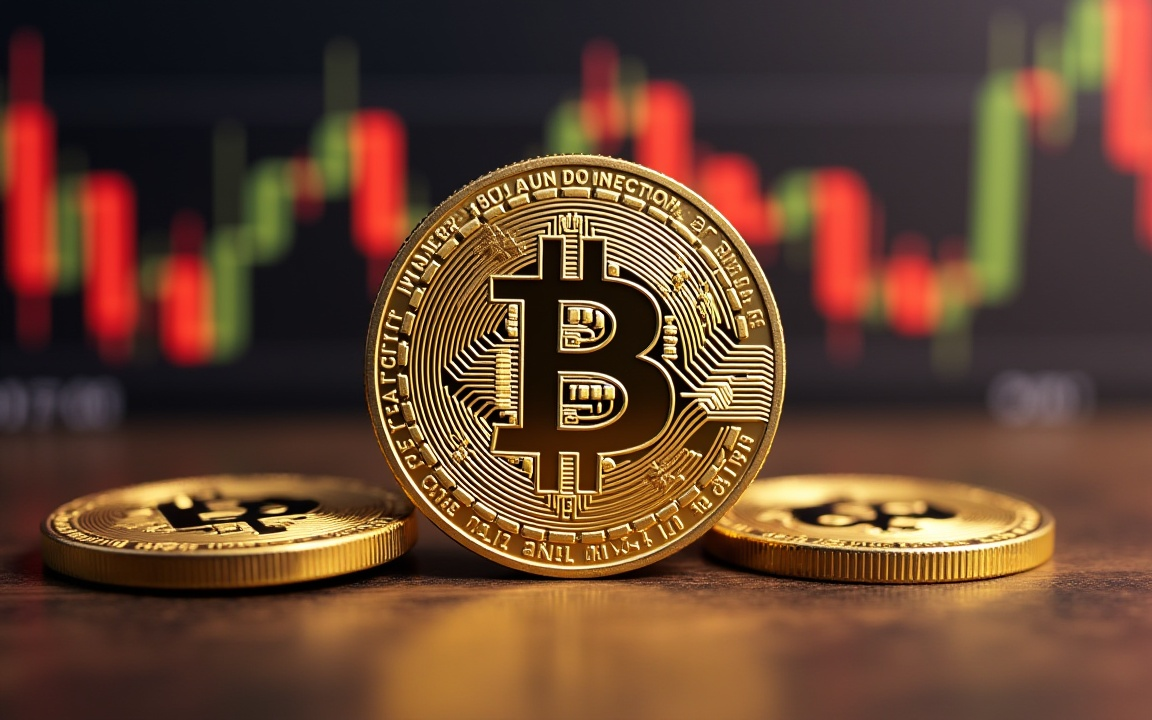
    We saw exactly that as bitcoin lost some steam, dragging most altcoins down with it, with drops ranging from 4% to 7% for the bigger names.

    But here’s the thing, it’s not all doom and gloom. These kinds of corrections are pretty common in volatile markets like crypto.

    Think of it this way: it cleans out the weak hands and sets the stage for healthier growth ahead. Plus, bitcoin still has strong support around the $118,000 to $120,000 zone, which many believe will keep the floor from falling out completely.

    What’s next for crypto?

    Many analysts are keeping a hopeful eye on the coming weeks. If Bitcoin can hang onto those key support levels, the path might just be clear for it to climb back past $130,000, riding the momentum of a strong finish to 2025.

    Of course, the crypto world isn’t just about Bitcoin. Ethereum, for one, has been holding up relatively well, partly thanks to growing interest in staking and the ongoing development of decentralized finance platforms.

    The altcoin scene may have taken a hit during this pullback, but it’s not out of the game.

    Tokens like Solana and XRP are still on many investors’ radars, especially with potential new ETF approvals on the horizon and technical upgrades underway.

    October has historically been a lively month for crypto, so don’t be surprised if the market springs back with a classic “Uptober” rally soon.

    That said, this ride isn’t for the faint of heart. The market’s inherent volatility means prices can swing wildly, sometimes on little more than speculation or headlines.

    Plus, global economic factors and regulatory news can turn the tide pretty quickly.

    Source link

  • Dash price soars 35% to $38 as privacy coins rally; analysts eye breakout toward $60

    Dash price soars 35% to $38 as privacy coins rally; analysts eye breakout toward $60

    Dash Price Soars

    • Dash price jumped 35% to above $38, trending near the key resistance zone at $40.
    • Analysts say breakout is possible but key support remains $26 area.
    • DASH gained as privacy coins Zcash and Monero rose to lead the market gainers.

    Dash (DASH) price has surged 35% in the past 24 hours as top privacy coins rally.

    The Dash token’s value topped $38 as of early Thursday, riding overall gains that have seen Zcash lead privacy coins amid a spike to above $150.

    Dash joins the crypto party at a time when bulls are targeting the October uptick that could catapult alts to new highs.

    Dash price jumps 35% to near key level

    As noted, Dash which is currently trading at $36.69,rose as privacy coins showed gains.

    The uptick for ZEC and Monero aided Dash’s impressive 35% leap today. A lot of the upside outlook is down a confluence of this, plus technical and broader macroeconomic catalysts.

    In particular, the reaction on Wall Street as the US government officially shut down and capital rotation into top cryptocurrencies looks to fuel DASH bulls.

    Privacy coin momentum: Dash mirrors ZEC, XMR gains

    The cryptocurrency landscape is currently trending bullish, and one sector witnessing a robust revival is that of privacy coins.

    While top coins see notable traction amid ETF and treasury asset moves, small caps like Dash are taking in inflows as concerns over data privacy and regulatory overreach continue.

    Monero (XMR) and Zcash (ZEC) are top coins in the privacy coins market. Support for ZEC by Grayscale with a Zcash Trust saw the token’s price skyrocket to highs last seen in April 2022.

    Monero, also notching privacy-related momentum, gained over 10%. Dash price is mirroring this as its adoption gains further traction.

    Market data reveals a 15-20% average uptick across the sector in the last month, with transaction volumes of privacy-focused tokens rising significantly year-over-year.

    Dash price chart by CoinMarketCap

    DASH price forecast: Is $60 next target?

    For Dash, the last 24 hours have seen trading volumes across exchanges jump over 385% to over $400 million.  This increase in volume signals potential upside continuation.

    Crypto traders and analysts at Alpha Crypto Signal shared the update below on the DASH price.

    “$DASH has exploded out of its long-standing horizontal channel after months of sideways consolidation,” they posted on X.”DASH had been trapped between 18–26 for almost half the year, building a strong base. The recent surge finally broke through the channel resistance with heavy volume, confirming a bullish breakout.”

    The analysts noted that the key level to watch is the $35-$40 zone, with a breakout above this threshold critical to bulls’ ambitions. Gains to $60 or higher could be next amid broader market movements.

    However, if profit-taking takes hold, the Dash price could dip to support around $26.

    “As long as price holds above the former resistance at 26, the breakout remains valid and buyers stay in control. Another strong showing from the privacy coin sector,” the analysts added.

    Source link

  • Bitcoin surges to $112K as Strategy adds 196 BTC, analysts eye $120K potential

    Bitcoin surges to $112K as Strategy adds 196 BTC, analysts eye $120K potential

    Bitcoin BTC

    • Bitcoin hits $112k, fueled by institutional buying.
    • Strategy added 196 BTC, increasing its holdings to 640,031 BTC.
    • Analysts see potential for $120,000 but warn of volatility risks.

    Bitcoin (BTC) has surged to $112k, fueled by renewed institutional interest and a significant acquisition by Strategy, the world’s largest corporate Bitcoin holder.

    Strategy acquires 196 BTC, holdings hit 640,031

    Strategy, formerly MicroStrategy, has announced the acquisition of 196 Bitcoin for an undisclosed amount, bringing its total holdings to 640,031 BTC, according to a Form 8-K filing.

    The purchase, funded through the company’s ATM offering programs, outlines Strategy’s position as the leading corporate Bitcoin treasury, with holdings valued at approximately $71.7 billion based on current market prices.

    The acquisition follows a pattern of consistent buying, with Strategy adding 850 BTC on September 22, 2025, and 525 BTC on September 15, 2025, at an average price of $114,562 per BTC.

    Michael Saylor, the Executive Chairman, has a strategy of leveraging equity and debt financing to accumulate BTC which has solidified the company’s role as a Bitcoin-backed treasury model.

    This latest purchase concurs with Bitcoin’s price climbing to $112,500, reflecting a 2.9% increase from $109,525.50 three days prior.

    Analysts on BTC price outlook

    Analysts are cautiously optimistic about Bitcoin’s price trajectory following its climb to $112,000.

    The surge aligns with the Strategy’s aggressive accumulation and broader market momentum, but opinions vary on future movements.

    Analysts have projected BTC could reach $150k-$200k in 2025, and institutional adoption and macroeconomic factors are seen as key tailwinds. However, some say volatility means bears may not be done yet.

    QCP analysts shared their outlook

    “After a volatile September, $BTC is still up more than 3% on the month. Options markets show conviction slowly returning, but the 115k level remains the hurdle to clear for a renewed uptrend.”

    Bitcoin at ‘Buy’ for dip level?

    According to QCP analysts, the crypto market is showing “signs of recovery” following the carnage seen the previous week. The shakeout that saw BTC trade to under $109k may nonetheless offer a buy-the-dip opportunity.

    “Despite sizable ETF outflows, particularly on Friday, spot managed to hold sideways through the weekend. This points to quarter-end basis unwinds as a key driver of redemptions, with markets absorbing the selling pressure more smoothly than expected,” QCP wrote. “With spot rebounding, this week’s ETF flows could set the tone for institutional demand heading into a seasonally bullish month.”

    Strategy’s consistent buying is seen as a bullish signal, with potential U.S. policies on digital assets influencing long-term price stability.

    If bulls rally, Bitcoin’s ability to break past $117k will be crucial. The level marks a sizable supply wall area and will b pivotal for a breakout above $118k and retest of the $120k mark.


    Source link

  • Tornado Cash price forecast: TORN retests key level as bulls eye $20

    Tornado Cash price forecast: TORN retests key level as bulls eye $20

    Tornado Cash

    • Tornado Cash price retests supply wall at $12 with 6% spike in the last 24 hours.
    • Overall bounce for top coins has seen TORN price rebound from lows of $11.50 to retest the key resistance area around $12.40.
    • The technical picture is bullish with TORN looking to break above a key ascending triangle pattern on the daily chart.

    Tornado Cash (TORN), the governance token for the Ethereum-based privacy protocol, recently in the headlines for a court verdict on one of its co-founders, is trading at a key level after bouncing off recent lows.

    With the broader cryptocurrency market displaying resilience, and analysts forecasting a recovery in Q4, is TORN’s price action set for further gains?

    Could bulls retest the $20 last seen in January 2025?

    Tornado Cash price retests $12 hurdle

    As cryptocurrencies struggled amid bearish pressure on Monday, Tornado Cash traded lower alongside other tokens.

    However, with top coins recouping some gains, TORN rebounded from lows of $11.50 to climb to the key resistance area around $12.40.

    Notably, this is a level that has previously provided a significant supply wall for TORN.

    A retest of the area comes with price action that mirrors that of the broader market bounce as both Bitcoin (BTC) and Ethereum (ETH) bounce to key levels after experiencing dips on Monday.

    BTC, which briefly fell below $108k, has regained ground to trade above $110k.

    Meanwhile, ETH, down from its new all-time high above $5k, has stabilised above $4,400 as bulls keep bears off.

    TORN’s upward move aligns with this renewed market optimism, as the token tests the $12.40 resistance zone.

    As noted, this level has historically acted as a barrier, having thwarted bulls in December 2024 and January 2025.

    In the past 24 hours, Tornado Cash crypto is up nearly 6%.

    However, its 24-hour trading volume is a mere $84.9k, with this up 3% from the previous day to signal minimal market activity.

    Tornado Cash price forecast: Is $20 next?

    The technical outlook for TORN is increasingly bullish, with the token forming an ascending triangle pattern on the daily chart.

    Tornado Cash chart by TradingView

    Analysts associate this pattern with potential breakouts, and the $12.40 resistance level is critical in this respect.

    If there’s a decisive close above this point, momentum could propel TORN toward the next significant resistance at $20.

    Looking at the chart, the Relative Strength Index (RSI) currently sits at 57.

    Year-to-date highs of $27 and the November 2024 peak of $39 could be the next targets.

    If TORN fails to decisively breach $12, it may retreat to the $10 support level. A robust buy zone is around $7.20.

    Source link

  • SUI price: bulls eye all-time high amid spike above $4

    SUI price: bulls eye all-time high amid spike above $4

    Sui Price

    • Sui’s price is above $4.20 after surging more than 56% over the past month. 
    • The token’s rally has pushed the total value locked to all-time highs amid a surge in open interest.
    • Bulls could target the SUI all-time high of $5.35 reached in January 2025.

    Sui (SUI) has broken above $4.20 amid a notable 56% surge over the past month.

    This rally brings SUI tantalizingly close to its all-time high of $5.35, recorded in January 2025.

    It also means an impressive rally from April lows of $1.90, putting the token alongside top performers PancakeSwap, BNB and Optimism.

    Sui price jumps above $4 as TVL, open interest surge

    While Sui isn’t the standout performer in the past day or week, the token has gained over 56% in the past month.

    This has allowed it to break above $4.20 and see bulls come within reach of all-time highs witnessed in January 2025.

    Sui is also significantly up since lows of $1.9 in April 2025, with the cryptocurrency showing remarkable recovery since plummeting amid the Cetus protocol hack.

    Bulls’ dominance as top altcoins rally means Sui has experienced a notable spike in its total value locked (TVL).

    According to DeFiLlama, the project’s TVL has surpassed $3 billion, including staking, borrowings and vesting tokens.

    Key protocols like Suilend, NAVI and Bluefin have witnessed a spike in their respective TVLs to boost Sui’s.

    As well as DeFi activity, Sui is recording notable upside in the futures market.

    Per data by Coinglass, open interest in SUI has surged 10% to $2.7 billion, with strong speculative interest showing in the $7.4 billion in derivatives volume.

    Long positions dominate, suggesting overall bullish sentiment. As TVL rises and open interest grows, Sui’s market outlook becomes increasingly bullish.

    If market conditions support an upward flip, it could be a new ATH for Sui within the short term.

    Token unlocks are nonetheless a factor to watch.

    SUI price prediction

    Looking at the technical picture, SUI’s price trajectory appears upbeat.

    Technical indicators, such as the Relative Strength Index (RSI), support the bullish outlook.

    RSI currently sits at 65, having retreated from overbought territory, which means there’s room for further gains without SUI flipping immediately overheating.

    SUI chart by TradingView

    Meanwhile, the Moving Average Convergence Divergence (MACD) shows a bullish crossover.

    The MACD line is above the signal line to suggest bulls have an upper hand.

    Despite an upcoming cliff unlock, analysts predict SUI price could soon retest its all-time high of $5.35.

    Price discovery could push the token’s value even higher. However, the token unlock and short-term profit taking may derail bulls.

    SUI currently trades around $4.21, about 6% up in the past week.


    Source link

  • Bitcoin Cash up 7% as bulls defy BTC dump, eye gains on rising volume

    Bitcoin Cash up 7% as bulls defy BTC dump, eye gains on rising volume

    Bitcoin Cash Price

    • Bitcoin Cash has seen a notable surge in the past 24 hours, gaining 8% to $554.
    • The altcoin sees gains as Bitcoin price dumps amid massive sell-off pressure.
    • With trading volume up 44% and rising open interest also surging, BCH could defy the benchmark asset’s dip further and eye highs last seen in December 2024.

    The Bitcoin Cash (BCH) price currently stands at approximately $551.

    While it’s off its intraday highs of $554, it remains above the $550 mark, up as one of the top gainers in the past 24 hours.

    According to CoinMarketCap, this comes as Bitcoin’s latest correction has many altcoins also showing weakness.

    Bitcoin Cash defies BTC dump with 7% gain

    BTC dropped to below $115k after Galaxy Digital, a prominent crypto investment firm, offloaded 30,000 BTC in under 24 hours.

    Liquidations spiked amid the Bitcoin dump, but Bitcoin Cash looked to buck the trend.

    Its intraday gains of over 8% see it rank among the top performers in the 100 largest cryptocurrencies by market cap.

    Bitcoin Cash price chart by CoinMarketCap

    Notably, gains keep BCH in an uptrend over the longer time frames. The altcoin’s price is on an upward trajectory since touching lows of $268 in April 2025.

    Also, the price gain amid a 44% increase in trading volume to over $870 million suggests potential buying pressure.

    Crypto analyst CW points to increased whale interest, particularly in China.

    Is BCH poised for a rally to $1,000?

    BCH price last traded at $1,000 in May 2021, at the time when bears pushed it lower from above $1,427.

    In the past year, an attempt by buyers to reclaim the level fizzled out at around $624 in December 2024.

    While the cryptocurrency has struggled for upside momentum, analysts are increasingly optimistic about Bitcoin Cash’s potential to rally toward $1,000.

    Other than the overall long-term bullish sentiment around crypto, the short-term picture highlights robust market metrics and technical outlook.

    BCH price chart by TradingView

    For instance, open interest in BCH derivatives has jumped 24% to $533 million, with volume 28% up to over $1.3 billion.

    A surge in speculative activity signals bullish confidence in the token’s price.

    The technical picture further bolsters this bullish outlook.

    The Relative Strength Index (RSI) currently reads 63.

    Meanwhile, the Moving Average Convergence Divergence (MACD), is also flashing a bullish crossover to hint at potential short-term upward pressure.

    If bulls manage a breakout to the supply wall at $540-$565, they could retest the $620-$650 area.

    Above this, resistance above $700 could allow bulls to target $1,000. Conversely, support lies around $480 and then $380.


    Source link

  • BNB price prediction: BNB on cusp all-time high as bulls eye $1,000

    BNB price prediction: BNB on cusp all-time high as bulls eye $1,000

    • BNB price trades above $760, having touched intraday highs of $766.
    • Having come just shy of a new all-time high, it’s possible bulls could target $1,000 next.
    • Overall, altcoin market optimism will catalyse more gains.

    BNB, the native coin of the Binance ecosystem and BNB Chain, is on the cusp of a new all-time high as price hovers near $763 on Monday morning.

    This comes amid a robust uptick for altcoins, with Ethereum exploding to $3,800 and XRP eyeing $4.00.

    While BNB has only managed a modest 2%, price is retesting last week’s resistance level amid an increase of nearly 9% in seven days.

    Despite these small gains compared to other coins, BNB is showing strong technical indicators, alongside a yearly high in Open Interest.

    BNB price nears new all-time high

    The BNB price has continued to trade higher since breaking above $640 in June.

    On Monday, July 21, the altcoin reached an intraday high of $766, a move that saw it come close to hitting its all-time high of $793 reached in December 2024.

    As noted, this rally for Binance Coin aligns with an uptick for altcoins across the broader market.

    With Bitcoin consolidating after hitting new ATH above $123k, it’s altcoins that are in the limelight this past week.

    “With Ethereum leading the way, there has been a huge jump in social media mentions of many altcoins and higher price targets,” analysts at Santiment recently posted.

    Ethereum has climbed above $3,800, and XRP is on the verge of a new all-time high.

    Bulls have pushed Solana towards $200. Elsewhere, altcoins such as Conflux (CFX) have surged significantly to lead top gainers in leading 100 coins by market cap.

    BNB’s market capitalisation has also increased amid the overall upward momentum, hitting above $106 billion as the fifth-largest cryptocurrency targets a new peak.

    BNB price prediction: is a breakout to $1,000 next?

    A look at the charts shows BNB’s bullish outlook has the support of key technical indicators.

    Combining this with prevailing market conditions could offer buyers the chance to break higher.

    Currently, hovering above $760 puts BNB just shy of the $793 peak.

    Profit taking may ensue near the ATH, but Open Interest in BNB futures has soared to a yearly high of $1.04 billion.

    Derivatives volume has also jumped to over $1.38 billion, signalling increased trader bets on the cryptocurrency.

    BNB price chart by TradingView

    The Moving Average Convergence Divergence (MACD) also shows a bullish crossover, confirming sustained upward pressure.

    If BNB bulls weather the likely corrections, the next target above the all-time high will be the psychological $1,000 level.

    Source link

  • PEPE gains 15%, leading top memecoins as WIF and BONK eye a rally

    PEPE gains 15%, leading top memecoins as WIF and BONK eye a rally

    Pepe Memecoin Is Surging

    • Pepe price has jumped 15% in the past 24 hours to lead top memecoins.
    • Dogwifhat price breaks above $1, hitting highs of $1.07 as bulls eye fresh gains above the psychological level.
    • BONK is up 41% in the past week, and the latest move extends its recent gains.

    As Bitcoin attracts headlines with a massive spike to a new all-time high, tokens like Pepe (PEPE) are outpacing peers to lead memecoins higher.

    The cryptocurrency market’s bullish flip has also seen Dogwifhat (WIF) and Bonk (BONK) show signs of further gains.

    PEPE’s bounce and WIF, BONK’s uptick coincides with Bitcoin breaking above $118,000 and Ethereum’s spike to above $3,000.

    Omni Network rose sharply while Sei traded higher as one of the top altcoins under $1.

    BTC and ETH recorded huge fund inflows as prices rose.

    Analysts say the gains for BTC highlights strong market sentiment and excitement.

    “Bitcoin trades at $118,000 this morning, marking a fresh all-time high. The rally reflects both market excitement and a foundation of strong macro drivers beneath the surface. One key catalyst is renewed frontloading by global manufacturers. Tariff threats are driving firms to import early and draw down credit, echoing past cycles of policy uncertainty,” the analysts posted on X.

    Pepe surges 15% to lead top memecoins

    Pepe (PEPE), a frog-themed memecoin, has emerged as the frontrunner in the current memecoin rally, posting a 15% gain in just 24 hours.

    PEPE price chart by CoinMarketCap

    Currently ranked among the top 30 cryptocurrencies by market capitalization, PEPE’s price has spiked by more than 31% in the past week. The upside sees PEPE break out of a falling wedge pattern, a bullish technical signal that suggests another leg up.

    Notably, the memecoin’s trading has surged 70% to $2.35 billion in the past 24 hours. The Pepe price reached $0.000013, about 54% off its all-time high above $0.000028.

    Bulls could eye this amid upward momentum. However, profitaking risk means bears might yet revisit support levels.

    Dogwifhat price breaks above $1 – a psychological level

    Dogwifhat (WIF), a Solana-based memecoin, has broken above the $1 mark. Per CoinMarketCap, WIF reached highs of $1.07, surpassing the key psychological level for the first time since early June.

    WIF price chart by CoinMarketCap

    WIF’s price surged by 8% in the past 24 hours builds on its 20% gain over the week.

    The token’s rise aligns with a spike in trading volume. Dogwifhat’s daily volume is up 39% to over $712 million amid broader crypto market optimism.

    The memecoin could target higher resistance levels if buying pressure persists. However, its recent dip to $0.85 highlights it as a potential support level.

    BONK price extends weekly gains to 41%

    Bonk (BONK), another Solana-based memecoin, has gained an impressive 41% over the past week. The token traded to intraday highs of $0.000024 as memecoins mirrored Bitcoin’s rally.

    BONK price chart by CoinMarketCap

    The memecoin is eyeing gains amid the sector’s recent performance that signals possible upward movement.

    As Bitcoin and Ethereum continue to drive market sentiment, BONK may look to break to the all-time highs of $0.00005916 seen in November 2024.

    As Bitcoin price hits new highs, altcoins and memecoins are benefiting from the spillover effect, with PEPE, WIF, and BONK among top gains

    Source link

  • SYRUP, MOVE, DEXE among top gainers as cryptocurrencies eye fresh gains

    SYRUP, MOVE, DEXE among top gainers as cryptocurrencies eye fresh gains

    Bitcoin And Cryptocurrencies

    • Cryptocurrencies are up as Maple Finance (SYRUP) price spikes 19% amid institutional DeFi adoption.
    • The Movement (MOVE) token gained 17% as price hits $0.19 on rising volume.
    • DeXe’s DEXE token jumped 10% in 24 hours to hit highs above $9 after a sharp rebound off $5.30.

    Maple Finance (SYRUP), Movement (MOVE), and DeXe (DEXE) have posted remarkable price moves in the past 24 hours, all up by double-digits as cryptocurrencies bid for further gains.

    The upside action for these altcoins come as Bitcoin holds above $106k, and stock futures suggest investors are pricing in a thawing in the Israel-Iran hostilities.

    At the time of writing, SYRUP traded around $0.62, up nearly 19% in 24 hours. Meanwhile, MOVE hovered near $0.18 and DEXE changed hands at highs of $9.10, up 17% and over 10% respectively.

    Analysts at QCP Group summed up the market sentiment in a post on X:

    “Israel resumed strikes shortly after a fragile ceasefire, but markets barely reacted. Traders seem to have priced in peace or stopped waiting. Risk appetite surged as the Nasdaq 100 hit record highs and the S&P 500 neared its 2020 peak. Oil also returned to pre-conflict levels.”

    Maple Finance (SYRUP) price

    Maple Finance’s SYRUP token has soared 19% in the last 24 hours, trading to highs of $0.62 with a market capitalization of $684 million. A 24-hour trading volume of $188 million, up 24% in this period,  reflects strong market confidence.

    The price rally aligns with broader crypto gains,with top altcoins also rallying.

    However, Maple’s transition to a leading on-chain asset manager, and blending traditional finance expertise with decentralized finance (DeFi) innovation, is seeing industry take notice.

    Maple’s lending and structured products are appealing to institutional investors, which is likely to buoy the $SYRUP token further.

    Currently, Coinglass data shows open interest in SYRUP is up 56% to nearly $69 million, while derivatives volume has jumped to over $308 million.

    Movement (MOVE) surges to $0.19

    Movement’s MOVE token has climbed 17% over the past day, reaching $0.19.

    A look at the charts also shows that MOVE is up more than 42% in the past week, with gains coming amid fresh interest in the token. Move Foundation’s buyback initiative is part of the upside catalysts, with 10 million and 8 million repurchased on June 20 and June 22 respectively.

    DeXe (DEXE) price jumps to $9

    DeXe’s DEXE token rose sharply after tapping support near $5.30 on Wednesday.

    With gains of over 10% in 24 hours, the token’s price jumped to a high of $9.10, rising amid a 560% spike in daily volume. Per CoinMarketCap, the daily volume for DEXE stood at $104 million at the time of writing.

    Gains for DeXe come as its governance model, which allows DEXE holders to influence protocol decisions, strengthens community trust.


    Source link

  • Crypto news today: Bitcoin bulls eye $100K breakout; SUI, AVAX charts show potential

    Crypto news today: Bitcoin bulls eye $100K breakout; SUI, AVAX charts show potential

    Crypto news today: Bitcoin bulls eye $100K breakout; SUI, AVAX charts show potential

    • Bitcoin gained over 10% this week, testing key resistance near $95,000 amid strong buying.
    • US Spot Bitcoin ETFs saw massive $3.06 billion weekly inflows, signaling renewed institutional interest.
    • Avalanche (AVAX) consolidates near $23.50 resistance; a breakout could target $31.73 (double-bottom).

    Bitcoin demonstrated renewed strength this week, posting gains of over 10% as determined buyers pushed the price back towards the significant overhead resistance level near $95,000.

    While consolidating below this key hurdle, the fact that buyers haven’t ceded significant ground suggests underlying bullish conviction, further supported by robust institutional inflows and optimistic analyst projections.

    ETF inflows signal renewed institutional appetite

    The sharp upward move in Bitcoin’s price has been significantly bolstered by resurgent buying activity in the US spot Bitcoin exchange-traded funds (ETFs).

    Data from Farside Investors revealed impressive weekly inflows totaling $3.06 billion into these funds.

    Commenting on this influx, Bloomberg ETF analyst Eric Balchunas highlighted on X (formerly Twitter) how notable it was to witness “HOW FAST the flows can go from 1st gear to 5th gear,” indicating a rapid acceleration in institutional demand.

    This renewed buying coincides with bullish technical and quantitative signals. 21st Capital co-founder Sina noted on X that Bitcoin had reclaimed its “power-law price,” a model suggesting considerable long-term upside.

    Sina’s Bitcoin Quantile Model projects potential targets between $130,000 and $163,000 before the end of 2025.

    Other anonymous analysts, like apsk32, hold even more ambitious short-term targets, predicting a move above $200,000 in the fourth quarter of this year.

    Bitcoin (BTC) price analysis: bulls target $100K

    The price chart reveals a tense battle unfolding near the critical $95,000 resistance.

    Technical indicators currently favor the bulls: the 20-day exponential moving average (EMA), sitting around $88,619, is sloping upwards, and the relative strength index (RSI) is positioned near overbought territory, signaling strong buying momentum.

    A decisive close above the $95,000 mark could act as a powerful catalyst, potentially propelling the BTC/USDT pair towards $100,000 and subsequently to the $107,000 region.

    However, sellers are expected to mount a strong defense in the zone between $107,000 and $109,588.

    Conversely, the 20-day EMA serves as crucial near-term support.

    A break below this level could invalidate the immediate bullish momentum and potentially pull the price back into the broader range between $73,777 and $95,000.

    Looking at the 4-hour chart, bears are actively defending the $95,000 level but have struggled to push the price decisively below the shorter-term 20-EMA.

    A rebound off this moving average would strengthen the case for an eventual breakout above $95,000, targeting $100,000.

    However, failure to hold the 4-hour 20-EMA could lead to a deeper pullback towards the 50-simple moving average (SMA), a key level bulls must defend to prevent a slide towards $86,000.

    Sui (SUI) price analysis: testing resistance, eyeing upside

    Sui (SUI) has encountered resistance near the $3.90 level.

    However, the pullback from this high has been relatively shallow, indicating that bulls are holding their positions rather than rushing to take profits.

    If the price remains above the 38.2% Fibonacci retracement level at $3.14, buyers are likely to make another attempt to push the SUI/USDT pair above $3.90.

    A successful breakout could see the price surge towards $4.25 and potentially $5.00.

    On the downside, a break below $3.14 would signal the start of a more significant correction, potentially targeting the 50% retracement level at $2.94.

    Buyers are expected to defend the zone between $2.94 and the 20-day EMA (currently around $2.69).

    The 4-hour chart shows support near the 20-EMA, but sellers remain active at higher levels.

    A break below the 4-hour 20-EMA could trigger a drop to $3.14, while a push above the
    3.81−3.90 resistance is needed to confirm the next leg up towards $4.25.

    Avalanche (AVAX) price analysis: range consolidation, breakout potential

    Avalanche (AVAX) has been consolidating within a range defined by support at $15.27 and resistance near $23.50.

    Trading within such ranges often involves buying near support and selling near resistance.

    While buyers haven’t yet managed to decisively break above $23.50, the fact they haven’t given up much ground suggests accumulation might be occurring.

    A breakout above $23.50 would complete a potential double-bottom pattern, a bullish formation with a calculated target objective near $31.73.

    However, this optimistic scenario would be invalidated if the price turns down and breaks below the moving averages, suggesting the range-bound action might persist.

    On the 4-hour chart, AVAX has been consolidating tightly between $21.60 and $23.10. This narrow range indicates bulls are holding firm, anticipating further upside.

    A break above $23.10 could trigger a move towards $25, likely overcoming the resistance at $23.50.

    Conversely, a drop below $21.60 would signal weakening bullish resolve, potentially pulling the price down towards $19.50.

    Source link