

- The Graph (GRT) price was up 15% and above $0.10, rising as most altcoins gained.
- Bitcoin’s bullish flip this past week could boost altcoins, including GRT.
- The Graph’s price is above a key level after a breakout of a technical pattern.
The Graph (GRT) has emerged as one of the standout performers in the latest crypto rebound, gaining over 15% as sentiment across digital assets turned sharply positive.
The move follows Bitcoin’s rally to above $94,000, driven in part by speculation around easing trade tensions and a broader macroeconomic tailwind that lifted risk assets, including equities.
That momentum spread to altcoins, with GRT among the top gainers within the 100 largest tokens by market capitalization.
Notably, The Graph’s price action in the past 24 hours saw buyers break above a key technical pattern.
It’s an outlook that mirrors the moves for Sui and Arbitrum prices.
The Graph price jumps 15% as altcoins rise
As noted, The Graph’s price has climbed 15% in the past day. It is also more than 31% up in the past week, which aligns with a broader altcoin rally after BTC spiked to above $94k.
On-chain activity, including staking by Indexers and Curators, continues to grow, potentially fueling further price gains for the altcoin.
Currently, GRT is trading at $0.102, having jumped to an intraday high of $0.103.
The altcoin, which boasts a 24-hour trading volume of $59 million (up 44%) and market cap of $997 million, is the 71st largest among cryptocurrencies.
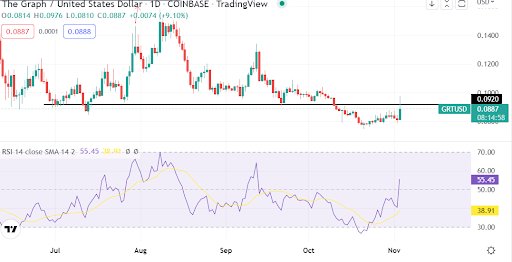
Strong buying momentum, driven by renewed interest in decentralized infrastructure projects, has pushed The Graph price above a key level.
GRT reached its all-time high of $2.88 in February 2021.
Can GRT price break to $0.2?
GRT recently broke through a falling wedge pattern, a bullish technical setup that often signals a trend reversal.
In most cases, a retest of a key hurdle and subsequent explosive move adds to the intensity of a breakout.
As an analyst points out in the chart below, The Graph price’s breakout occurred as GRT surpassed the $0.1 resistance level.
While not a major move, it’s an area representing a key psychological and technical barrier highlighted with a falling wedge.
$GRT is broke through the falling wedge pattern pic.twitter.com/pYMYeeH8Lq
— CW (@CW8900) April 25, 2025
In the market, analysts look at falling wedge patterns, characterized by converging trend lines and declining volume, as indicative of a potential bullish flip. Buyers step in to push prices higher.
Recently, another analyst shared a GRT price chart showing a “perfect ABCD harmonic pattern.”
According to Alpha Crypto Signal, the altcoin was poised for a recovery, with this scenario unfolding on the weekly time frame.
#GRT HTF Analysis:$GRT has formed a perfect ABCD harmonic pattern and is now looking primed for a recovery on the weekly timeframe. $GRT just needs to break out of this box zone, and once it does, it’s ready to go much higher. Actively watching $GRT and grabbing some spot… pic.twitter.com/PI5mVpxvxu
— Alpha Crypto Signal (@alphacryptosign) April 21, 2025
If positive sentiment prevails, GRT price could target $0.15 and then $0.2.
However, failure to maintain above $0.1 might see GRT retest support near $0.072.


 Source – TradingView