Tag: headwinds

  • Bitcoin (BTC) battles macro headwinds despite improved ETF inflows

    Bitcoin (BTC) battles macro headwinds despite improved ETF inflows

    Bitcoin (BTC) battles macro headwinds

    • Bitcoin price remains range-bound amid long-term holder selling and falling demand.
    • US Bitcoin ETFs inflows signal cautious institutional optimism.
    • Macro uncertainty from the Fed and government shutdown keeps BTC under pressure.

    Bitcoin (BTC) continues to navigate turbulent market conditions as macroeconomic uncertainty and institutional dynamics shape its near-term trajectory.

    Despite renewed interest from investors and a notable surge in Bitcoin ETFs, the world’s largest cryptocurrency faces persistent pressure from long-term holder selling, cautious institutional sentiment, and a complex macro backdrop influenced by the Federal Reserve and ongoing government shutdown developments.

    Analysts and strategists are watching closely as BTC balances between cyclical signals and broader market realities in November.

    Bitcoin price struggles amid range-bound trading

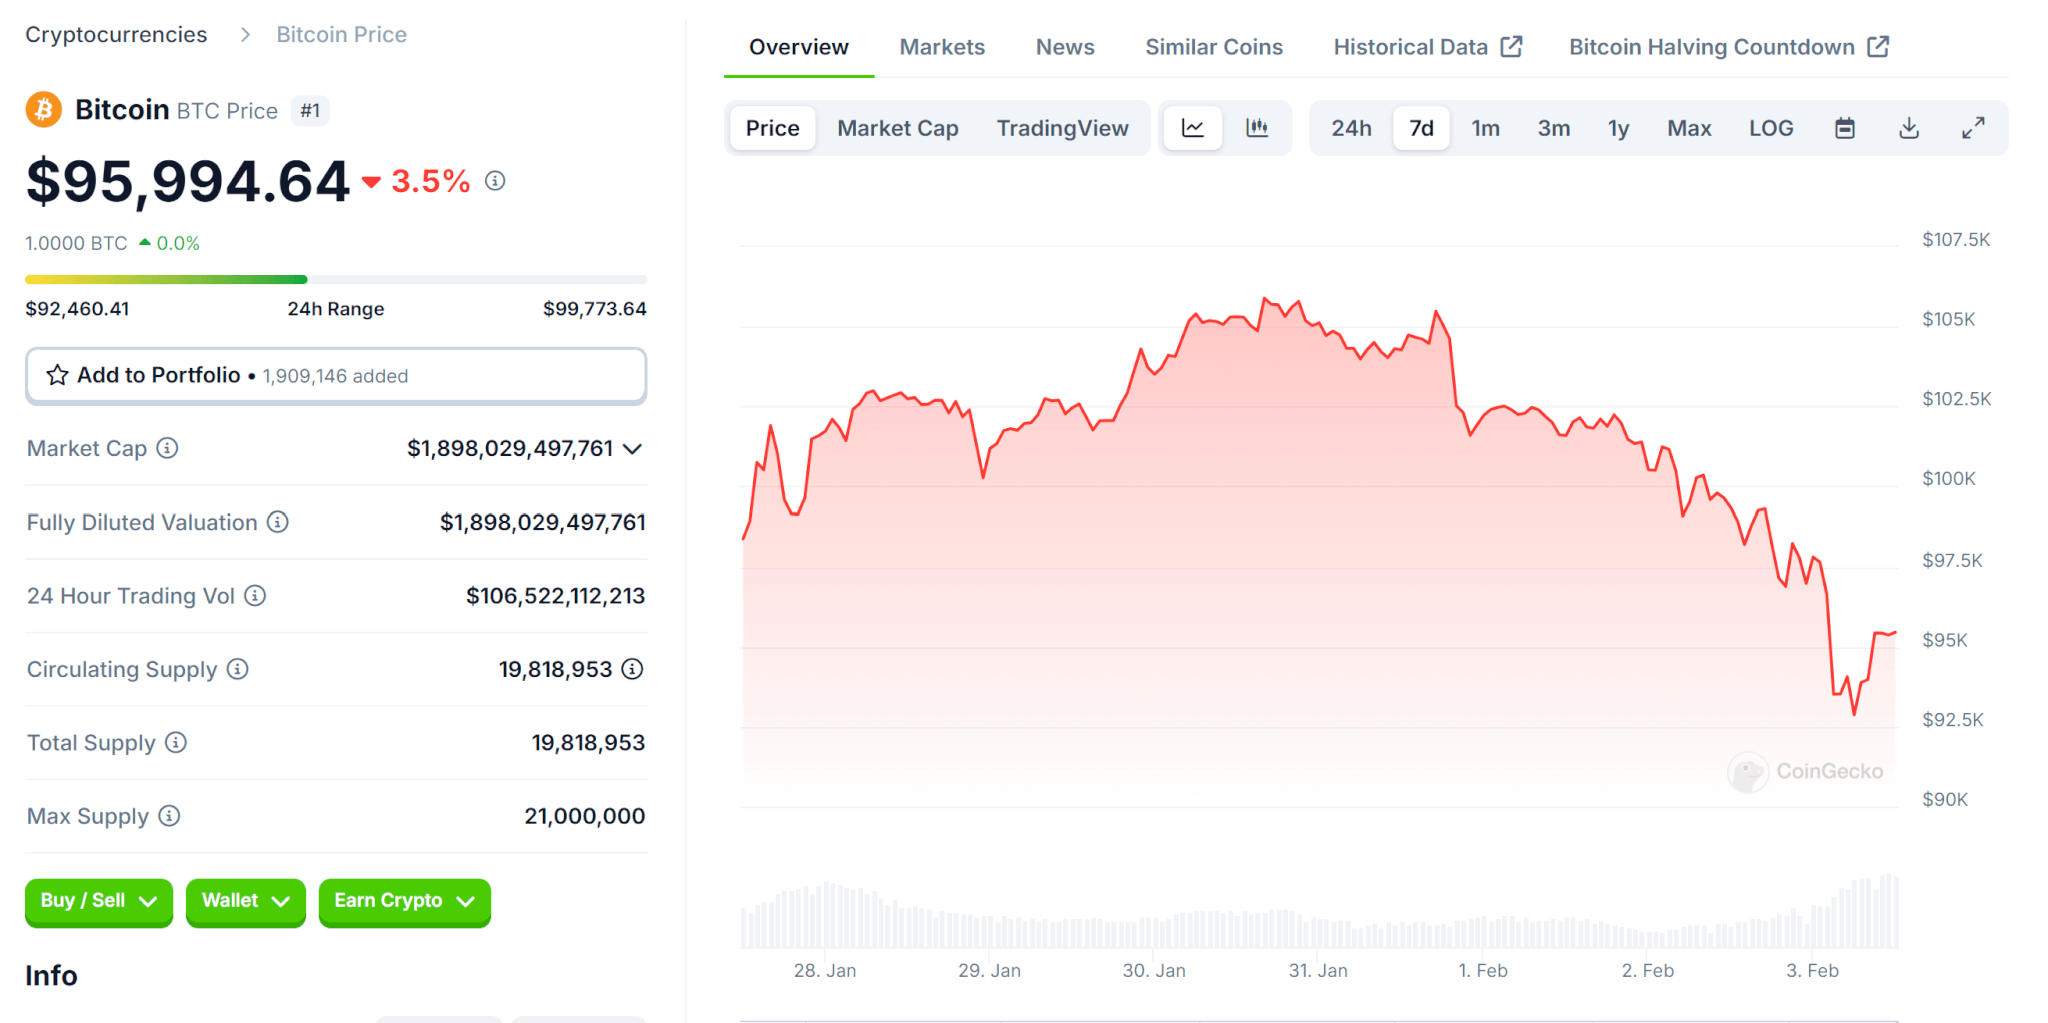
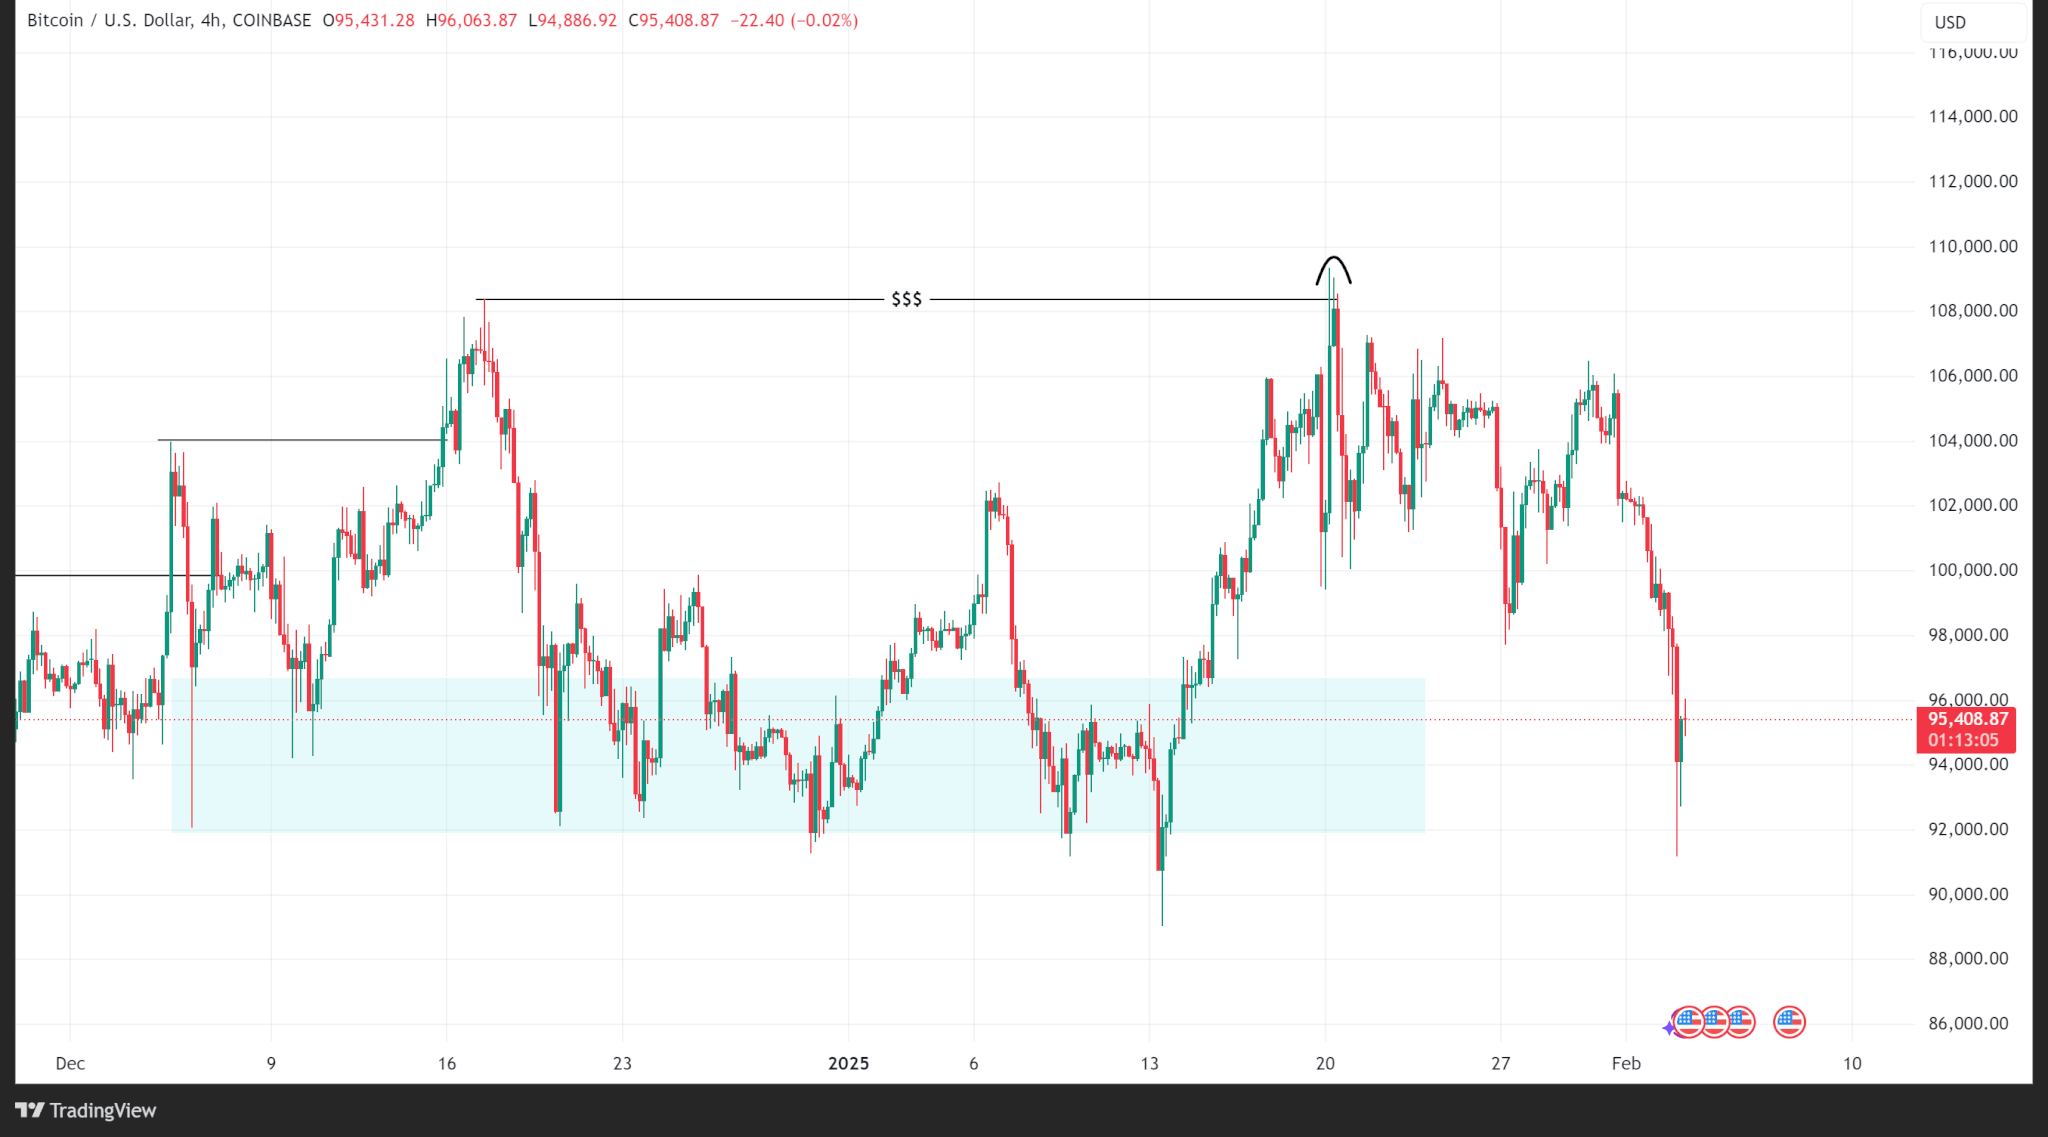
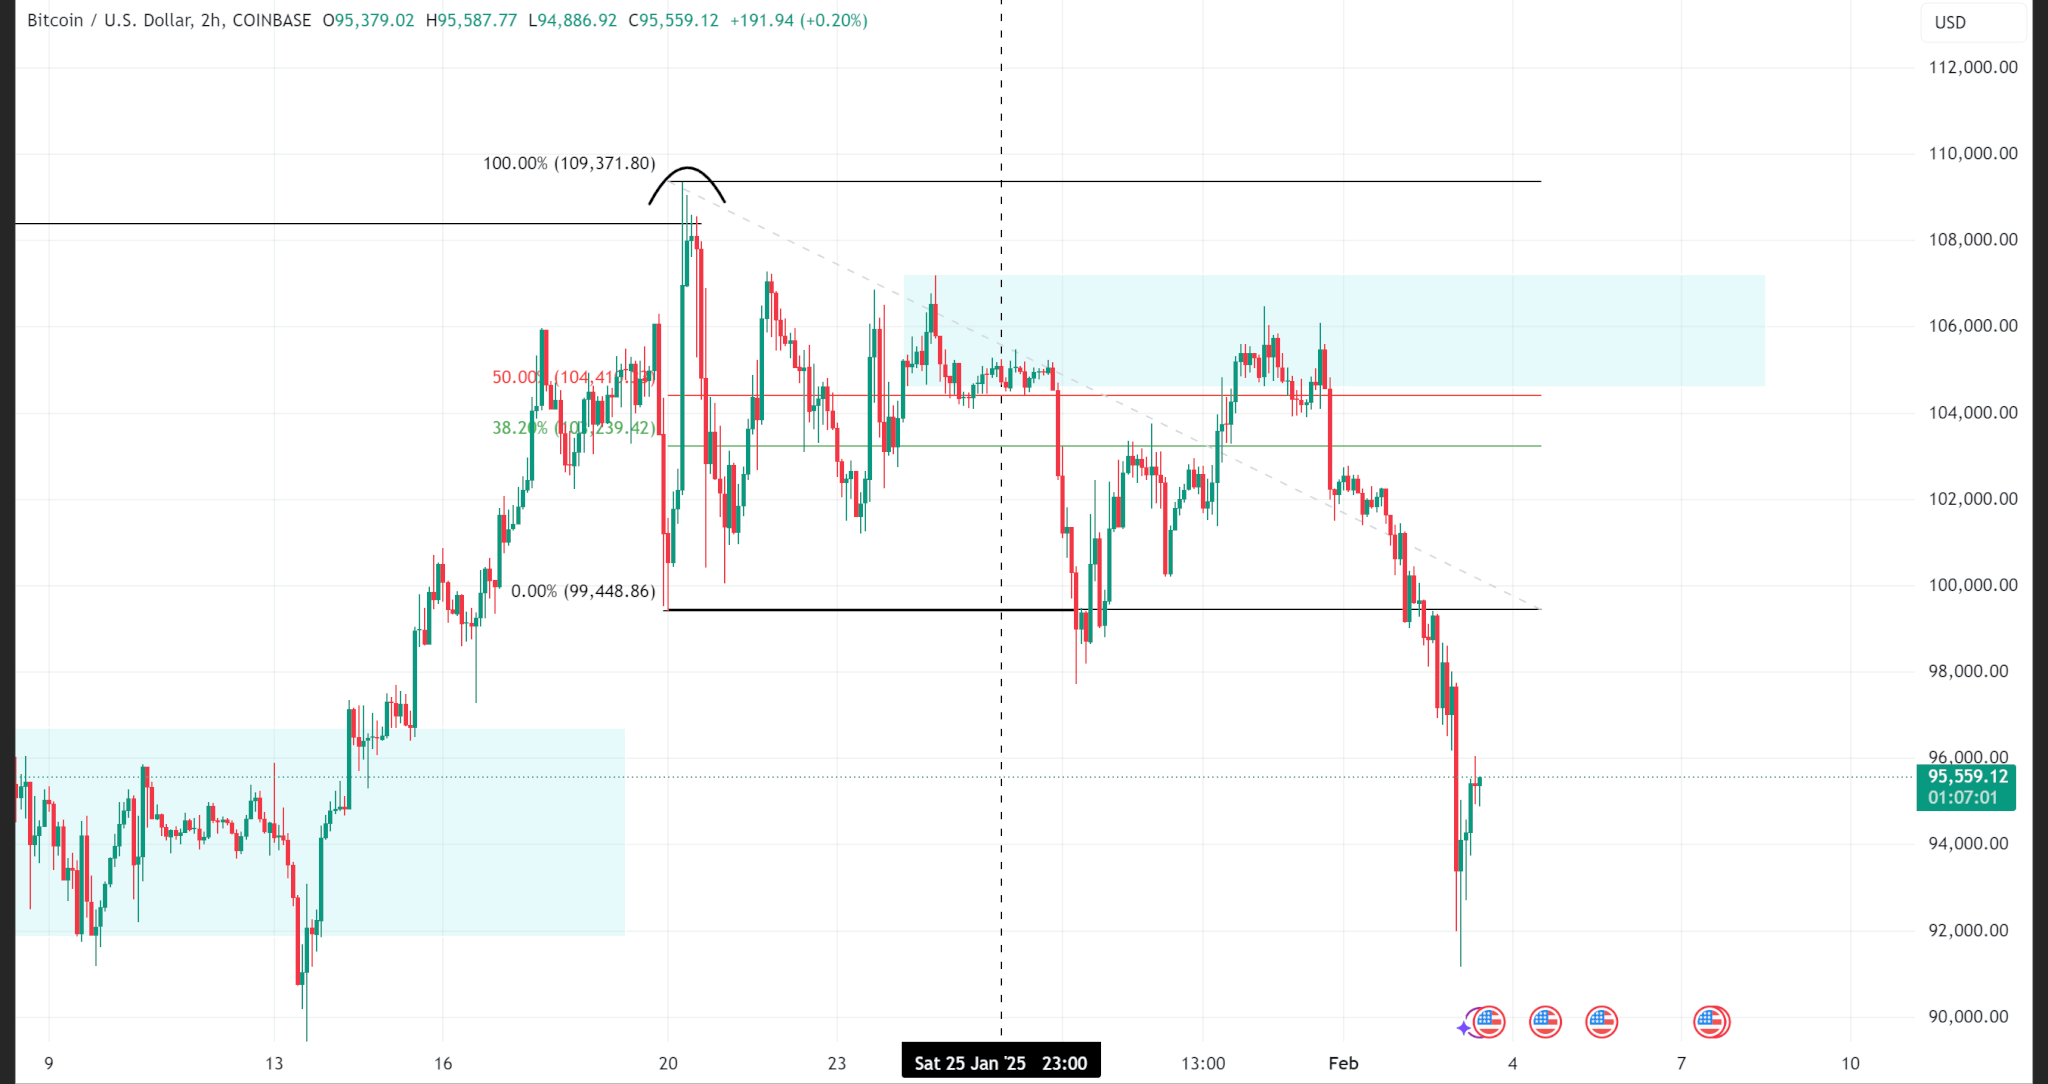
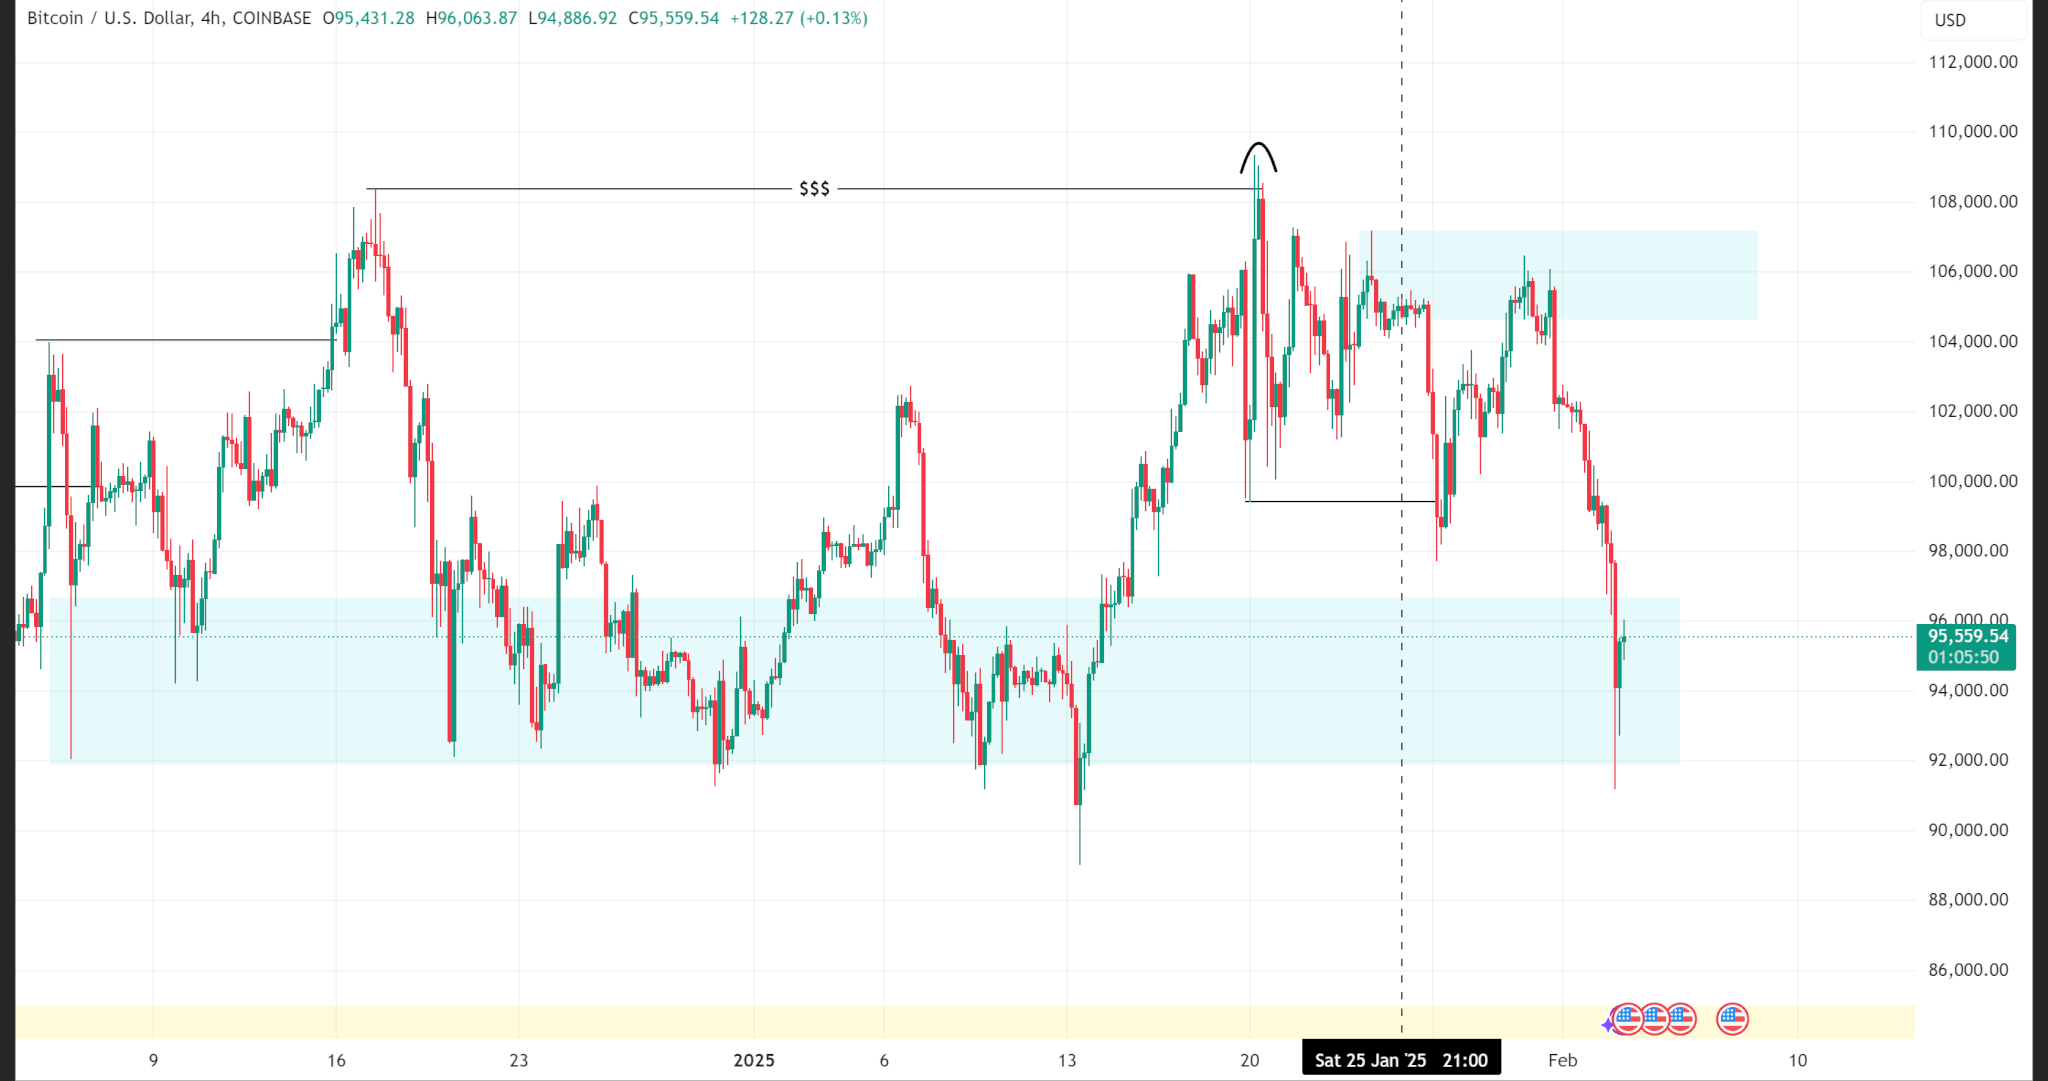
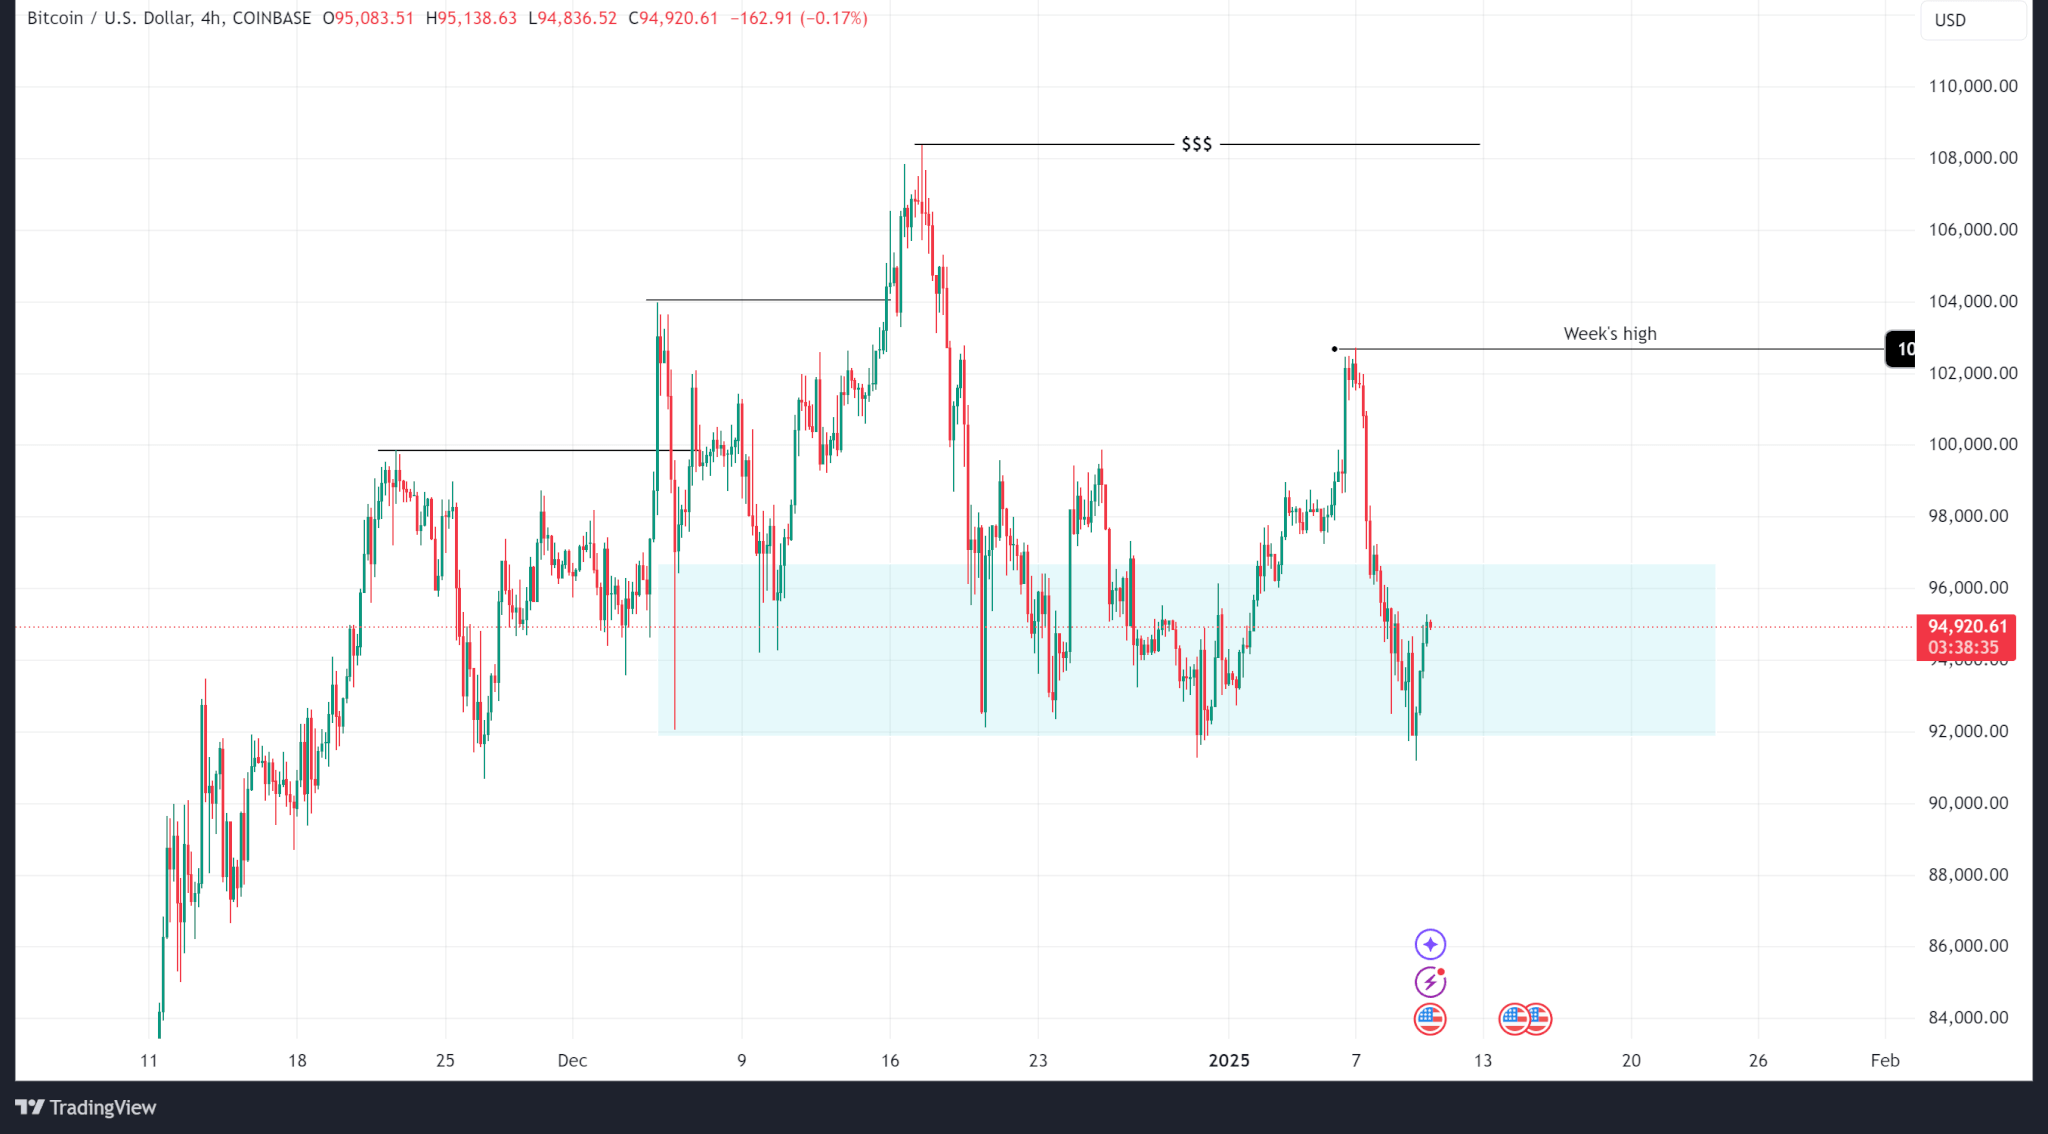
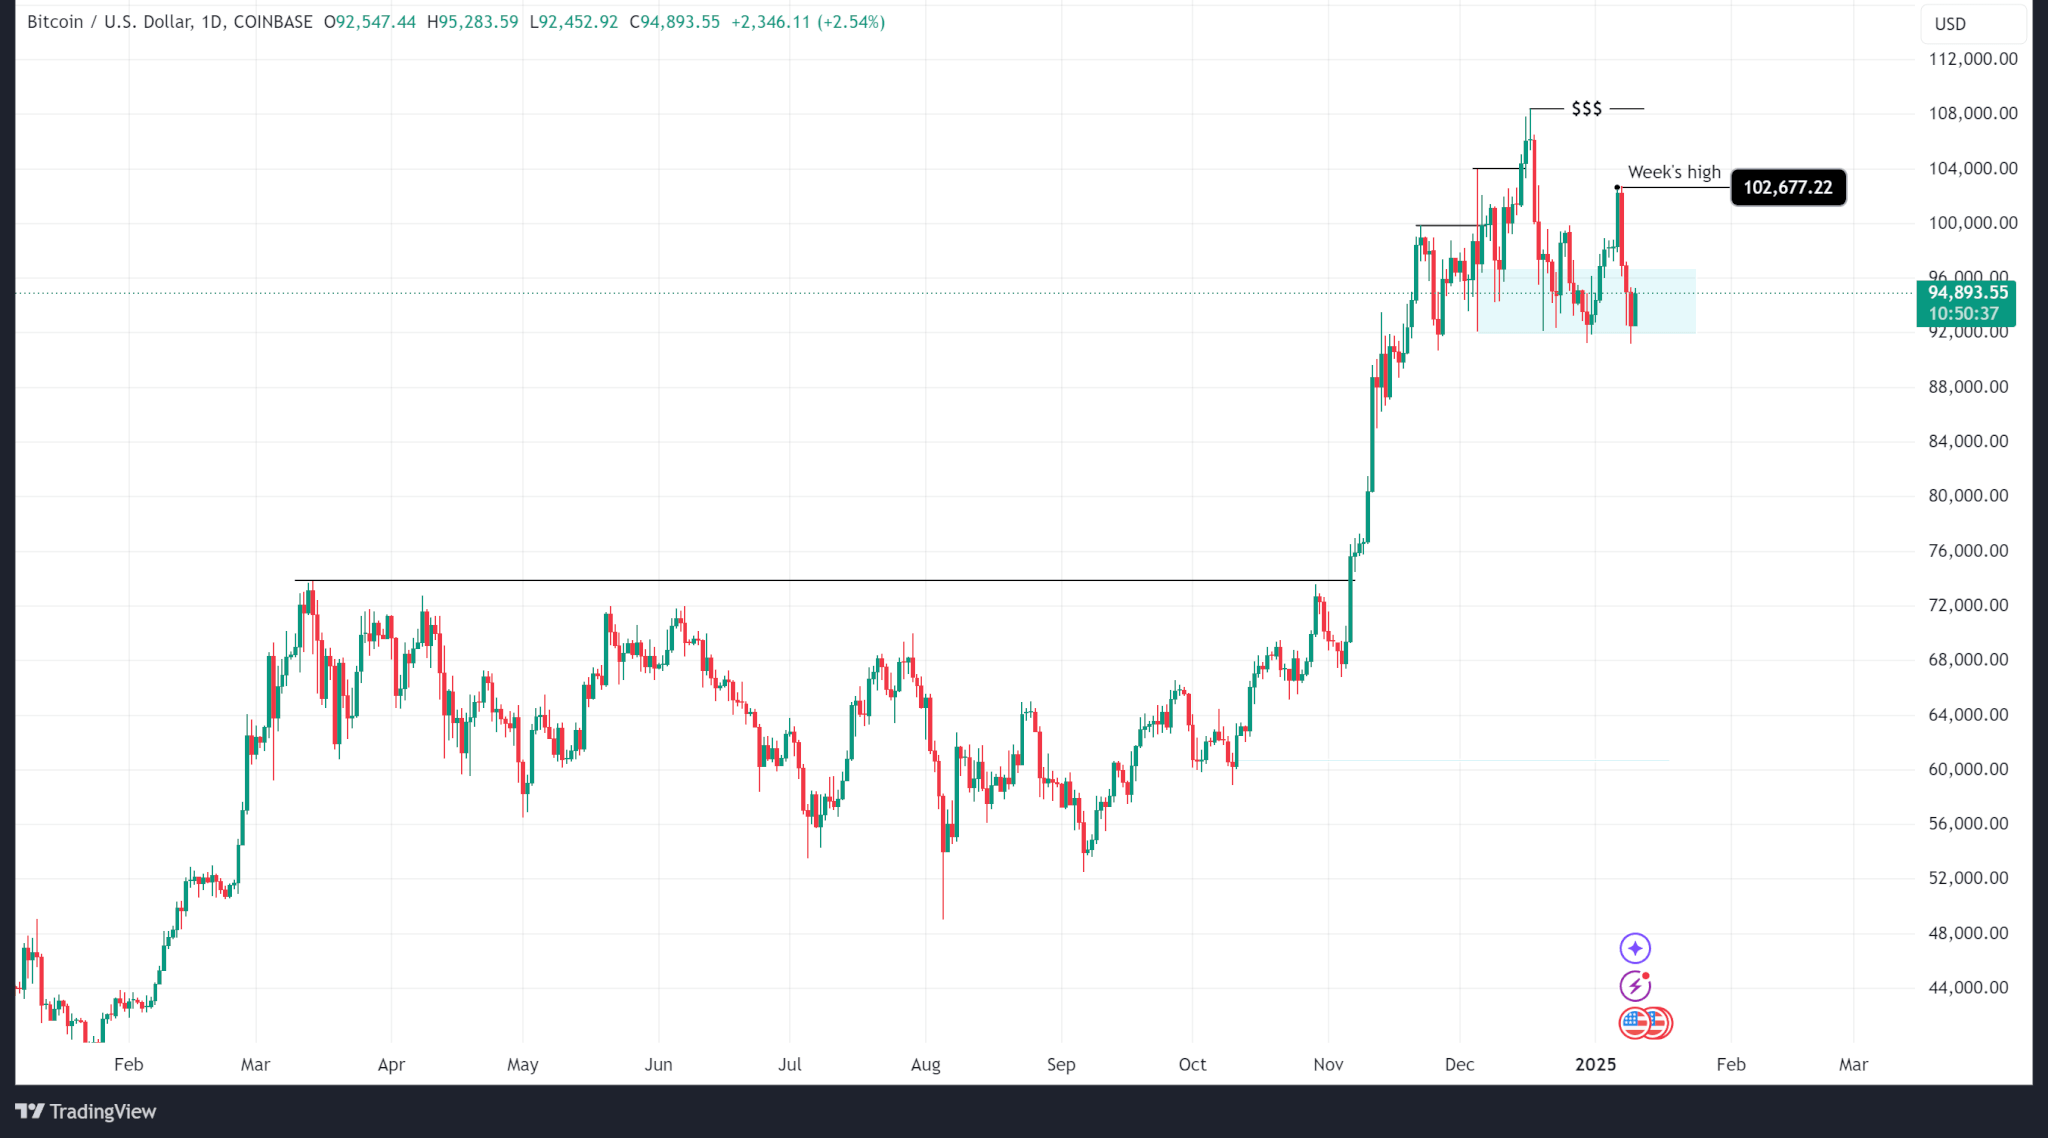
    Bitcoin price has remained largely trapped between $106,000 and $116,000 over the past two weeks, signalling a period of consolidation rather than upward momentum.

    Long-term holders have accelerated their monthly distribution to roughly 104,000 BTC, marking one of the heaviest selling waves since mid-July, according to the recent Bitfinex report.

    This persistent supply pressure is coinciding with muted institutional demand following October’s sharp liquidation event, leaving BTC caught in a sideways range with limited short-term catalysts.

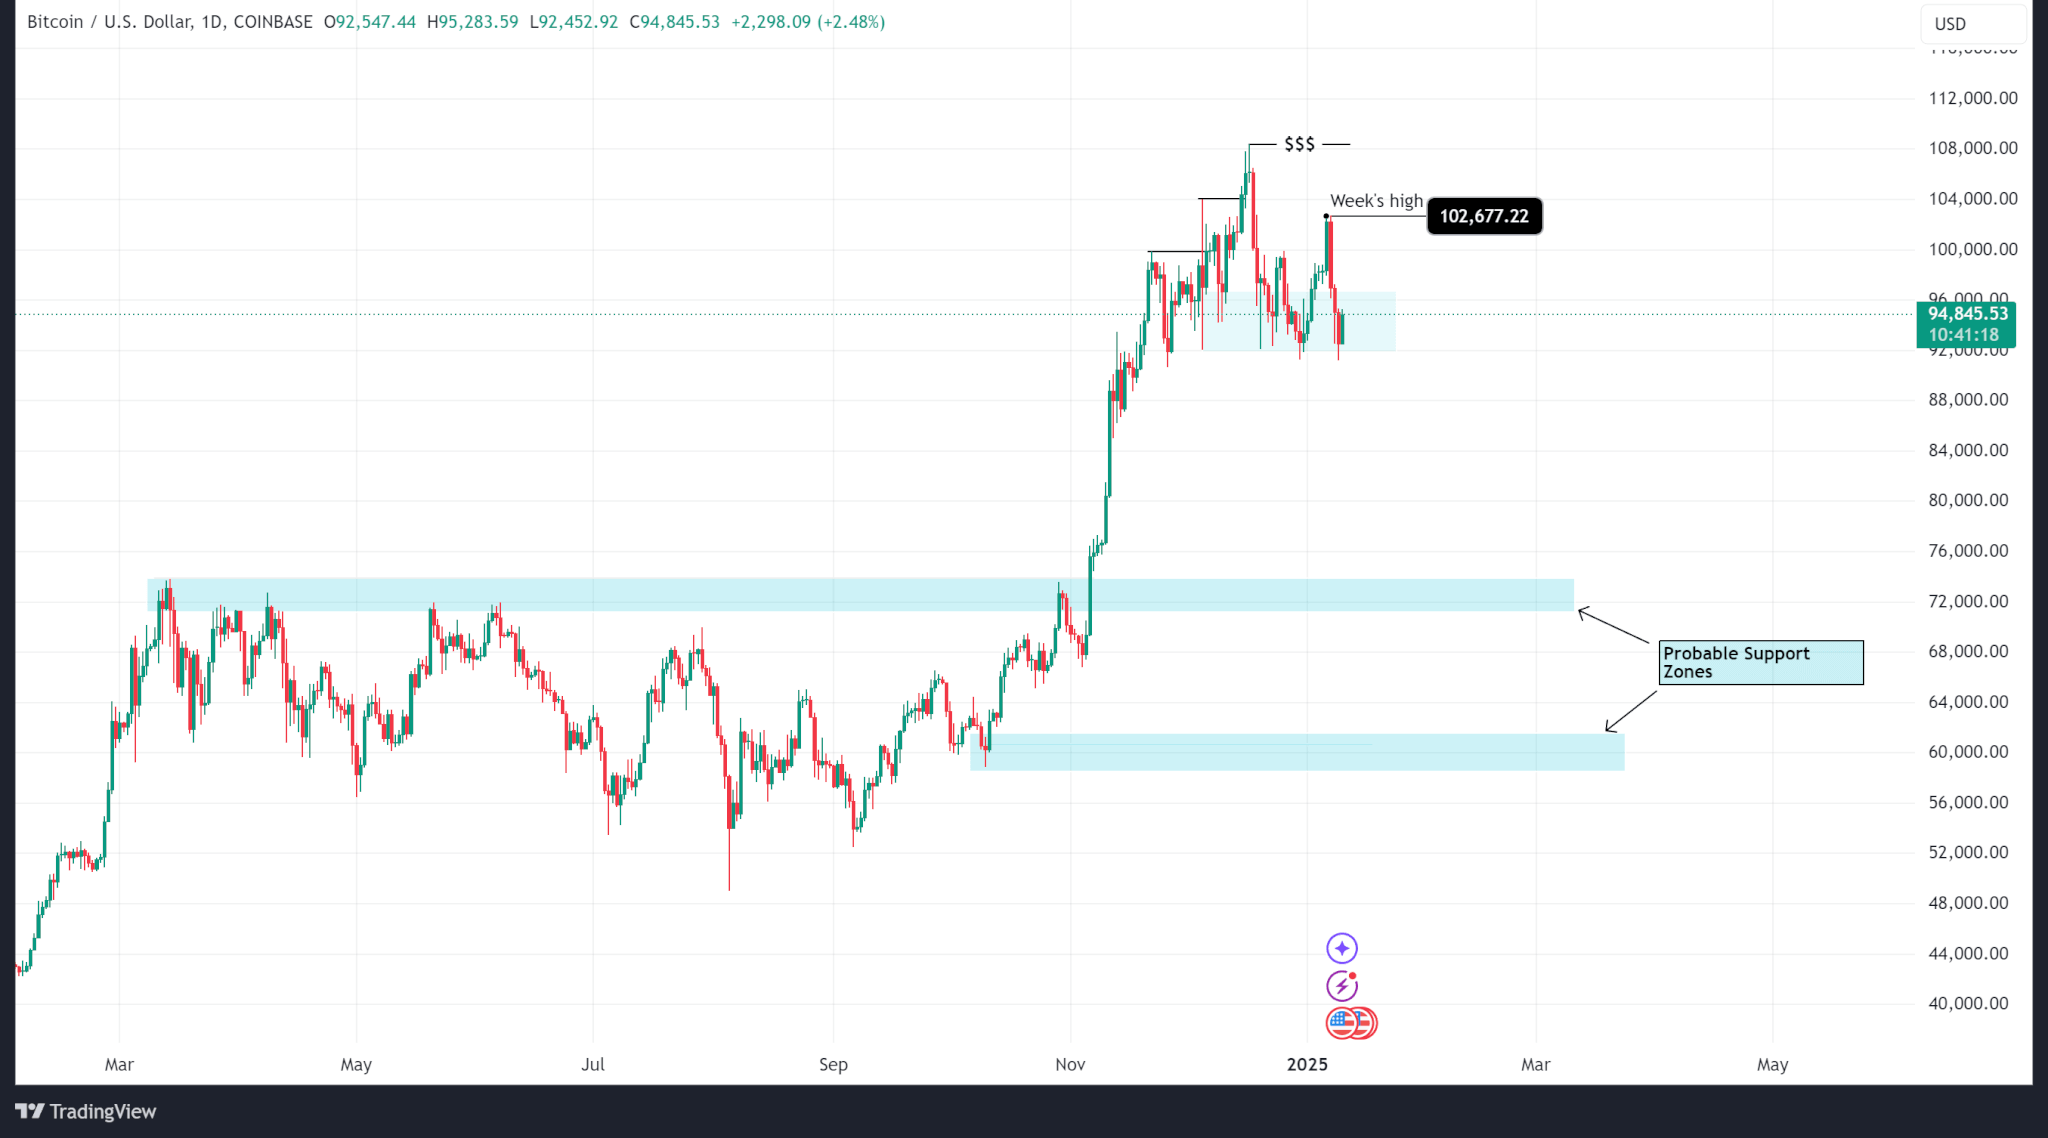
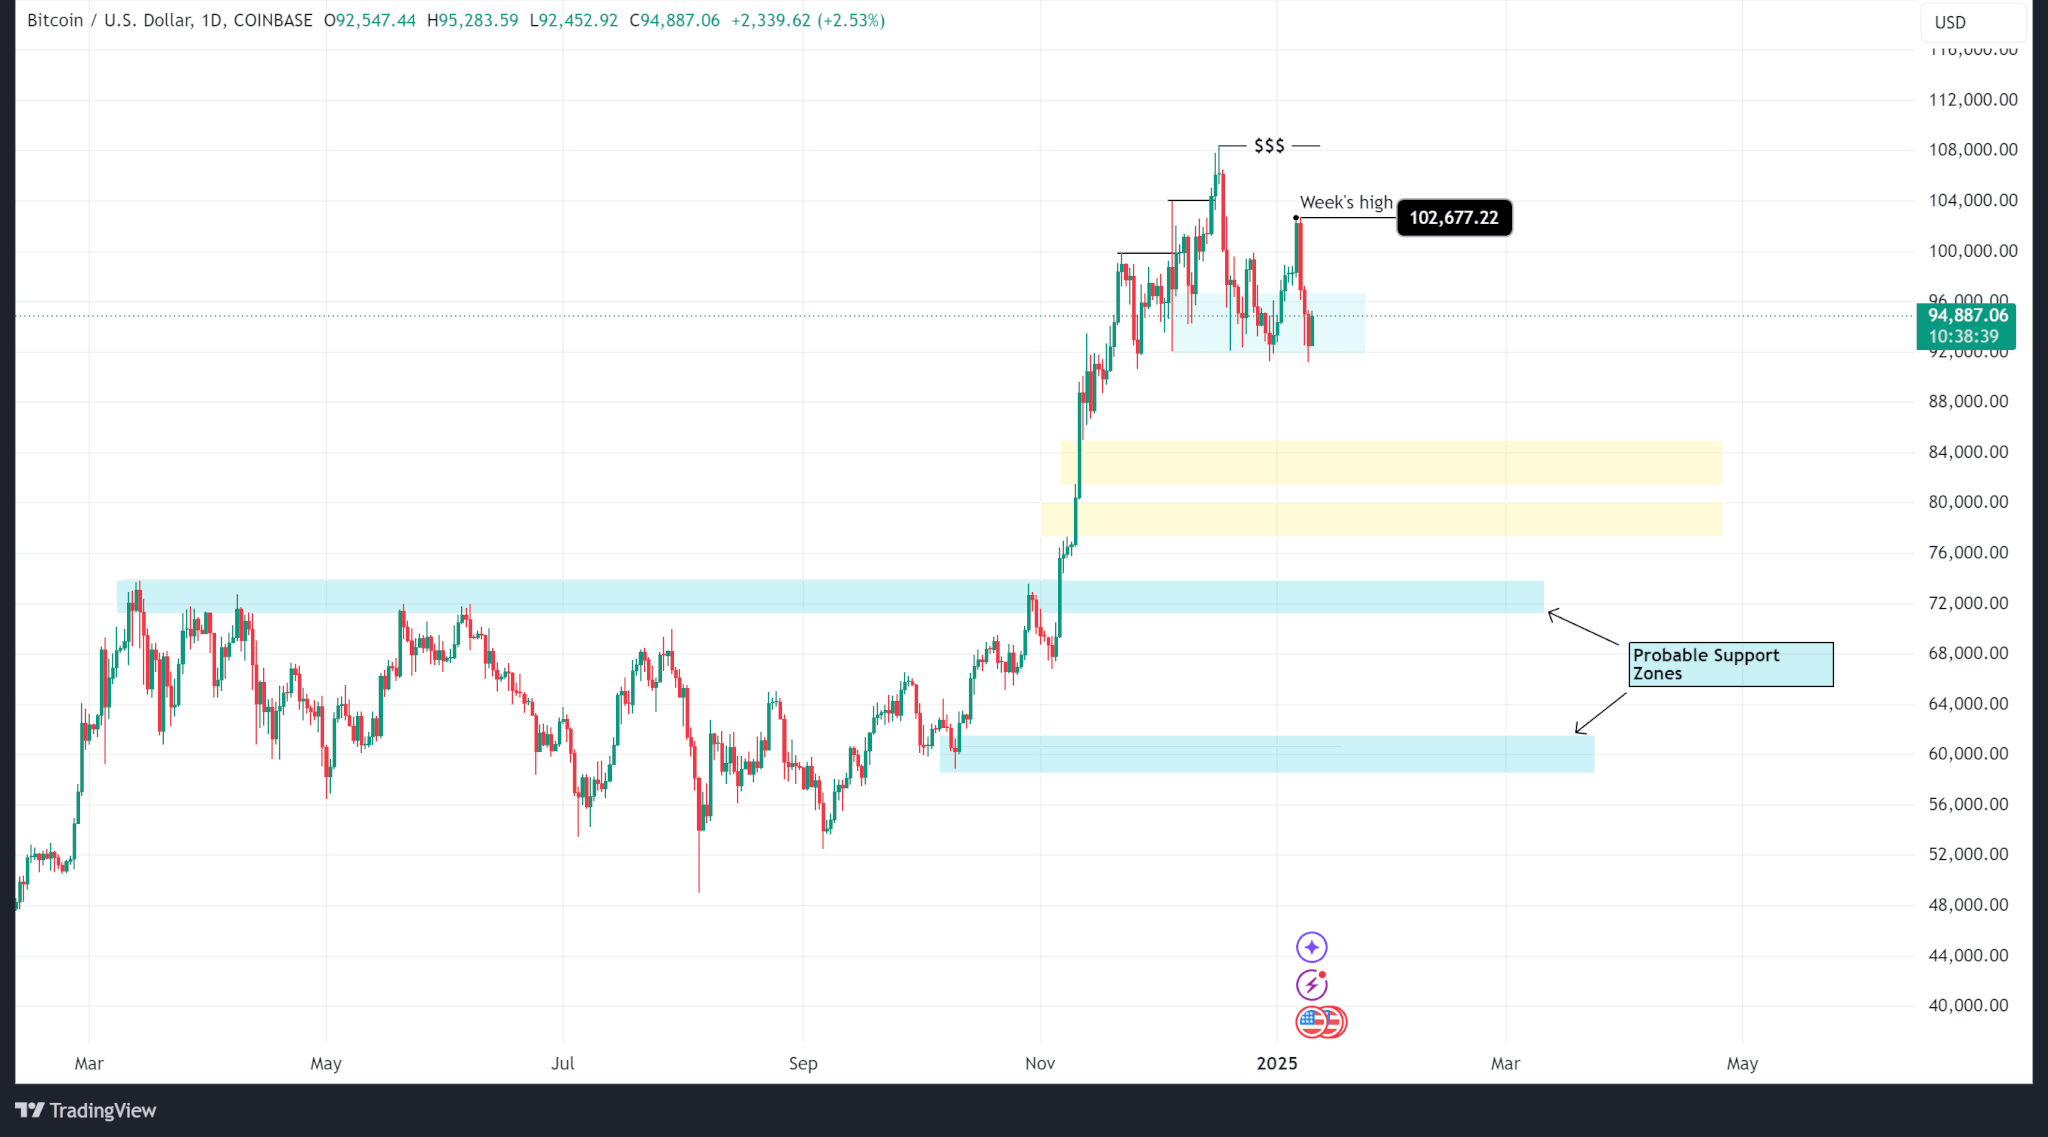
    Analysts warn that unless ETF inflows or new spot demand increase, the cryptocurrency could test support near $106,000, and a sustained breach of this level might open the path to $100,000.

    ETF inflows signal cautious optimism

    Despite these headwinds, Bitcoin ETFs have shown signs of recovery, injecting optimism into the market.

    On November 11, US spot Bitcoin ETFs recorded $524 million in cumulative net inflows.

    US Bitcoin ETFs inflows
    Total Bitcoin Spot ETF Net Inflow (USD) | Source: Coinglass

    This return of demand, alongside smart money traders adding net long positions totalling over $8.5 million, highlights a growing, albeit measured, confidence among institutional participants.

    Analysts have noted that sustained ETF inflows may signal an end to the broader de-risking phase observed after the market downturn, even as retail participation remains subdued.

    Macro factors keep BTC on edge

    Despite increased ETF inflows, macro conditions continue to weigh heavily on Bitcoin (BTC).

    The Federal Reserve’s recent 25-basis-point rate cut and the formal end of its balance sheet runoff are tempered by internal division over the next steps, with some officials citing risks from persistent inflation and others warning of slowing labour markets.

    Meanwhile, the Secured Overnight Financing Rate recently plunged to 3.92%, which financial analyst Shanaka Anslem described as indicative of market panic.

    These developments, combined with falling consumer confidence and cooling wage growth, have created uncertainty around near-term capital flows and investor appetite for risk assets like Bitcoin.

    The ongoing government shutdown adds another layer of complexity.

    While the Senate moves toward a potential resolution, analysts note that the relief may boost equities more than cryptocurrencies, as capital appears to rotate toward traditional financial markets while liquidity waits on the sidelines for normal economic data to resume.

    These dynamics have contributed to continued downside pressure on BTC, even as technical and ETF-related signals point to potential stabilisation.

    Bitcoin price outlook for November

    Looking ahead, November may not deliver the historic rallies often seen in the penultimate month of the year, as Bitcoin (BTC) remains caught between conflicting forces.

    While ETF inflows and smart money activity provide a foundation for renewed optimism, ongoing distribution by long-term holders, macro uncertainty, and cautious institutional behaviour continue to weigh on the Bitcoin price.


    Source link

  • Bitcoin steady near $95K, but is market ‘blind’ to economic headwinds?

    Bitcoin steady near $95K, but is market ‘blind’ to economic headwinds?

    Crypto news today: Bitcoin holds $94K despite volatility; analyst warns market ignores risks

    • Bitcoin recovered from an intraday dip to trade near $94,700, down slightly over 24 hours.
    • US stocks also recovered late after falling over 2% early on weak economic data.
    • Altcoins generally underperformed Bitcoin, with the CoinDesk 20 index down 2%.

    Cryptocurrency markets navigated a choppy session on Wednesday, ultimately demonstrating resilience alongside traditional US equities as both asset classes clawed back from earlier declines.

    Despite this recovery, underlying economic concerns and persistent uncertainty surrounding US trade policy kept investors watchful, with some analysts questioning the market’s apparent disregard for potential headwinds.

    Crypto recovers from dip, altcoins lag

    While characterized by volatility, the overall trend for crypto on Wednesday remained one of range-bound trading.

    Shortly after the close of US equity trading, Bitcoin (BTC) was holding steady around $94,700, marking only a marginal 0.4% decline over the preceding 24 hours.

    This modest change, however, belied earlier volatility where the leading cryptocurrency had dipped nearly 2%, mirroring weakness seen in stocks during the initial part of the session.

    While Bitcoin recovered most of its lost ground, many alternative cryptocurrencies (altcoins) failed to keep pace, suggesting a degree of risk aversion within the digital asset space.

    The broader CoinDesk 20 index, which tracks leading cryptocurrencies excluding stablecoins and certain other tokens, slumped 2% over the 24-hour period.

    Notable decliners included litecoin (LTC), Ripple’s XRP, Avalanche (AVAX), and Chainlink (LINK), each shedding roughly 4%.

    Wall Street stages late-day comeback

    This pattern of early weakness followed by a late recovery closely mirrored the action on Wall Street.

    Major US stock indices initially tumbled by 2% or more following the release of less-than-stellar economic news, only to regain substantial ground throughout the trading day.

    The S&P 500 managed to close slightly in positive territory, while the Nasdaq Composite finished with a minor dip of just 0.1%.

    Economic jitters, tariff talk persist

    Despite this market resilience, the underlying economic picture presented cause for concern, contributing to the earlier sell-off.

    Data releases pointed towards potential slowing in the US economy.

    Consumer confidence readings hit multi-year lows, and job opening figures came in below expectations, potentially reflecting the impact of ongoing trade tensions and tariff policies.

    The continuing string of lackluster economic data, however, has not appeared to sway US President Trump from his assertive tariff policies.

    Dismissing potential negative consequences for consumers, Trump remarked early Wednesday: “Somebody said all the shelves are going to be open… Well, maybe the children will have two dolls instead of 30 dolls, and maybe the two dolls will cost a couple of bucks more than they would normally. … They have ships that are loaded up with stuff, much of which we don’t need.”

    These comments underscore the ongoing policy uncertainty contributing to market volatility.

    Analyst flags market ‘blindness’ to deeper risks

    This apparent disconnect between weakening economic signals and relatively buoyant market performance drew sharp commentary from some analysts.

    Jeff Park, head of Alpha Strategies at digital asset investment firm Bitwise, expressed concern about the market’s focus.

    “Hard to fathom how blind the market really is,” Park posted on the social media platform X (formerly Twitter).

    He argued that the market’s fixation on potential near-term Federal Reserve interest rate cuts overlooks more significant fundamental risks related to US economic policy and its global standing.

    “A Fed cut means nothing if U.S. creditworthiness is permanently impaired by the global community as resulted by dollar weaponization,” Park stated, suggesting aggressive policies could undermine trust in the US dollar and, by extension, the notion of a “risk-free” US Treasury asset.

    “That’s the mispricing we are talking about here,” he continued.

    “The myopic focus on whether [we] are getting a fed cut in May/June is completely irrelevant if the notion of the risk-free as we know it is fundamentally challenged forever, which means cost of capital globally is going higher.”

    Mixed fortunes for crypto stocks

    Reflecting the somewhat mixed day, crypto-related equities saw modest movements overall.

    Coinbase (COIN) and MicroStrategy (MSTR) posted slight gains, while Bitcoin miner Hut 8 (HUT) stood out as a notable underperformer, declining 5.7%.

    The day’s trading ultimately highlighted a market grappling with conflicting signals – resilience in price action against a backdrop of concerning economic data and persistent policy uncertainty.

    Source link

  • Bitcoin tumbles to $92k as geopolitical headwinds roil markets

    Bitcoin tumbles to $92k as geopolitical headwinds roil markets

    • Bitcoin fell 4.72% over the weekend and another 3.50% during Monday’s Asian session as tensions driven by Trump’s tariffs have investors de-risking their positions
    • Over the weekend, China responded to Trump’s tariffs by indicating interest in imposing tariffs on US goods, while Canada imposed a 25% tariff on CA$155 billion worth of US goods

    Bitcoin tumbled below $100,000 over the weekend, extending losses into today as threats of a possible trade war rock markets worldwide.

    Bitcoin price chart. Source: CoinMarketCap

    While most of Bitcoin’s price decline came this weekend, weakness began when its price failed to swing higher than the $108,000 level two weeks ago (January 20).

    BTC/USD chart. Source: TradingView

    A failure to swing higher can signify insufficient buy pressure to push prices higher. If that is the case, prices will seek the next major liquidity level, which could mean lower prices in the interim, as seen over the last two weeks.

    Scaling down to a lower time frame, Bitcoin’s price continued to break lower below $99,000. This was before retracing to an internal supply zone between the 50.00% and 61.80% Fibonacci levels (the golden zone for retracements) on Thursday, January 30.

    BTC/USD chart. Source: TradingView

    After being rejected by internal supply, the price broke down further on Friday, January 31, and over the weekend to settle at the next major demand level, between $92,000 and $96,000.

    BTC/USD chart. Source: TradingView

    Bitcoin’s price has found some support at $92,000 and is currently up 4.92% from Asian lows of $91,176.

    Wider trade wars stifle markets

    Meanwhile, the wider economic landscape faces uncertainty as a brewing trade war between the US and several of its trade partners, including Canada, Mexico, and China rocks various markets.

    The US tariffs on its largest trade partners, including a 25% tariff on imports from Canada and Mexico, and a 10% tariff on Chinese imports, have sparked tensions between nations.

    In response, Canada imposed a 25% tariff on CA$155 billion worth of US goods, Mexico has announced tariffs on US goods, but has not provided details, while China also announced plans to impose retaliatory tariffs on US goods.

    The result is uncertainty around the expansion of global trade and a de-risking of portfolios, with the crypto market being one of the first on the chopping block.

    Source link

  • Bitcoin price analysis: economic headwinds push price lower

    Bitcoin price analysis: economic headwinds push price lower

    • Bitcoin tested the $92,000 level yesterday after falling from a weekly high of $102,000 as sell pressures mounted
    • Macroeconomic factors cause doubts about the market strength as sticky inflation becomes a concern
    • Spot crypto ETFs logged large outflows on Wednesday following the release of the Fed meeting notes

    Bitcoin’s price has fallen from a high of $102,667 reached on Tuesday, January 7 to $94,890.00 as of publishing, but remains within the last H4 demand zone.

    BTC/USD Chart by Trading View

    While the demand zone between $92,000 and $97,000 may be the last support level on the H4 timeframe, a broader market view shows that BTC is in a premium zone on the daily timeframe. As a result, a push below $92,000 still puts the price in bullish territory.

    BTC/USD Chart by TradingView

    The best technical buy levels would either be at the last break of structure on the daily timeframe or at the 50% Fibonacci level from the lowest point to the break.

    BTC/USD Chart by TradingView

    There are two fair value gaps from which the price could react. While they are not major zones, they could support a continuation back to the external high at $108,000 or a brief relief rally before continued sell to the first probable support zone as noted in a recent TradingView analysis of BTC.

    BTC/USD Chart by TradingView

    This is all predicated on Bitcoin breaking below the $91,000 level.

    Meanwhile, spot crypto ETFs recorded outflows on Wednesday, January 9 after the release of the US Federal Reserve’s meeting minutes. These showed that the Fed is cautious about inflation and the effects of Trump’s incoming policies.

    BTC ETFs bled $568.8 million on Wednesday while ETH ETFs lost $159.4 million with the biggest outflows from Fidelity ($258.7 million for BTC and $147.7 million for ETH).

    Source link