Tag: LTC

  • Litecoin price forecast: what next as LTC drops to key support?

    Litecoin price forecast: what next as LTC drops to key support?

    Litecoin Price Bulls Vs Bear

    • Litecoin trades near $112, just in the green on the day but at risk of fresh losses.
    • The LTC price hovers at key support level as bulls attempt to hold bears off.
    • Bullish crypto market and catalysts such as spot Litecoin exchange-traded funds could help LTC go higher.

    Litecoin (LTC) is trading at $112, about 2% up in the last 24 hours, but in the red over the past week and month time frames.

    Meanwhile, the 24-hour trading volume of $694 million is more than 22% down on the previous day as top altcoins look to bounce.

    As LTC price drops towards the $110 level, can bulls hold onto gains or is the altcoin poised for a revisit of the psychological $100 mark and lower?

    Litecoin price forecast: Is LTC set for a revisit of $90 next?

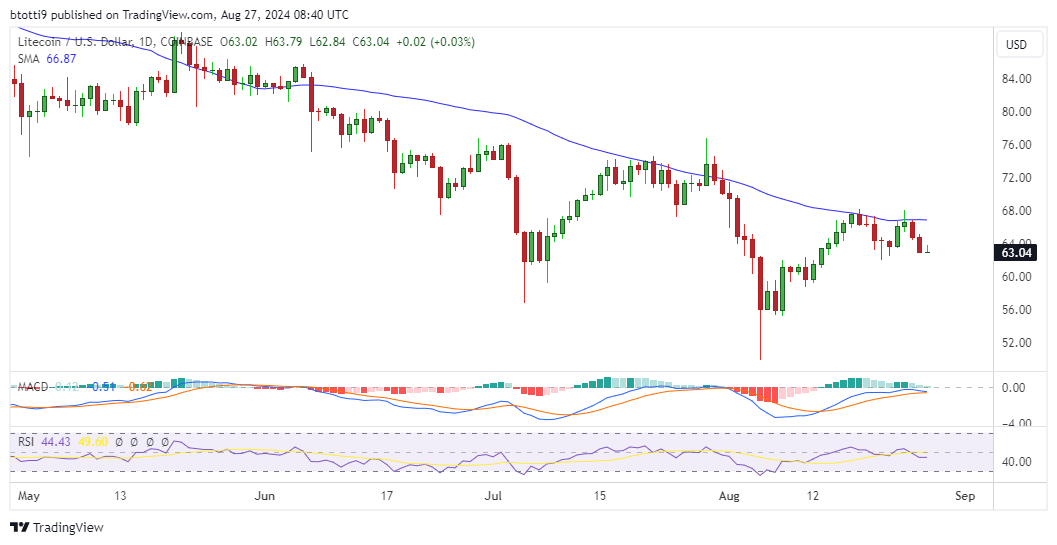
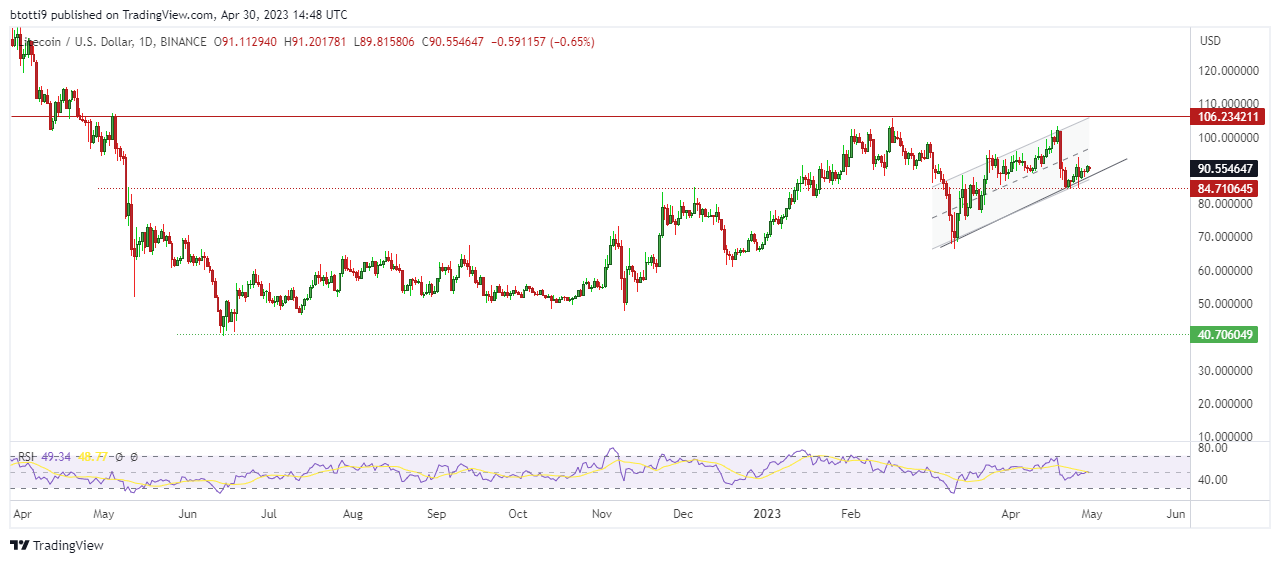
    Litecoin price has broken below the middle line of an ascending channel pattern. Price at $112 suggests a broader crypto pullback could accelerate LTC’s dip to support at $100 and possibly to $90.

    The technical indicators on the daily chart support a likely flip lower, with RSI and MACD giving sellers the upper hand.

    Litecoin Price
    Litecoin chart by TradingView

    Open Interest has also dropped slightly, down to $994 million from the record highs of $1.27 billion hit recently as LTC spiked.  OI in Litecoin futures does notably remain higher than the lows of $800 million seen in early August.

    A break above $120 could thus allow bulls to test the upper channel barrier near $140 and aim for the psychological $200 mark.

    While the Moving Average Convergence Divergence (MACD) indicator shows a bearish crossover from mid-August and prints red histogram bars, a mixed setup has other indicators signaling potential resilience.

    For instance, the Relative Strength Index (RSI) on the daily chart sits at 46, but is upsloping to suggest buyers could keep off a fresh dip towards the oversold territory.

    If RSI pops above the neutral point of 50 and market conditions align, LTC could see the above scenario play out.

    What could help Litecoin price higher?

    Network growth, including a significant hashrate spike, suggests confidence in the proof-of-work coin.

    This and market sentiment point to a scenario where bulls ride the overall crypto uptick in the coming months to drive higher.

    The upcoming approval of spot ETFs, with Litecoin among those with notable high odds of a nod, add to this outlook.

    In this case, the SEC’s October 2025 decisions on spot Litecoin ETFs from Grayscale, Bitwise, and CoinShares, which carry a 90% approval probability, per Bloomberg analysts, could be huge catalysts.

    Experts say a SEC approval for LTC spot ETFs could drive institutional inflows of up to $500 million in Litecoin at launch, printing the trajectory that saw Bitcoin’s price rally to new highs in early 2024.

    Source link

  • Litecoin price prediction as LTC jumps 12% on bullish catalysts

    Litecoin price prediction as LTC jumps 12% on bullish catalysts

    Litecoin Price

    • Litecoin price is up 12% in 24 hours, hitting $127 as altcoins look to bounce back.
    • The LTC price could rally to $200 and target a new all-time.
    • Bullish catalysts include spot ETF anticipation, payments activity/adoption and treasury strategy moves.

    Litecoin trades as one of the top gainers in the past 24 hours, with the altcoin boasting a 12% spike as price hovers near $126. Gains see weekly uptick extended and LTC up by more than 47% in the past month.

    Amid a confluence of bullish catalysts, can Litecoin price jump to its year-to-date highs near $140 and target multi-year peaks above $200?

    Litecoin jumps 12% amid notable bullish momentum

    Litecoin’s double-digit uptick, which pushed price from lows of $111 to above $127 at the time of writing, comes as the broader crypto market seeks a fresh leg up.

    On Tuesday, Aug. 5, the total market cap was up 1% to $3.74 trillion, with this following Monday’s resilient performance across stocks and crypto. Most top altcoins including Ethereum, XRP and Solana are in the green, with latest regulatory developments adding to the prevailing crypto sentiment to suggest more gains are likely in the short term.

    For LTC, the outlook gets a further bullish impetus from a range of factors. It includes overall anticipation of a spot Litecoin exchange-traded fund (ETF) approval, increased use as a payment currency and significant institutional interest amid treasury strategy moves.

    Recently, Bloomberg analysts put a 95% probability on a spot LTC ETF approval in 2025, and regulatory developments suggest this outlook remains.

    Meanwhile, bullish projections for Litecoin are gaining traction amid institutional interest, with MEI Pharma’s $100 million Litecoin treasury strategy a major corporate allocation already. Also fueling price gains is Litecoin’s growing use in remittances and payments.

    What next for LTC price?

    Litecoin’s price gains may see profit taking kick in and derail buyers, particularly given the surge to a five month high for LTC.

    LTC chart by TradingView

    However, the altcoin has broken above a symmetrical triangle on the weekly chart, signaling potential upside continuation. This breakout above the triangle’s upper resistance means bulls may want to target the supply wall around $200.

    Notably, the Moving Average Convergence Divergence (MACD) has a bullish crossover, aiding the outlook for upward momentum. The Relative Strength Index (RSI) also ticks above 64, indicating room for more gains before hitting overbought conditions.

    If buying pressure continues, bulls may eye $200 and higher in the short term. However, if it fades, a short-term pullback to the $110–$101 support zone may ensue. This LTC price outlook nonetheless depends on overall bullish conditions.


    Source link

  • Litecoin shrimps capitulate as LTC declines

    Litecoin shrimps capitulate as LTC declines

    • Litecoin price hovers around $63 with the altcoin down over 5% in the past week and 11% over the last 30 days.
    • According to CoinGecko, LTC has fallen 84% since hitting its all-time high above $410 in May 2021.
    • The downtrend that has seen one of the earliest cryptocurrencies slide out of the top 10 by market cap now has small wallet holders selling as price nears a crucial support area.

    Market intelligence and on-chain analytics platform Santiment has highlighted a dip in Litecoin shrimp holders – wallet addresses with less than 1 LTC. These wallets have sold-off over 45,200 LTC, but analysts say this could be a “turnaround.”

    “Litecoin has not been lighting social forums on fire with its market value dropping -36% since its April 1st peak. A sudden liquidation of 45.2K net 0.1-1 LTC wallets indicate that small traders are finally capitulating out of the OG crypto asset. Small fish impatiently ‘jumping ship’ is often a turnaround sign for an asset to begin turning bullish once again,” Santiment analysts wrote on X.

    76% of Litecoin wallets in loss

    In the past few months, the selling has coincided with price dipping from above $110 in early April. After bouncing from lows of $56 following the crypto crash on August 5, Litecoin is back below $64 and near the major support zone around $60.

    Per IntoTheBlock, the In/Out of the Money indicator is largely bearish. About 76% of addresses are in loss at current price and only 18% are in profit. Notably, 22% of addresses have held LTC for less than a year and could be part of the capitulating small holders. 

    However, 78% of wallets have held the altcoin for more than a year.

    Litecoin price chart

    0n the daily chart, both the RSI and MACD indicators suggest bears might push Litecoin price lower.

    Litecoin price chart. Source: TradingView

    The price is below the 50-day SMA, which could act as the primary resistance level around $66. On the other hand, further weakness could see LTC seek the demand reload zone around $55.

    Source link

  • Litecoin (LTC) price spikes as Bitcoin hits $30k

    Litecoin (LTC) price spikes as Bitcoin hits $30k

    • Litecoin price jumped 4% to above $64 on Friday morning.
    • LTC was up as positive sentiment permeated the altcoin market amid Bitcoin’s rally to $30k.

    Litecoin (LTC) rose more than 4% early on Friday amid a positive reaction across the altcoin market to Bitcoin’s fresh spike to $30k. LTC traded to intraday highs of $64 across major exchanges, with daily trading volume hitting $370 million as buyers pushed the total crypto market cap to over $1.17 trillion.

    Why is Litecoin price up today?

    Although a bullish picture has looked increasingly possible with metrics such as Litecoin hashrate jumping to new highs, one of the likely catalysts could be the increased crowd noise on the probability of a spot Bitcoin ETF hitting the market sooner than anticipated. Recent developments involving potential ETF issuers and the US Securities and Exchange Commission (SEC) have added to the growing belief that the first spot ETF is a matter of when and not if.

    That has Bitcoin price poised for takeoff, and as quant trader Charles Edwards pointed out on X today, the flagship cryptocurrency’s positive outlook is enhanced by the several key metrics in this cycle.

    Other catalysts for LTC price today could be the regulation news related to SEC dropping charges against Ripple executives. The SEC sued Ripple CEO Brad Garlinghouse and Executive Chairman Chris Larsen when it filed a lawsuit against the San-Francisco-based company in December 2020. The agency’s charges against the two were dismissed on Thursday, with the trial scheduled for April next year now not happening.

    LTC looks to have pumped amid a similar reaction across the altcoin market. While Litecoin’s modest gains are dwarfed by the colossal returns for some of the best performing altcoins today – including Bitcoin SV – the bullish flip has analysts pointing to a potential retest of the psychological $100 level if upward momentum holds.


    Source link

  • LTC, ARB and MATIC price outlook amid US debt limit deal

    LTC, ARB and MATIC price outlook amid US debt limit deal

    • LTC bulls need to break above $93, a key hurdle below the psychological level of $100.
    • MATIC must reclaim $1 to target the $1.30-$1.50 range, or risk dip to $0.75.
    • Elsewhere, ARB is near a key resistance level as Arbitrum price jumps 3.9% amid the market’s reaction to US debt ceiling news.

    The US has reached a “tentative deal” on its debt limit crisis after a week of high uncertainty. With the news of the deal seeping through the markets, cryptocurrencies reacted slightly positively as Bitcoin and Ethereum prices rose above $27k and $1.8k respectively.

    The outlook was also visible across the top 10 altcoin market, with sentiment relief showing as Litecoin (LTC), Arbitrum (ARB), and Polygon (MATIC) moved up. Even then, markets remain largely weak as May comes to a close.

    Here is what a respected crypto analyst has predicted for LTC, ARB and MATIC.

    Litecoin price prediction: $93 key to LTC bulls

    In March, LTC creator Charlie Lee offered a huge Litecoin price prediction. Pointing to the 14th ranked cryptocurrency (by market cap today), Lee said Litecoin price could rise to 0.0125 BTC in a new bull cycle. He also believed a downside for LTC could find support at 0.0025 BTC.

    The current LTC price is above this latter level as it trades near $89.40 or 0.0032 against bitcoin. In recent weeks, analysts have pointed to Litecoin’s upcoming halving as a likely trigger for fresh upside momentum.

    According to crypto analyst Michael van de Poppe, bulls need to break above a key resistance at $93 on the higher timeframe. The psychological $100 level would then be in sight as buyers eye a halving rally, he tweeted

    Many squigglies on this chart, but higher timeframe resistance is at $93. Currently, support found at $82 and a strong bounce -> weekly candle looks good. Next week breaking through $93 and the Halving rally might start.”

    Polygon price prediction: MATIC needs to break above $1 again

    MATIC has traded lower since March, with an attempt to flip higher running into rejection in April as price fell below $1.00 (CoinJournal highlighted the subsequent price movement here). Although it remains below the dollar, bulls might have the upper hand if they reclaim control above $0.95.

    Currently, MATIC/USD is around $0.92. According to van de Poppe, MATIC has bounced well above this key area since its NFT announcement during the F1 Monaco GP. Can bulls build momentum from here?

    I really want to see it flip $0.95, then we can accelerate towards $1.30-1.50. If that’s not the case, then short is activated and longs can be taken at $0.75,” the analyst said in reply to one of the requests for altcoin analysis.

    Arbitrum price prediction: ARB is near key resistance

    Arbitrum, which was trading at $1.20 and 3.9% up in the past 24 hours at the time of writing, needs to hold above the $1.18 level to give bulls an upside boost. That could aid momentum to $1.30, van de Poppe noted.

    Again, into resistance. This means, entries are available at $1.10. If it doesn’t clearly break & flip the resistance at $1.18, I’d assume shorts are triggered when falling back sub $1.18. Otherwise, long continuation trade towards $1.30.”


    Source link

  • here’s why LTC could explode

    here’s why LTC could explode

    • Litecoin price traded above $90 on Sunday, with LTC hitting intraday highs of $91.60.
    • While price has rejected twice above $100, the area remains a key target for bulls as Bitcoin retests the $30k level.
    • If it breaks above the hurdle, fresh momentum heading into the Litecoin halving in August could catapult LTC price towards its all-time peak.

    Litecoin (LTC) is trading around the $90 level after bulls battled to regain some control following the sharp sell-off to lows of $84 this past week. The weakness in the price of LTC came after another dip in March that saw the price rejected at year-to-date highs of $106 in February.

    The decline occurred at a key horizontal resistance area at the $100 zone, which remains the main hurdle as Litecoin enters the last few months before its halving in August.

    Litecoin price: are bulls taking control?

    The LTC price rejection in the past weeks at $100 meant a double top pattern appeared, which signals bearish strength and highlights the potential for downward continuation. As it happened, LTC price broke below an ascending trendline support after hitting $103 on 18 April and a significant drop a few days later had LTC/USD hugging lows of $84.

    But despite the previous gains being wiped out by the decline, LTC is currently trying to maintain the $90 area after a critical daily close above it.  Bulls will need to confirm they are getting in control by pushing higher even as a potential rising channel appears on the daily chart.

    A look at the Relative Strength Index (RSI) shows the momentum indicator is just below the 50 line. However, the indicator is looking to cross above the signal line to suggest further possible accumulation of the altcoin.

    Litecoin price LTC/USD daily chart outlook. Source: TradingView


    Litecoin price prediction ahead of halving

    With approximately 100 days left before halving, the Litecoin price prediction for 2023 is bullish. The network has continued to see greater miner confidence, with the total hashrate for the blockchain recently hitting 760 terahashes per second(TH/s).

    If the expected halving rally kicks in amid a broader market uptick, the two main targets above $100 will lie around $180 and then $300. The all-time high for LTC is around $410 reached in May 2021.

    On the flipside, a bearish reversal could see the long term resistance-turned support area of $65 come into play. Below that, the main buffer for Litecoin price remains the multi-year base around $40.


    Source link