Tag: Market

  • China will lead crypto’s next bull market

    China will lead crypto’s next bull market

    • Arthur Hayes says the crypto autumn rally will be catalysed by Chinese traders.
    • According to the BitMEX co-founder, a weakening of the yuan amid massive credit issuance will drive capital into crypto markets.
    • He notes that “Hong Kong will be the conduit through which Chinese capital is allowed to own crypto.”

    Arthur Hayes, the co-founder and former CEO of crypto exchange BitMEX, believes the next crypto market rally will be shaped by the Chinese trader.

    In an opinion laid out in his latest blog post, Hayes highlights that the US Securities and Exchange Commission (SEC)’s current crackdown on crypto might be a negative trigger. The crypto market is likely to freak out and crater even further due to this.

    However, according to the entrepreneur, it is not the US but China that could hold the baton as crypto heads into the next bull market. And the one catalyst to watch out for would be the “return of the Chinese trader” amid the weakening of the Chinese yuan.

    The return of the Chinese crypto trader through the financial pipes of Hong Kong will reignite the market at the same time the broke-ass American mass affluent are effectively shut out,” Hayes wrote in the blog post published June 16.

    Hayes explains how China leads the next bull rally

    The current market setup is much like the summer of  2015, that “nuclear bear market” whose catalyst was the implosion of Mt. Gox

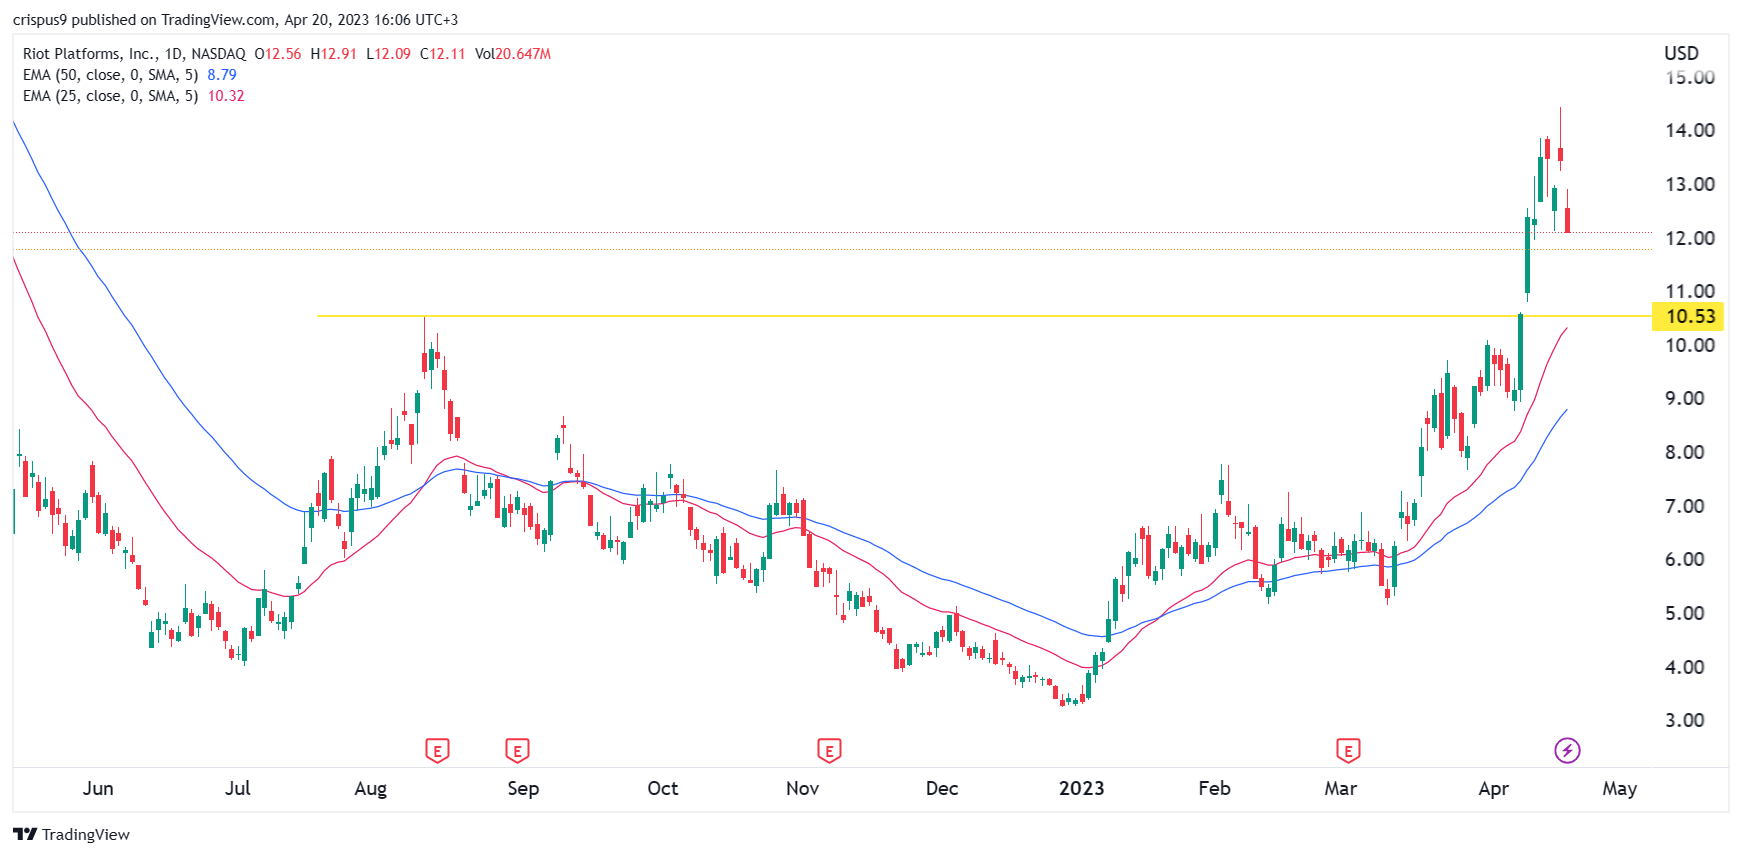
    Just as then, the 2022 bear market that included the implosion of FTX has volatility and trading volumes dried up and the sideways price action excruciatingly boring. Indeed, compared to 2015 when Bitcoin price traded near $200 for a long time, 2023 is seeing this with prices ranged below $30k since the breakdown in November 2022.
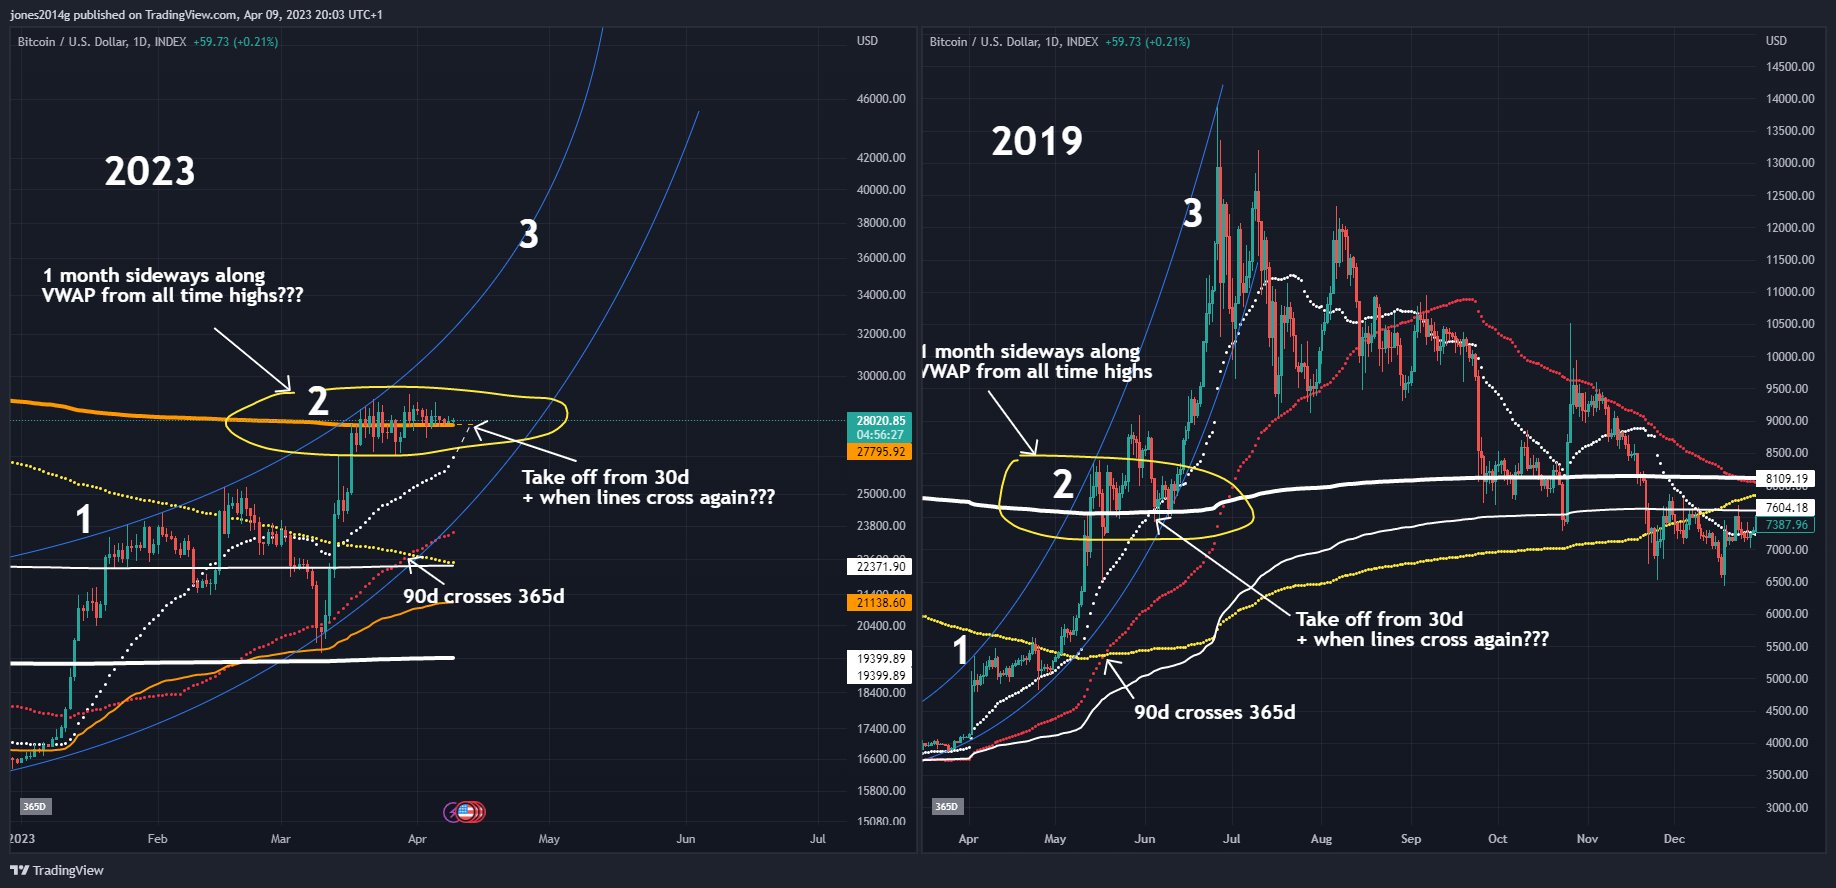
    But in August of 2015, the PBOC suddenly sparked a rally in China’s interest for Bitcoin with a “shock” devaluation vs. the USD. From August to November of 2015, the price of Bitcoin tripled, with Chinese traders driving the market higher. I believe something similar could happen in 2023,” Hayes noted.

    According to the BitMEX co-founder, the above is an outlook he sees materializing as the world’s second-largest economy embarks on an insane credit issuance spree. On why selling now amid concerns around the US regulatory environment “is misplaced.” Why?

    At some point, the selling will stop, and then we get the dreaded sideways. The boring sideways price action will reign until something jump starts the degen spirits of crypto traders.”

    That trigger, he says, will be a slowdown in China’s economy and the subsequent money printing spree that will weaken the yuan and see massive inflows into crypto. He explained:

    The less the Chinese economy grows, the more credit will be issued. Then the currency will weaken, capital will be allowed to “flee” into appropriate vehicles, and finally, the crypto capital markets will be provided with the spark to hopefully start the autumn rally.”

    To weaken the currency, Hayes says the Peoples Bank of China (PBOC) will look to encourage credit growth sectors of the economy deemed “good.” These areas include semiconductors, artificial intelligence (AI), clean energy, and property. The central bank will allow these “good” sectors to access higher loan quotes, with banks “instructed to lend a certain amount of yuan to these sectors.”

    The weakening of the yuan, and the focused approach to attracting crypto and blockchain in Hong Kong are going to be key factors, he added. It is a trajectory that best suits HODLers. The crypto bull summed up his market outlook:

    I have predicted before and continue to believe that Hong Kong will be the conduit through which Chinese capital is allowed to own crypto financial assets.” 

    Source link

  • Why is the crypto market up today? Imminent debt ceiling vote boosts the market

    Why is the crypto market up today? Imminent debt ceiling vote boosts the market

    Key takeaways

    • The cryptocurrency market is up by more than 2% today after underperforming for the best part of May.

    • Bitcoin topped the $28k mark for the first time this month.

    • The rally comes as President Biden and the House leadership reached an agreement on the debt ceiling.

    Crypto Market Cap Reaches $1.16 Trillion

    The cryptocurrency market performed well over the weekend, with most coins and tokens trading in the green zone.

    For the first time this month, the total cryptocurrency market cap reached the $1.16 trillion threshold for the first time this month. 

    The rally comes following an agreement between President Biden and the House leadership on United States’ debt ceiling. President Biden and congressional Republican Kevin McCarthy reached an agreement to suspend the federal government’s $31.4 trillion debt ceiling over the weekend. 

    However, the deal still has to pass through Congress later this week. The vote is expected to take place on Wednesday before the United States runs out of money to pay its debts in early June.

    The deal sparked optimism amongst investors that the United States would not default on its debt. If the US default on its debt, a recession would likely follow, and this could see the financial markets experience massive losses. 

    Bitcoin Rallies To $28k 

    Bitcoin, the world’s leading cryptocurrency by market cap, touched the $28k level for the first time in three weeks. Bitcoin started May trading above $29k per coin but plunged to a low of $26,008 last week. At press time, the price of Bitcoin stands at $27,953 per coin. 

    The leading cryptocurrency is now slowly recovering, thanks to the positive news from the United States. 

    Ether, the second-largest cryptocurrency in the world, also moved past the $1,900 level for the first time in weeks, adding more than 3% to its value in the last 24 hours. At press time, the price of Ether stands at $1,904. 

    Source link

  • No, Bitcoin has never seen a bear market before: Be careful

    No, Bitcoin has never seen a bear market before: Be careful

    Key Takeaways

    • Bitcoin has been through many bear markets before, always surging back to higher highs
    • Dan Ashmore, our Head of Research, cautions against naive extrapolation of past returns, however
    • Until this past year, stock markets had done nothing but rise during Bitcoin’s existence
    • Bitcoin was launched in 2009 as the stock markets bottomed, and the bull run afterward was one of the longest in history
    • This needs to be considered, cautions Ashmore, whilst sample size of Bitcoin trading with any sort of liquidity is also small

    Bitcoin is volatile. Also true: water is wet and the sky is blue. 

    A quick glance at a Bitcoin chart will tell you all you need to know about the meteoric rises and bone crushing pullbacks that the asset has produced over the years. In truth, it should be plotted on a scale, too. 

    When looking at Bitcoin markets, therefore, it is tempting to jump to the conclusion that “we have been here before”. Bull markets and bear markets, easy come and easy go. Or, as Jeff Bridges put it so poetically in the Big Lebowski, “strikes and gutters, ups and downs”. 

    While Bitcoin has drawn down many times before and, at least previously, always bounced back, I believe it is naive to extrapolate past resurgences into the present. Because no, we have not been here before. 

    To be clear, I am not saying Bitcoin will not rise to new heights again. It easily could (I hold Bitcoin as part of my portfolio, albeit via a monitored allocation and obeying the boring all adages of diversification and risk management, but hey – that is for another time). My point, however, is that we have zero point of reference for the current situation. Despite a surge of 75% in the last six months, Bitcoin is 60% off its high in Q4 of 2021, with many investors underwater if they opened positions in the past three years as Bitcoin truly established itself on the mainstream stage.  

    Let me explain why things are different this time around, and why assuming with blind confidence that Bitcoin will surge upward imminently may be misguided. First, the below are the biggest peak-to-trough drawdowns in Bitcoin history (the recent/current one is highlighted in yellow): 

    Clearly, Bitcoin has been here before. Right? 

    Well, no it hasn’t. Look at the dates of the above: all these drawdowns are from 2012 onwards. This is because Bitcoin was only launched in 2009. Indeed, it didn’t really have any sort of liquidity or infrastructure (such as exchanges or a marketplace) until 2012 (and even then, liquidity was extremely thin). 

    And consider what has happened in the wider economy since Bitcoin was launched in 2009. On March 9th 2009, two months after Bitcoin launched, the Nasdaq hit a low of 1268. The S&P 500 did the same, hitting a nadir of 676. 

    Since then, markets have enjoyed one of the most remarkable, longest and explosive bull runs in recent history, as basement-level interest rates propelled asset prices to dizzying all-time highs. By late 2021 at their peaks, the Nasdaq hit a level of 16,057, the S&P 500 4,793. Since those aforementioned lows in March 2009, that represents returns of 12.7X and 7.1X respectively. A historic period of gains.

    Presenting the returns of both the Nasdaq and S&P 500 since Bitcoin was launched in January 2009 (note – this goes back a couple of months before the trough of the stock market in March of that year and hence the returns are not as empathic as above) shows the run in markets visually throughout Bitcoin’s life:

    Or perhaps the next chart is better, showing quite how boisterous the stock market throughout Bitcoin’s life during the period up to and including 2021. 

    Therefore, every single dip in Bitcoin’s history took place whilst the wider financial markets were humming along swimmingly. This all changed in 2022, of course, when inflation spiralled and the world’s central banks began hiking rates at the fastest rate in recent memory. 

    Suddenly, for the first time in Bitcoin’s existence, it was ticking along block-by-block while financial markets elsewhere were falling. And they were falling quickly, the S&P 500 shedding nearly 20% in 2022, the Nasdaq losing over a third of its value. Not only were these losses the worst of any period in Bitcoin’s life, they were, aside from minor falls in 2011 and 2018, the only losses it had ever seen. 

    Therefore, this time is different. Blind faith in Bitcoin bouncing back aggressively because of the simple conclusion that it has done so before is a dangerous assumption to make. Again, Bitcoin could easily do exactly this, but it would be foolish to assume it is a guarantee because it has happened in the past. 

    The reality is that, until this past year, the world had no idea how Bitcoin would trade outside of the zero-interest rate vacuum that we have been operating in for the past decade. There is no trade history for Bitcoin going back to previous recessions, no chart one can pull up to assess how it weathered inflation in the 1970s, no reference point to anything but a stock market printing green candle after green candle. 

    Not only did all those previous resurgences come amid a period of cheap money and expanding central bank balance sheets, but Bitcoin markets were also incredibly illiquid. It took barely a drop of capital to move prices, as Bitcoin exploded from a fraction of a cent to thousands of dollars per coin. Bitcoin’s existence has been brief itself, at 14 years, but its status as a financial asset of any sort of liquidity is even briefer again. 

    So, for one last time: this is not a piece making any forecasts about the future of Bitcoin. I don’t want to wade into such murky waters (not here, anyway!). Rather, it is a piece cautioning that we have such a small sample size to work with when it comes to Bitcoin, and it is important to be cognisant of that when assessing how it trades. 

    Bitcoin has never experienced a bear market in the wider economy before. Until now. Overlooking that critical fact is a dangerous game to play.

    Source link

  • active addresses fall, market makers scale back, price softens

    active addresses fall, market makers scale back, price softens

    Key Takeaways

    • Number of addresses containing one Bitcoin or more crosses one million
    • Bitcoin relatively subdued despite trading at 2-month low
    • Two prominent market markers are scaling back activity in the space
    • Active addresses show notable decline in last week


    We wrote last week that nearly one million addresses on the Bitcoin network now contain at least one Bitcoin. That mark has now been passed, as the below chart shows. 

    As dramatic as that sounds, it doesn’t equate to one million people, as aggregate wallets exist (such as exchange wallets), not to mention the fact that one person often has more than one address. 

    Looking beyond this quirky threshold, there has not been too much of note occurring in the markets in recent weeks. The market has been somewhat soft, Bitcoin trading at $27,300 as I write this, a two-month low. It is down 7% over the past ten days, but that is not exactly a dramatic decline by Bitcoin’s standards. 

    Looking at activity on the network does show more notable developments, however. The below chart shows a perceptible break downwards when analysing the 7-day exponential moving average (EMA) of active addresses on the network.

    It is the biggest decline in activity over the last year. It is not immediately obvious what is causing it, but with the 7-day EMA running roughly between 800,000 and 1,000,000 addresses, the fall towards 600,000 does stand out. 

    Regarding possible catalysts, there has not been much beyond the continued big story of the year: the regulatory crackdown from the US. Coinbase CEO Brian Armstrong said the exchange would consider the UAE as an international hub, as the company reels from the punitive measures levelled against the industry in recent times – including a Wells notice served to Coinbase in March. 

    Congressman Brad Sherman was the latest lawmaker to slam the industry, making some startling comparisons that haven’t exactly gone down well in the industry:

    “Peru is way ahead of us (the US) in cocaine production. China is way ahead of us in organ harvesting. We don’t need to keep up on those things and we don’t need to keep up on crypto”. 

    Regardless of whether you agree or not, the industry is feeling the pinch of this hostile stance in the US. Last week, two prominent crypto market makers, Jane Street and Jump Crypto, announced they were scaling back their market making activity.

    This amounts to a blow to markets that are already very thin. Indeed, we have written multiple times what role the thin liquidy has played in Bitcoin’s run-up this year. In April, crypto profits, prices all hit their highest marks since June 2022. But so did volatility, as there has been a dearth of capital in the space ever since Alameda, one of the largest market makers, evaporated amid the FTX crash in November. And that liquidity is only going to get thinner again with the news out of Jane Street and Jump Crypto. 

    With thin liquidity comes high volatility, as it takes less capital to move prices. The below chart shows that volatility has fallen off since March, but is still trading above 40% on an annualised basis and up markedly since the start of the year. 

    While Bitcoin’s price fall from close to $30,000 to where it currently sits at $27,200 is nothing to write home about, the shallow nature of the markets hint that more volatility could be on the way. 


    Source link

  • Why is the crypto market down today? BTC briefly slips below $27k

    Why is the crypto market down today? BTC briefly slips below $27k

    Key takeaways

    • The cryptocurrency market is down by roughly 1% over the past 24 hours.

    • Bitcoin briefly dropped to $26,990 earlier today before recovering to now trade above $27,500.

    • The dump came due to reports that there was a transaction with the United States government’s BTC wallet.

    Why the crypto market is down today

    The cryptocurrency market recorded a sharp spike in movement a few hours ago. Bitcoin, the world’s leading cryptocurrency by market cap, was trading just above $28k earlier today.

    However, BTC fell below the $27k level for the first time in more than a week, briefly touching the $26,990 mark before retracing its movement.

    According to market experts, the sharp decline in Bitcoin’s price came as a result of a transaction from the United States government’s BTC wallet. 

    Data obtained from Blockstream showed that 9819.01814463 bitcoins were on the move from the wallet. This large transaction was reflected in the market, with Bitcoin dropping below the $27k mark for the first time in a month. 

    Bitcoin recovers to trade above $27,500

    The dump didn’t last long, as Bitcoin is now trading above the $27k level once again. At press time, the price of Bitcoin stands at $27,502, down by more than 2% in the last hour.

    Bitcoin is not the only cryptocurrency that recorded losses. Ether, the second-largest cryptocurrency by market cap, also dropped below the $1,800 mark earlier today before retracing to now trade at $18,36 per coin.


    Source link

  • Why the crypto market is down today

    Why the crypto market is down today

    • The crypto market cap was down 3.2% in the past 24 hours to $1.2 trillion as Binance halted BTC withdrawals.
    • The exchange’s action followed massive network congestion for Bitcoin amid increase in fees as tokens with inscriptions and ordinals pumped.
    • Meanwhile, Bitcoin (BTC) saw its market cap drop to $540 billion for a 45% market dominance.

    The total cryptocurrency market cap is down 3.2% to $1.2 trillion in the past 24 hours as of writing. The top two digital assets by market capitalization Bitcoin (BTC) and Ethereum (ETH) are both down more than 3% in the same period and -5.4% and -2.2% respectively over the past seven days.

    As a result, BTC price is below $28,000 while Ether is trading near $1,850 amid broader selling pressure for crypto.

    While most big cap tokens are down about 3 to 6%, Pepe (PEPE) and Sui (SUI) are the biggest losers in the top 100 coins with about -12% performance in the past 24 hours.

    Why crypto market is down today – look at Bitcoin

    The traditional markets continue to see some negativity as traders place new bets on regional banks plummeting again following last week’s bounce. The outlook isn’t the same for crypto and Bitcoin indeed rallied as multiple US bank stocks dumped.

    But why is the crypto market cap down? Notably, crypto remains volatile and BTC is finding it difficult to break higher following the rejections near $30,000. However, panic selling could be behind this latest down leg, particularly with such data as the one showing enormous BTC outflows from the Binance exchange. 

    Binance addressed the “outflows” funds movement between its hot and cold wallets amid the adjustments in BTC address. This comes after the exchange suspending Bitcoin transactions as the flagship network experienced massive congestion. It’s a scenario that saw transaction fees spike significantly.

    For instance, on Sunday, transaction fees in BTC block 788695 was 6.7 BTC, higher than the block subsidy of 6.25 BTC. On-chain data shows Bitcoin experienced a spike in blockspace demand, pushing transactions fees higher.

    According to on-chain analytics platform Glassnode, the high demand for blockspace is being driven by BRC-20 tokens. The tokens that use inscriptions and ordinals have been up as shown by the 9% gains for Stacks (STX) amid BTC price decline.

    As such, the Bitcoin market cap is down to $540 billion today, representing about 45% of market dominance. Ethereum‘s market dominance currently stands around 18.6%

    Bitcoin price prediction

    The announcement that Binance had suspended BTC withdrawals – on two occasions – looks to have spooked a few traders into action. But the crypto market cap could recoup some of the losses ahead of a crucial week with economic news. Binance is also reportedly eyeing Bitcoin Lightning Network transactions.

    Crypto analyst Michael van de Poppe highlights Bitcoin price levels at $27.4k or even $26.8k could provide the bounce area.

    Mentioned before that $29.2K was the key level to break for #Bitcoin. We did have a bounce towards it, but no break. Additionally some FUD regarding #Binance doesn’t help. Looking at $27.4K or $26.8K for potential longs towards the CME gap at $29.6K,” the analyst tweeted on Monday morning.


    Source link

  • Riot Platforms stock has moved to a bear market: buy the dip?

    Riot Platforms stock has moved to a bear market: buy the dip?

    Riot Platforms (NASDAQ: RIOT) stock price has drifted downwards in the past few days as Bitcoin and other cryptocurrencies retreated. The shares retreated to a low of $11.48 in the pre-market session. This means that the stock has dropped by more than 20% from the year-to-date high, meaning that it has moved to a bear market.

    Is it safe to buy the dip?

    Riot Blockchain is one of the biggest Bitcoin mining companies in the world. It competes with the likes of Argo Blockchain and Marathon Digital among others. Therefore, as in the other mining industry, these companies have a close correlation with the price of the underlying asset.

    This explains why the Riot Platforms stock price has jumped sharply this year. Between the lowest point in 2022 and the year-to-date high, RIOT shares were up by more than 338%, making it one of the best-performing stocks in the market.

    Therefore, to predict whether the Riot Blockchain stock price will bounce back, we need to understand why Bitcoin is falling and whether it will bounce back soon. As I wrote in this articlethe main reason for the crash is that bullish liquidations have jumped in the past two days.

    Liquidations happen when brokers and exchanges forcefully close positions of leveraged positions. Therefore, this usually puts prices under pressure.

    Another reason why this happened is that Bitcoin recently rose above the key resistance level at $30,000. Historically, cryptocurrencies tend to be a bit volatile when they move above or below a key support or resistance level. 

    The other reason is that several regional banks, including Western Alliance Bancorp, published strong results. Its inflows rose by more than $3 billion. As such, the risks of a banking crisis seens like they have been minimized. In a note, analysts at Bernstein said:

    “Any potential dislocation, whether on the bank’s credit side, or on the sovereign side …positions bitcoin perfectly as a safe-haven asset alongside gold.”

    Therefore, there is a likelihood that Bitcoin price will bounce back in the coming months as the Fed starts to pivot.

    Riot Platforms stock price forecast

    The daily chart shows that the RIOT share price formed a shooting star pattern on Wednesday. In technical analysis, this pattern is usually a bearish sign. The stock has jumped by more than 25-day and 50-day exponential moving averages. 

    It remains slightly above the key support level at $10.53, the highest level on 11th August. Therefore, I suspect that the shares will drop to the key support at $10.53. The stock will then resume the bullish trend as buyers target the year-to-date high of $14.51.

    How to buy Bitcoin

    eToro

    eToro offers a wide range of cryptos, such as Bitcoin, XRP and others, alongside crypto/fiat and crypto/crypto pairs. eToro users can connect with, learn from, and copy or get copied by other users.


    Buy BTC with eToro today

    Public

    Public is an investing platform that allows you to invest stocks, ETFs, crypto, and alternative assets like fine art and collectibles—all in one place.


    Buy BTC with Public today

    Source link

  • Analyst says CPI could be big market mover

    Analyst says CPI could be big market mover

    • Bitcoin price hovers above $28k with a ranged trading over the past month.
    • Analyst Michael van de Poppe says the US consumer price index report out this week could be a big market mover.
    • Bitcoin’s volume weighted average price (VWAP) is a metric to also watch.

    Bitcoin price continued its ranged trading this past weekend, with bulls retesting the $28,500 area. As the week starts, the top cryptocurrency could see an injection of volatility.

    Indeed, crypto analyst Rekt Capital says bitcoin remains “well positioned for mid- to long-term upside”, particularly as the cryptocurrency moves towards its next halving event. 

    But what about the next few days? Below is what analysts say about Bitcoin price this week.

    Bitcoin price prediction ahead of CPI data this week

    According to crypto analyst Michael van de Poppe, BTC is still in consolidation – which has stretched from around mid-March. But with big economic news on the cards this week, the market could be in for a bit of movement.

    In a comment on Bitcoin price he shared on Monday, van de Poppe said the upcoming Consumer Price Index (CPI) data expected on 12 April is a “big event this week.” 

    If buyers manage to retest the $28,600 level, its likely BTC will break higher.

    Bitcoin is still stuck in the range. Good move overnight to $28,500 and back to consolidation. Big event this week with CPI, probably the market mover. If another test of $28,600 takes place, I’m assuming we’ll be breaking out upwards,” the analyst noted.

    Here is the analyst’s Bitcoin price chart.

    Trading volume metric and BTC price outlook

    Pseudonymous analyst bitcoindata21 also says the CPI news this week will likely be a major market catalyst. However, he also highlights Bitcoin’s Volume Weighted Average Price (VWAP), which he says currently sits on the benchmark cryptocurrency’s all-time highs.

    VWAP takes into account the average price of a trading asset as weighted by its total trading volume. 

    The metric helps analyse and forecast price movement based on the average value over a given period. In this case, bitcoindata21 highlights the 30-day VWAP on 15 April, with a potential upward crossing on 13 April.

    The chart below bitcoindata21 shared on Twitter shows a comparison of the 2019 and 2023 price movements.

    Bitcoin price VWAP historical data outlook comparing 2019 and 2023. Source: bitcoindata21 on Twitter.


    The 1-month sideways trading along the VWAP is similarly positioned as was in 2019 before BTC went on to hit a new all-time in the last bull market.


    Source link

  • Least amount of Bitcoin on exchanges since the previous bull market top in December 2017

    Least amount of Bitcoin on exchanges since the previous bull market top in December 2017

    Key Takeaways

    • The balance of Bitcoins on exchanges is in constant decline, now at the lowest point since December 2017 
    • Meanwhile, long-term investors continue to hold, soaking up the supply
    • Coins that have not been touched in 10 years now outnumber those held on exchanges 

    I wrote a piece last week on the exodus of stablecoins from exchanges, with the balance currently the lowest since October 2021, with 45% of the total balance of stablecoins on exchanges flowing out in the last four months. 

    But the glut in liquidity is not limited to stablecoins. The world’s biggest cryptocurrency is also seeing funds flow out. Only 11.8% of the total Bitcoin supply is currently on exchanges – that is the lowest since December 2017. 

    To jot your memory, December 2017 was the previous bull market peak. Bitcoin rose to within a hair of $20,000 before freefalling into a two-year-long bear market which ravaged the entire industry.

    Since January 2020, exchanges’ reserves of Bitcoin have been only going one way: down. It hints at the demand/supply imbalance that so many Bitcoin truthers advocate for, with the much-vaunted hard supply cap of 21 million coins for Bitcoin. 

    If demand keeps rising, they argue, the price can only go up because supply cannot keep up. 

    Central to this thesis is the resilience of long-term holders to keep a firm grasp on their bitcoins. And when assessing whether they have, the answer is a resounding yes. 

    The below chart presents long-term holders against the total exchange balance. In November 2022, the number of bitcoins last active 10+ years ago overtook the number of bitcoins on exchanges. 

    Of course, some of these long-term holders will be lost coins, either via their owner dying or losing their private keys. 

    But the stat is still interesting and speaks to the cohort of (very) early investors in Bitcoin who remain clinging to their coins with all their might. Remember, this includes the anonymous Satoshi Nakamoto, who is estimated to hold over 1 million coins, or 5% of the total supply. 

    Below is the chart displaying the current portion of the Bitcoin supply split out by time held and compared to the exchange balance. 

    The result is interesting, but even more so when considering that the last three years brought both the euphoric highs of Bitcoin at nearly $70,000 during the pandemic and then the bone-crushing fall through 2022, which saw it careen down towards $15,000. 

    In terms of the long-term trajectory of Bitcoin, it’s undoubtedly bullish. Of course, it all depends on whether the demand for additional Bitcoin will hold up. The supply may be getting squeezed, but that is all for nothing if the demand side doesn’t hold up its end of the bargain. 

    And on that note, the last year has been a big blow. Not only has capital flowed out of the space at an alarming rate, but a number of very high-profile scandals (LUNA, Celsius, FTX and so on) have rocked the space. The fear is that these episodes have dented the reputation of the cryptocurrency space and will inhibit the demand for Bitcoin on the intuitional side. Have people been put off moving into the space?

    It’s hard to say. But in looking at long-term holders, their confidence seems resolute. 

    Source link