Tag: momentum

  • FUSE token regains momentum after SEC issues no-action letter to the Solana DePIN project

    FUSE token regains momentum after SEC issues no-action letter to the Solana DePIN project

    SEC issues no-action letter to FUSE token

    • SEC clears FUSE token as a non-security, providing regulatory clarity.
    • FUSE token rewards network participation and green energy actions, not profits.
    • Market shows renewed momentum, boosting FUSE token price outlook.

    The US Securities and Exchange Commission (SEC) issued a no-action letter to Fuse, a Solana-based decentralised physical infrastructure network (DePIN) project, providing the token with rare regulatory clarity.

    This development has sparked optimism on the FUSE token’s potential, highlighting its utility-driven design and positioning it as a notable example of how blockchain projects can navigate US securities regulations.

    SEC clears Fuse

    Fuse Crypto submitted a formal request to the SEC’s Division of Corporation Finance on November 19, seeking confirmation that it could continue offering its FUSE token without triggering enforcement action.

    In its response, the SEC confirmed it would not recommend enforcement, based on the specific facts and circumstances described by Fuse.

    This no-action letter, while conditional, marks a significant milestone for the project, as such regulatory guidance is rare in the crypto space.

    Notably, the SEC decision signals a shift under Paul Atkins’ leadership toward a more practical and balanced approach to token oversight, contrasting with the more stringent policies of previous administrations.

    Unlike speculative tokens, the FUSE token is designed for participation and network utility.

    It functions as a reward for users maintaining Fuse’s distributed infrastructure rather than as an investment vehicle.

    Holders earn tokens through active engagement, such as contributing to the network’s Solana-based operations, installing solar panels, or using electric vehicle chargers.

    By linking token rewards to tangible, energy-focused activities, Fuse has structured FUSE as a consumptive asset that aligns with regulatory expectations, reducing the risk of it being classified as a security under US law.

    Utility-driven token model

    The SEC highlighted that FUSE token holders do not expect profits from Fuse’s managerial efforts, and the token does not grant ownership, dividends, or voting rights.

    This utility-driven framework allows participants to redeem tokens for benefits such as energy bill discounts, priority access to home electrification upgrades, or carbon-offset programs.

    By emphasising real-world use cases and sustainable energy participation, Fuse has created a model where blockchain technology directly incentivises environmentally conscious behaviour.

    The token’s scalability ensures it can grow alongside the project’s broader green energy initiatives, reinforcing its role as a functional, consumptive asset rather than a speculative instrument.

    The approval has resonated across the DePIN sector, a space valued at over $24 billion, as it provides a blueprint for other infrastructure-driven blockchain projects.

    Fuse’s approach demonstrates how decentralised networks can effectively integrate tokenised rewards with practical utility, offering both financial and environmental value to participants.

    Market impact and FUSE token price outlook

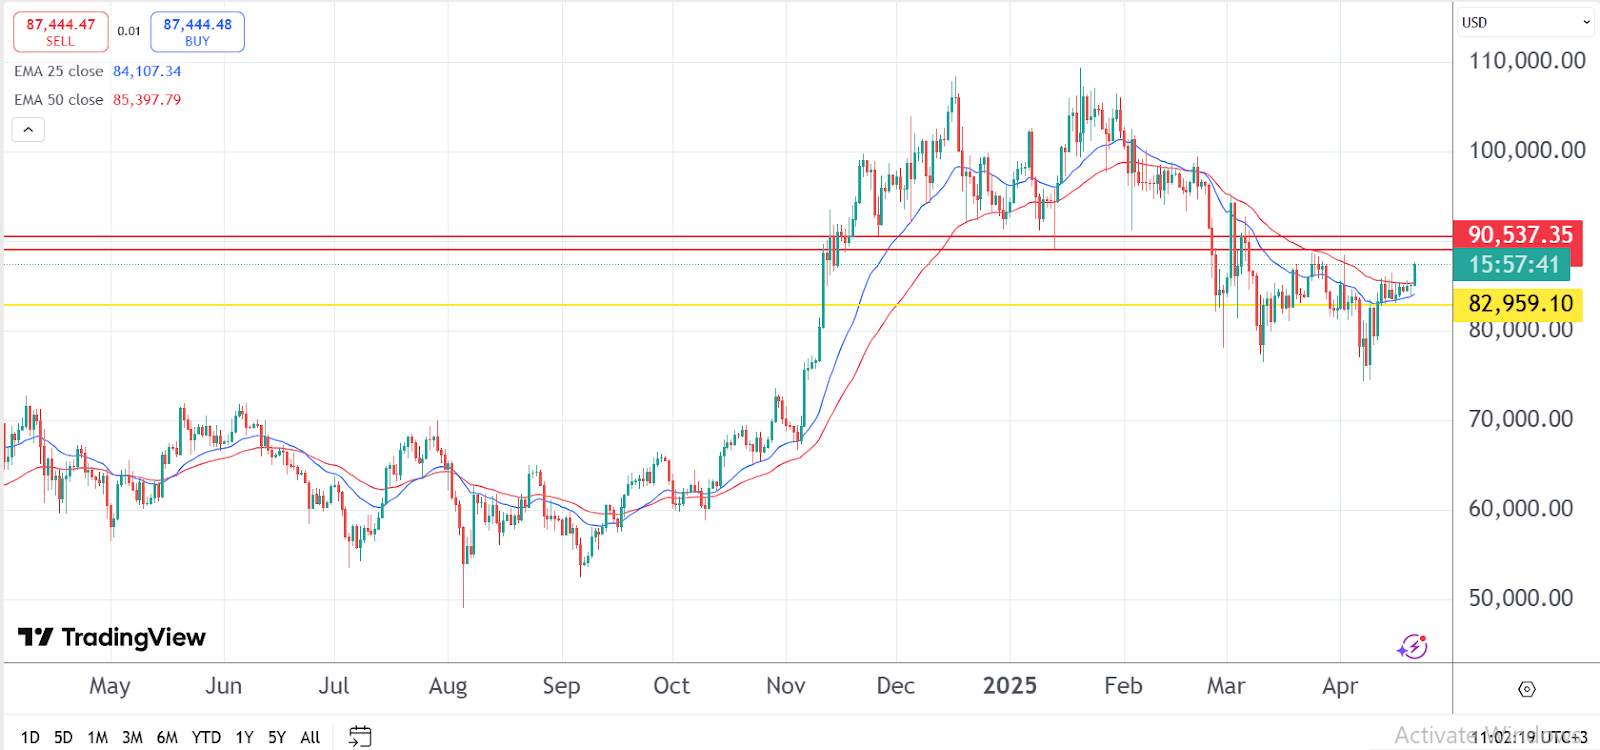
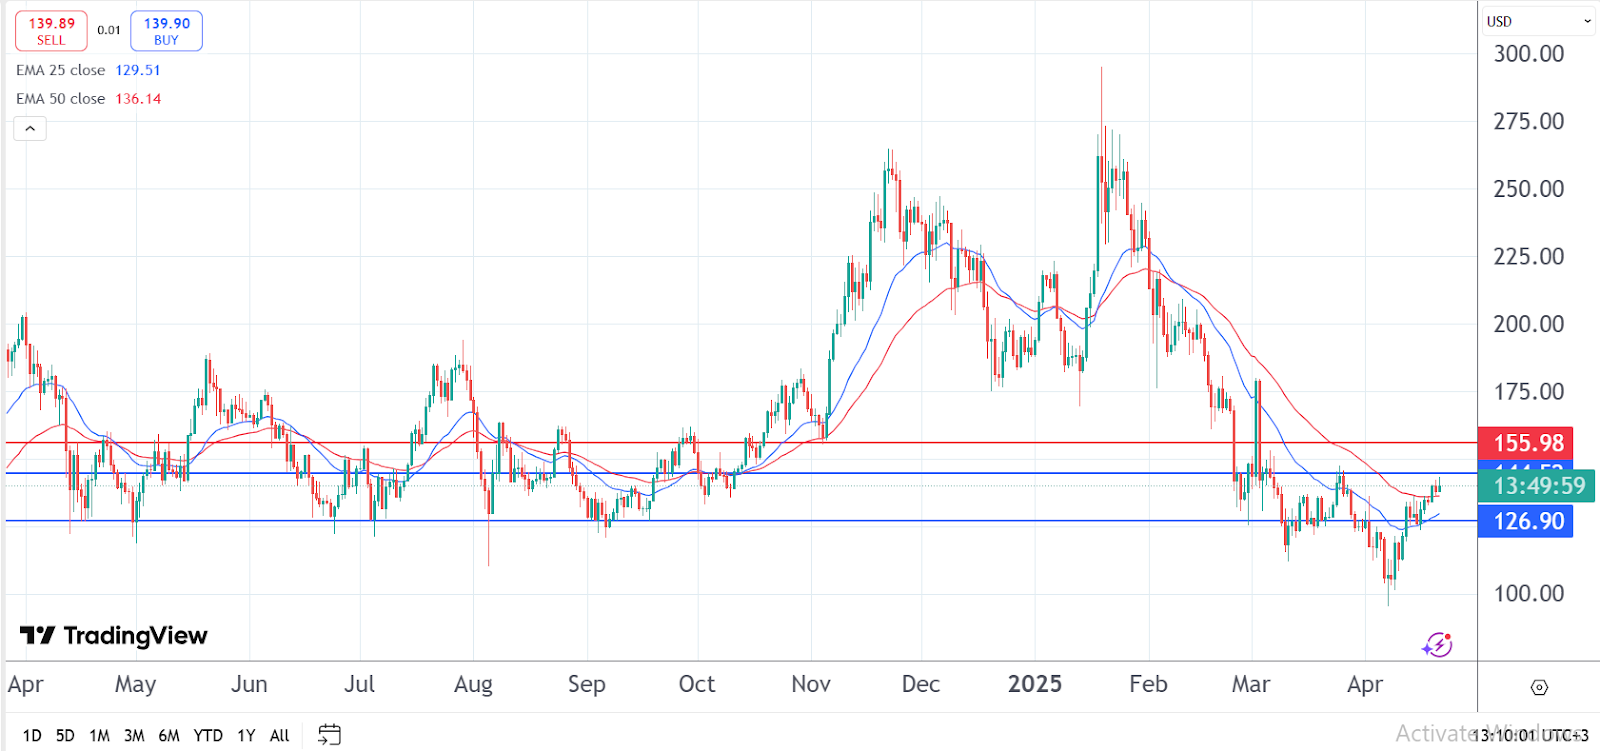
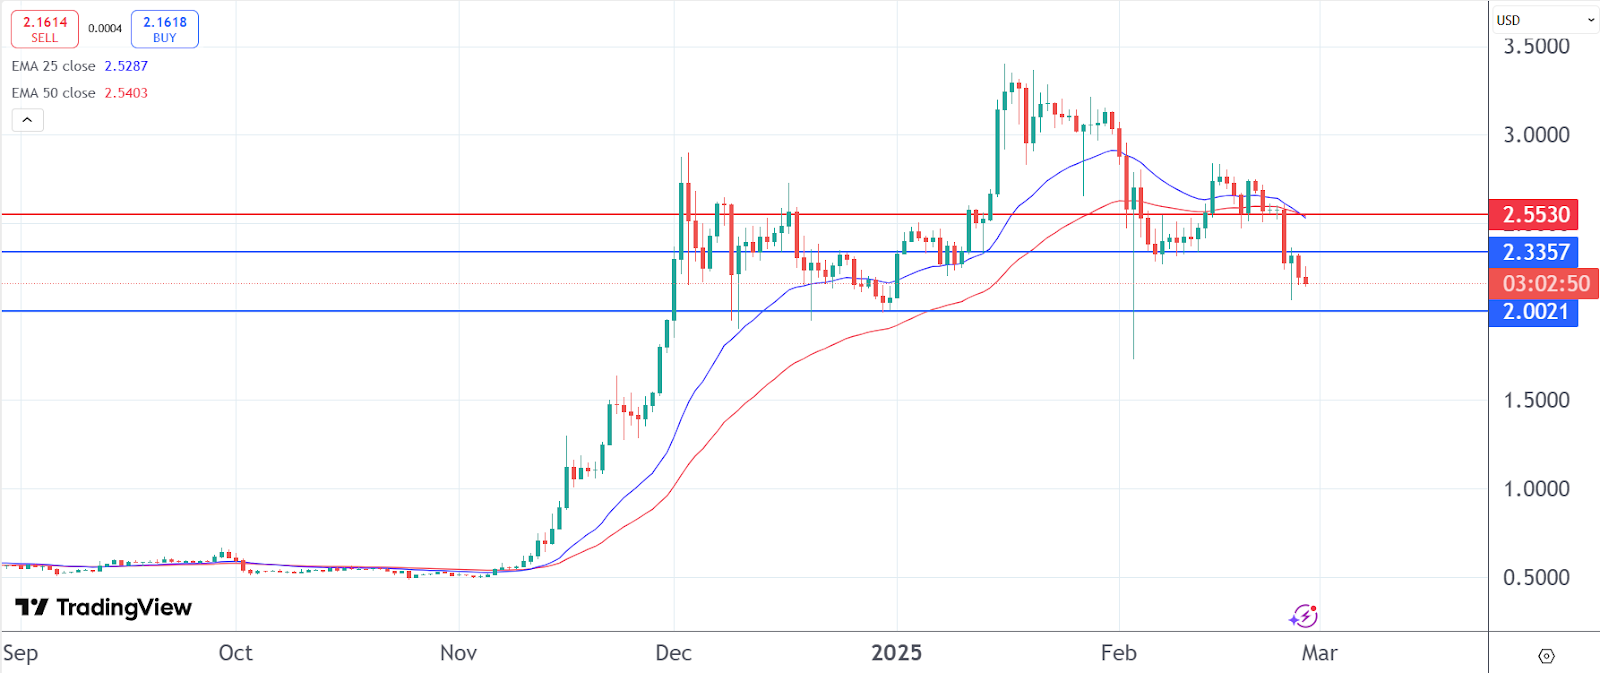
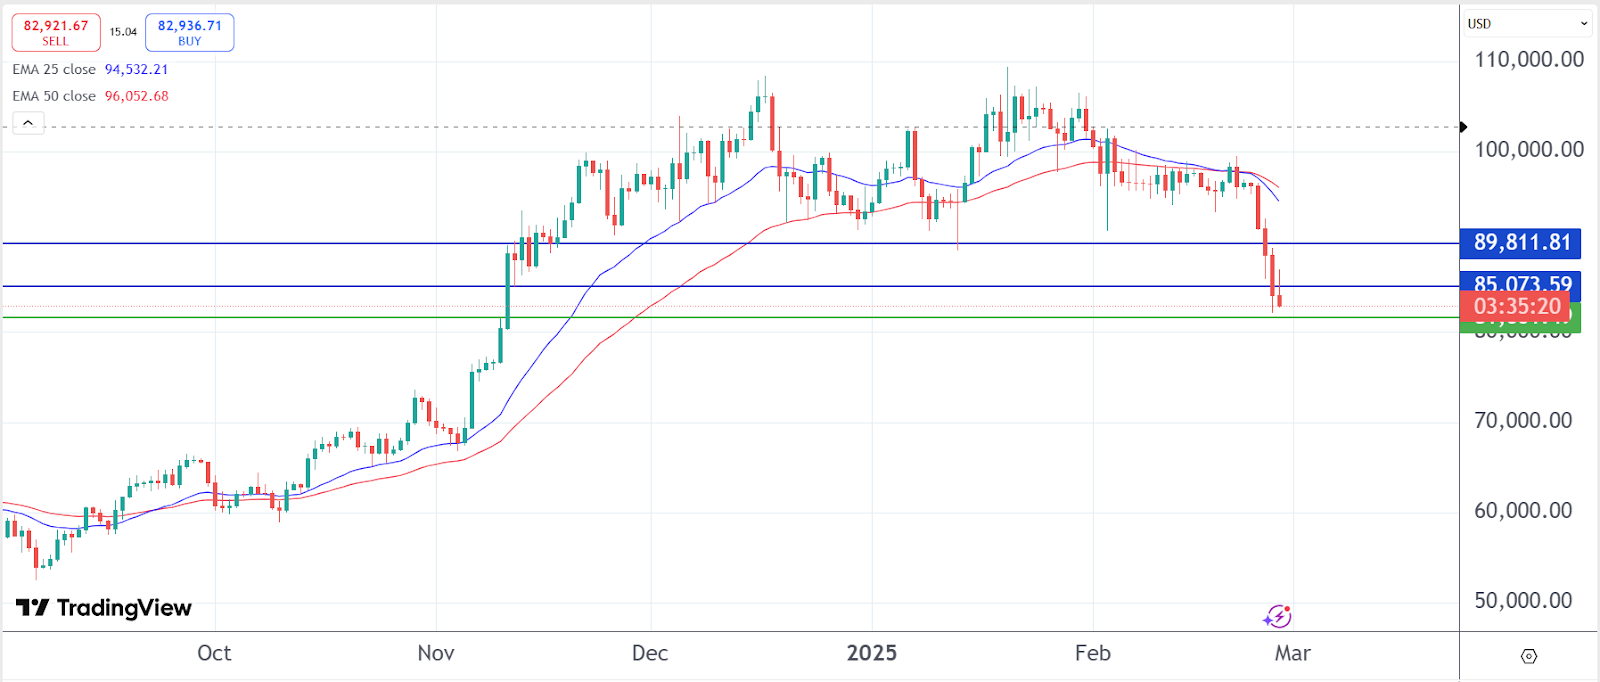
    Following the announcement, the FUSE token has shown signs of regaining momentum in trading markets.

    Current figures indicate that the token trades around $0.0077, with a market capitalisation of approximately $2.4 million and total value locked exceeding $68 million.

    Over the past year, the token experienced a significant decline from its all-time high of $2.13 in January 2022, but the SEC’s no-action letter has injected renewed confidence among investors.

    Looking ahead, Fuse’s strengthened regulatory position, combined with its utility-oriented model, could positively influence the FUSE token price outlook over the medium term.

    Source link

  • UNI soars 12% as Uniswap v4’s $200B milestone fuels bullish momentum

    UNI soars 12% as Uniswap v4’s $200B milestone fuels bullish momentum

    UNI soars 12% as Uniswap v4’s $200B milestone fuels bullish momentum

    • Uniswap v4 has surpassed $200 billion in swap volume.
    • The breakthrough has renewed interest in Uniswap.
    • The update coincides with an over 10% increase in native UNI’s price.

    Cryptocurrencies recorded substantial gains on Monday after the United States Senate voted to end the ongoing government shutdown.

    Amidst the broad-based optimism, UNI extended its daily gains by over 12% as Uniswap Labs celebrated a remarkable breakthrough.

    The team protocol took it to X to confirm that Uniswap v4 has handled over $200 billion in swap volume, making it one of the most active networks in the DeFi industry.

    Notably, Uniswap released the version 4 upgrade in January this year to increase efficiency, reduce costs, and enhance developer activity through customized liquidity pools.

    The massive swap volume underscores demand and interest in the past months.

    The announcement coincided with UNI’s recovery.

    Moreover, it has sparked renewed interest in the DEX. The timing is also crucial.

    As the overall cryptocurrency market regains momentum, the $200 billion swap volume reflects Uniswap’s key role in decentralized trading.

    Enthusiasts react to rising activity

    The decentralized exchange sees renewed optimism from DeFi players and retail traders.

    UNI’s surge coincides with increased trading volumes across leading exchanges.

    Coinglass data shows Uniswap’s Open Interest has climbed to $344 million after a sharp rise today.

    Meanwhile, market watchers perceive the $200 billion milestone as a sign of a vibrant chain driven by demand, not only short-term stats.

    The robust swap volume reflects active participation, stable liquidity, and confidence in Uniswap’s future potential.

    One crypto enthusiast and X user:

    “While others talk decentralization, Uniswap quietly becomes the backbone of DeFi. $200B speaks louder than any narrative.

    Why is Uniswap v4 unique?

    Released in January 2025, Uniswap’s v4 upgrade introduced key changes in decentralized trading systems.

    For instance, the version introduces hooks, a mechanism that allows developers to create liquidity pools with custom features.

    That welcomed innovations like automated strategies, dynamic fees, and streamlined user experience.

    V4 has gradually gained traction among liquidity providers and developers since launching.

    Meanwhile, crossing $200 billion in swap volume confirms that the upgrade introduced practical improvements.

    At a time when the decentralized trading space sees intense competition from perpetual DEXs like Hyperliquid and Aster, Uniswap’s growth remains remarkable.

    The $200 billion swap volume signals the protocol’s relevance amid shifting preferences.

    UNI price outlook

    Uniswap’s native token traded in green as the community cheered the $200 billion swap volume.

    UNI climbed from $6.40 to $0.78 in the past 24 hours, a roughly 12% uptick.

    It is trading at $6.90 after correcting from intraday highs, with soaring trading volumes signaling renewed enthusiasm.

    While the swap volume milestone signals a brighter future for UNI, broader sentiments will shape its short-term performance.

    Continued overall market recoveries would extend the alt’s rally, whereas sudden selling pressure might erase the gains.


    Source link

  • Arweave (AR) price forecast as it rides the DePIN sector momentum

    Arweave (AR) price forecast as it rides the DePIN sector momentum

    Arweave (AR) price forecast

    • Arweave price has rallied 25.5% today, leading the DePIN sector surge.
    • Arweave Day Asia has boosted the AO ecosystem and developer interest.
    • The immediate support sits at $5.03 while the resistance is found near $6.31.

    Arweave (AR) price has witnessed a powerful 25.5% rally in the past 24 hours, outpacing both the broader crypto market and its peers in the Decentralised Physical Infrastructure Networks (DePIN) sector.

    This comes amid renewed investor interest in decentralised storage projects as traders position themselves for a potential long-term breakout.

    DePIN sector sees renewed interest

    The DePIN sector has captured attention this week, surging 10.93% as investors rotate into decentralised infrastructure plays.

    Arweave (AR) and Filecoin lead the charge, posting impressive 37.9% and 51.8% weekly gains, respectively, coinciding with growing awareness of the risks tied to centralised cloud providers like AWS and Microsoft, which recently experienced widespread outages.

    The Microsoft and AWS outages have underscored the need for resilient, decentralised storage systems — an area where Arweave’s permanent storage model shines.

    By offering a censorship-resistant, immutable data layer, Arweave positions itself as a reliable alternative to traditional cloud giants.

    Traders and enterprises alike are beginning to recognise this value, as reflected in the 348% surge in Arweave’s 24-hour trading volume.

    Analysts note that Arweave’s technology offers more than just decentralised storage; it provides long-term data permanence.

    With Layer 2 networks such as Starknet and Optimism exploring Arweave for archiving purposes, the token’s fundamentals appear increasingly robust.

    If enterprise and blockchain adoption continue to expand, AR could cement its role at the heart of the DePIN movement.

    Arweave Day Asia adds fuel

    Arweave Day Asia, held in early October, played a major role in fueling optimism around the AR price.

    The event showcased AO, Arweave’s decentralised computing framework, and introduced “DevBot,” a tool that allows AI-generated decentralised applications to be deployed directly on Arweave’s network.

    Attendees witnessed live demonstrations of dApp creation, customised digital merchandise, and network upgrades — all aimed at lowering the barriers to decentralised development.

    The event generated significant excitement among developers and investors, reinforcing Arweave’s image as a versatile ecosystem rather than a single-purpose storage project.

    This renewed confidence in AO’s potential has added a strong narrative tailwind.

    Developers are increasingly drawn to the idea of building AI-assisted, on-chain applications that live permanently on Arweave.

    This has, in turn, contributed to sustained bullish sentiment, helping AR extend its gains amid a broader market slowdown.

    Arweave (AR) price analysis

    Technically, the Arweave (AR) price has broken key resistance levels, signalling growing bullish momentum.

    After crossing the 23.6% Fibonacci retracement at $5.03 and the 30-day simple moving average at $4.22, AR now eyes the next resistance at $6.31.

    The relative strength index (RSI) remains moderate at 64, suggesting room for further upside before approaching overbought territory.

    CoinLore’s analysis supports this outlook, emphasising that AR must hold above $4.82 to maintain its bullish structure.

    A sustained move above $6.20 could pave the way toward $8.31 and $10.40.

    On the downside, failure to defend $4.82 might open the door to deeper corrections toward $1.32, a level last seen during previous market cycles.

    Meanwhile, long-term projections remain highly optimistic.

    Analyst Render With Me identifies immediate support between $9.15 and $13.27, suggesting that the token could consolidate before pursuing a more ambitious rally.

    Render With Me’s forecast places short-term targets between $25.31 and $28.17, with a long-term horizon aiming as high as $61.97 to $71.46 if market and sector conditions align.

    However, sustaining momentum above the $5.03–$6.31 range remains critical as overall crypto liquidity declines.


    Source link

  • Aave price slides 10% as bearish momentum sweeps crypto

    Aave price slides 10% as bearish momentum sweeps crypto

    Early PUMP investors dump 25.5B tokens, pocketing nearly $40M profit

    • Aave dropped 10% in the past 24 hours, signalling strong bearish control.
    • On-chain data shows increased net outflows and spiking intraday volume, indicating panic selling by traders.
    • The $265–$250 range is critical, with a potential further decline to $225 if support fails.

    Aave, a leading decentralized finance token, has seen its price drop to $250 as the cryptocurrency market experiences significant price swings.

    Increasing bearish momentum has driven significant selling pressure, with Bitcoin and Ethereum at key levels.

    Aave price slides to $250

    Aave’s price has dropped sharply to $250, breaking below the critical $270–$265 support zone in a decline that marks a significant retreat from its recent highs near $300.

    The token now trades well below its key exponential moving averages and is down 25% in the past 30 days.

    On-chain data reveals substantial outflows, with netflows showing $11.26 million in exchange movements.

    This kind of outlook signals panic-driven selling among traders.

    For AAVE, the immediate support range of $245–$250 is now critical, with a potential further slide to $229 if this level fails to hold.

    Despite the launch of Aave’s v4 upgrade, which introduced a cross-chain Hub-and-Spoke design, the token has struggled to maintain bullish momentum.

    Trading volume has increased 159% in the past 24 hours to $593 million. Although volume is up, the price decline reflects waning retail interest.

    Aave price drops as bearish momentum deepens

    The deepening bearish momentum in Aave’s price action reflects broader market challenges and technical breakdowns.

    The Relative Strength Index has fallen to 20.9, indicating heavily oversold conditions, though no immediate reversal has materialised.

    Aave’s market capitalisation has dropped to approximately $3.9 billion, reflecting its underperformance compared to other DeFi tokens.

    The crypto market has experienced setbacks, with reduced expectations for a Federal Reserve rate cut dampening demand for high-risk assets.

    Aave price chart by TradingView

    Large holders have reduced positions, with wallets holding 100,000 to 1 million AAVE cutting their stakes by 4.3%, as some analysts suggest that the oversold RSI could trigger a short-term relief rally.

    The failure to reclaim the $289–$292 range keeps the near-term outlook negative if selling pressure persists, as Aave risks testing the $2220 support level.

    AAVE bulls last saw these levels in early June 2025.

    Broader market outlook

    Bitcoin and Ethereum’s declines highlighted a sharp descent for most alts.

    Some of the top coins by market cap, like Solana, XRP and Dogecoin, shed recent gains.

    Aave’s decline to $250 and the mounting bearish momentum highlight the broader pressure on crypto and other risk assets following sharp gains in recent months.

    DeFi tokens, which surged alongside Ethereum’s run to record highs, are now facing renewed selling pressure in the current environment.

    Analysts are warning that September could see further downside, with expectations of deeper pullbacks if sentiment continues to sour.

    Source link

  • SOL price gains momentum as DeFi Dev Corp adds $77M in Solana to treasury

    SOL price gains momentum as DeFi Dev Corp adds $77M in Solana to treasury

    • The company has acquired 407,247 SOL tokens in its latest purchase.
    • DeFi Dev Corp. now holds Solana worth around $371M, 1.83 million coins.
    • On-chain indicators support SOL’s upside trajectory.

    The first Nasdaq-listed firm with a Solana-centric treasury strategy is once again in the spotlight.

    According to the latest press release, DeFi Development Corp. disclosed the purchase of 407,247 SOL assets valued at approximately $77 million.

    The recent accumulation increased the company’s total SOL holdings to 1,831,011 tokens, worth around $371 million.

    Notably, DeFi Dev Corp. utilized the latest fundraising to fund the purchase, and still holds more than $40 million for more Solana buys and supporting treasury operations.

    The bold bet signals the firm’s conviction in Solana’s growth trajectory.

    Solana price displays optimistic performance amid these developments, with on-chain metrics supporting DeFi Dec Corp’s accumulation strategy.

    Long-term holding and staking plans

    DeFi Development Corp. made it clear that it is not after short-term gains.

    The firm confirmed that it will hold the newly purchased Solana long-term and stake the assets across different validators.

    The announcement stated:

    The newly acquired SOL will be held long-term and staked to a variety of validators, including DeFi Dev Corp’s own Solana validators to generate native yield.

    The staking strategy enables the firm to generate native yield while ensuring the security and health of Solana’s blockchain.

    Further, the approach means additional earning opportunities for shareholders as it combines staking incentives and SOL price growth.

    What does it mean for Solana?

    Solana has dominated crypto trends over the past months, with increased adoption in payments, meme coins, DeFi, and NFTs.

    Its scalability and speed have made it a perfect alternative for institutions and developers.

    DeFi Dev Corp’s Solana holdings reflect how markets are increasingly viewing Solana as an asset with potential beyond speculation.

    Furthermore, endorsement by a Nasdaq-listed company legitimizes the altcoin, making it attractive for institutions seeking crypto exposure.

    Solana bullish outlook

    These developments come as the native token traded in the green region.

    SOL gained more than 15% the previous week to $211.

    Bullish sentiments fuel the chain, especially as the community votes for the Alpenglow proposal.

    The proposal seeks to reduce block finality to 150 milliseconds from 12.8 seconds.

    That will turbocharge the blockchain by supporting thousands of transactions per second while ensuring near-zero transaction charges.

    That makes the Ethereum twelve-minute finality glacial.

    Simply, the second-largest blockchain takes minutes to finalize transactions. In Solana, it is instant.

    These narratives echo analysts, who are predicting massive gains for SOL.

    For example, Ali Martinez mapped Solana’s path to $300 in the near-term.

    That would mean a rally of over 40% from the current market price.

    Moreover, prevailing institutional interest sets the stage for significant long-term rallies.

    Proponents believe Solana has what it takes to skyrocket to $1,000 in a full-blown bull market.


    Source link

  • Mantle price outlook as MNT gains momentum with 20% spike

    Mantle price outlook as MNT gains momentum with 20% spike

    Mantle Price Bullish

    • Mantle is up 20% in 24 hours amid overall altcoin rcovery.
    • The MNT token reached highs of $0.91 on Tuesday and could break to $1 and eye the all-time high of $1.51.
    • Ecosystem growth buoys overall bullish momentum.

    Mantle (MNT) price has surged more than 20% in the past 24 hours, jumping from lows of $0.72 to $0.91.

    This uptick aligns with other altcoins’ bounces over the past day, with likes of Litecoin and Pump.fun among top gainers in the largest 100 coins by market cap.

    Notable gains for Mantle have come amid a 280% surge in daily volume to $622 million, while its market cap has increased to $2.96 billion.

    Mantle pumps 20% as altcoins bounce

    As noted, Mantle’s price surge coincides with a pump in the broader altcoin market.

    A lot of the upside momentum has come after last week’s sell-off, with an announcement from the Commodity Futures Trading Commission buoying investors.

    MNT price has also benefited from a robust network, which boasts a significant increase in stablecoin market cap to $653 million.

    The total value locked in DeFi on the protocol has also jumped to $233 million, largely helped in recent weeks by a surge in activity around its ecosystem.

    Also worth noting is Mantle’s contribution of 101,867 ETH worth over $388 million to the Strategic ETH Reserve.

    Institutional inflows through initiatives like the Mantle Index Four and innovative products such as mETH Protocol for liquid staking add further upside fuel. Lookonchain highlights these in the X post below.

    Mantle’s strong market momentum has MNT trading towards the psychological $1 mark. The last time bulls hovered at or above this level was in February 2025.

    Is Mantle price poised for a breakout to a new all-time high?

    Mantle’s price trajectory has bulls eyeing fresh bids above $1, and analysts say a breakout above this level could catapult MNT past its all-time high of $1.51. The altcoin reached this milestone on April 8, 2024.

    On the daily chart, technical indicators provide bullish signals. The Relative Strength Index (RSI) stands at 66 and upsloping to indicate potential upside continuation before hitting the overbought zone.

    Mantle price chart by TradingView

    Meanwhile, the Moving Average Convergence Divergence (MACD) indicator suggests a bullish crossover. Per the chart above, the MACD line is looking to cut above the signal line, highlighting a potential short-term bullish momentum.

    Mantle is also trading near the upper Bollinger Band at $0.87 with price above the middle line and with likely support at the lower band of $0.68.

    A decisive break above the upper resistance could signal a bullish flip, allowing buyers to extend gains past $1 to the $1.40 region.

    A confirmation of an upbeat sentiment from other catalysts will help this bullish trend. The downside however could make $0.68 a key level to watch. Major support also lies near $0.55.


    Source link

  • Ethereum price prediction: ETH derivatives data shows weak momentum

    Ethereum price prediction: ETH derivatives data shows weak momentum

    Ethereum price prediction

    • ETH derivatives show weak momentum despite strong ETF inflows.
    • Ethereum’s network activity and TVL continue to decline.
    • Technical analysis hints at long-term upside, but traders stay cautious.

    Ethereum (ETH) has seen a strong price surge in recent weeks, gaining more than 54% over the past month and trading at around $3,755 at press time.

    However, despite this rally and strong spot ETF inflows, derivatives market data paints a very different picture, casting doubt on whether Ethereum can break through the psychologically significant $4,000 level any time soon.

    In essence, the disconnect between bullish institutional inflows and weak derivatives metrics raises several questions for market participants.

    Is Ethereum’s recent rally sustainable, or is it merely a reflection of speculative optimism driven by ETF hype?

    Furthermore, are investors losing confidence in Ethereum’s network fundamentals amid rising competition from rival blockchains?

    Derivatives market tells a cautious tale

    While Ethereum’s spot market has been energised by inflows into exchange-traded funds, futures data shows traders are hesitant to commit to leveraged bullish positions.

    As of Thursday, the annualised funding rate for ETH perpetual futures had fallen back to 9%, down from 19% earlier in the week, with the ETH OI-weighted funding rate dropping to 0.0043% from 0.0163% on July 21.

    ETH OI-weighted funding rate

    This suggests waning demand for long positions, even after a near 46% gain in ETH price since early July.

    This behaviour is unusual. Historically, rising prices coincide with stronger futures premiums, yet the current trend indicates hesitation.

    The 3-month ETH futures premium has also softened slightly to 6%, down from 8% just days ago.

    While this still sits within a neutral range, it reveals a reluctance among whales and market makers to bet aggressively on further price appreciation in the near term.

    Ethereum network weakness frustrates investors

    The cautious tone in derivatives is likely being fueled by stagnant on-chain activity.

    Ethereum’s total value locked (TVL) dropped to a five-month low of 23.4 million ETH, falling 11% in just 30 days.

    That sharp decline comes despite ETH’s rising dollar value and highlights a significant reduction in the volume of assets being deployed within the ecosystem.

    In contrast, Solana’s TVL only fell 4% during the same period, while BNB Chain’s TVL rose 15% in native token terms.

    These shifts show that competing platforms are either maintaining or growing their utility at a time when Ethereum’s activity appears to be plateauing.

    Even more concerning is Ethereum’s decline in dominance among decentralised exchange (DEX) volumes.

    According to DefiLlama, Ethereum recorded $81.32 billion in DEX activity over the past month.

    Solana surpassed that with $82.9 billion, while BNB Chain led with a staggering $189.2 billion.

    These figures highlight that Ethereum is no longer the go-to platform for certain core DeFi activities.

    Technical analysis signals a mixed ETH price outlook

    Despite lukewarm derivative activity, technical analysts remain divided on Ethereum’s future trajectory.

    Popular investor Ivan On Tech has pointed to a symmetrical triangle pattern that could lead to a breakout toward $7,709, more than double the current price.

    Meanwhile, another analyst, Mikycrypto Bull, has identified a long-term ascending triangle formation dating back five years, which could theoretically launch ETH as high as $16,700.

    Adding to the bullish sentiment is a recent MACD crossover on the monthly chart, a signal that has preceded major rallies in previous cycles.

    However, while long-term technicals hint at explosive potential, short-term forecasts are more cautious.

    ETH must first break through $4,100 and hold above $3,700 to sustain its upward momentum.

    Corporate confidence grows amid market doubts

    Institutional and corporate adoption of Ethereum continues to grow.

    Firms such as SharpLink Gaming and World Liberty Financial have accumulated substantial ETH reserves in recent months.

    SharpLink now holds over 438,000 ETH and actively stakes its assets to generate passive income.

    World Liberty Financial has acquired over 77,000 ETH, with recent purchases near $3,294 per coin.

    These moves suggest that some institutions are positioning Ethereum as a long-term strategic asset.

    Their investments reflect confidence in Ethereum’s evolving role as foundational infrastructure for decentralised applications and finance.


    Source link

  • XRP gains momentum as real-world assets on XRPL rise 2,260%

    XRP gains momentum as real-world assets on XRPL rise 2,260%

    XRP Price Outlook

    • The XRP price is near its all-time high as altcoins see gains.
    • XRP Ledger’s tokenized RWA grew 2,260% in six months, from $5 million to over $118 million.
    • Other metrics and broader market developments add to the bullish outlook for XRP.

    Ripple’s XRP trades around $3.50 as it continues to hover near its all-time high, with price up 21% in the past week and over 66% in the past month.

    While the overall cryptocurrency bullish sentiment has helped, key network and ecosystem catalysts are emerging, including the XRP Ledger witnessing staggering growth in tokenized real-world assets (RWAs) over the past six months.

    XRPL tokenized RWA grows 2,260% in six months

    According to the latest report, the XRP Ledger (XRPL) is gaining traction in the tokenized real-world assets market.

    In just the past six months, XRPL saw its on-chain RWA value share jump from $5 million in January 2025 to over $118 million by July 2025. This accounts for a notable 2,260% increase, growth that coincides with an explosion in the overall tokenization trend.

    Token Relations shared the XRPL data on RWA growth in a recent article on X, noting the sharp increase aligns with the Ripple network’s rising appeal as a tokenized assets platform. High transaction volumes that include a peak of 2.48 billion XRP in daily payments adds to this outlook.

    XRPL has attracted RWA integrations from Archax and Abrdn, Guggenheim Treasury Services, and Ondo Finance.  Mercado Bitcoin also plans to tokenize over $200 million in assets on the XRP Ledger, further expanding the platform’s traction.

    Assets on-chain on XRPL include U.S. Treasury bills, commercial paper, and money market funds among other traditional financial instruments.

    XRP price forecast: Ripple network activity could be key

    Tokenized RWAs is not the only metric highlighting XRP’s potential. Other key catalysts have come into play, including network milestones such as the launch of the EVM sidechain and integration of Ripple USD (RLUSD), a stablecoin that’s getting huge adoption calls.

    “Since going live, the XRPL EVM Sidechain has seen organic developer adoption, with over 1,300 smart contracts deployed, participation from more than 17,000 unique addresses, and the creation of more than 120 tokens,” Token Relations noted.

    The spot exchange-traded fund (ETF) anticipation is also crucial, as is regulatory clarity and Ripple’s settlement of its SEC legal woes.

    XRP price has gained amid these developments, with Ripple’s market cap surpassing the $200 billion as XRP hit highs of $3.64. Notably, the cryptocurrency reached its all-time high of $3.84 in 2018 and analysts say this is a milestone bulls are poised to exceed in the short-term.

    From a technical outlook angle, XRP shows strong bullish momentum. As institutional interest grows amid a confluence of regulatory clarity and network partnerships, it is clear XRP could target parabolic gains.


    Source link

  • PepeX maintains upside momentum as Bitcoin, Solana dominate the majors

    PepeX maintains upside momentum as Bitcoin, Solana dominate the majors

    PepeX, the first AI-powered memecoin launchpad, kicks off presale

    Bitcoin and Solana have emerged as top performers as crypto majors and meme tokens strive to recover. While investors shift to Bitcoin for its stability, Solana has become a key player in DEX trading.

    At the same time, investors are on the look out for fresh projects with robust growth potential. PepeX, which has emerged as one of the top meme ICOs to watch out for in 2025, offers its holders an irresistible opportunity to rake in hefty gains during its presale and beyond. Its infrastructure seeks to restore transparency, fairness, and accessibility in the meme crypto space.

    Bitcoin heightened dominance paves the way to $90,000

    Bitcoin price began the new week on a high; rallying to a three-week high in early Monday session. Since hitting a five-month low two weeks ago, the crypto major has rebounded by about 17%. At the time of writing, it was trading at $87,488. 

    Despite the persistent economic uncertainties, bulls are optimistic that Bitcoin price will soon retest the crucial zone of $90,000. CoinGecko’s 2025 Q1 crypto industry report showed that despite the drop in investor activity, Bitcoin’s dominance in the cryptocurrency space hit a level last recorded in early 2021 at 59.1%. 

    Having rebounded past the 25 and 50-day EMAs, the bulls have an opportunity to retest the crucial support-turn-resistance zone of $90,000. However, the bulls will need to gather enough momentum to break the immediate-term resistance at $89,075. On the lower side, $82,959 is set to offer steady support to Bitcoin price. 

    Bitcoin Price
    Bitcoin Price

    PepeX maintains upward momentum as it restores integrity in the meme crypto space 

    AI-related cryptocurrencies have captured investors’ attention as they look past the majors for projects with robust growth potential. In the past 24 hours, AI meme market cap rose by 6.5% to $2.34 billion.

    Notably, most of these fresh projects are moving past meme jokes to offer solutions to existing challenges within the crypto space. PepeX is one such crypto. As the world’s first AI-powered tokenization launchpad, it seeks to solve the persistent issues of security, fairness, and transparency. Indeed, it comes at an opportune time and investors are taking note of it. 

    In the recent past, platforms like Pump.fun have allowed pump-and-dump schemes that saw investors lose hefty amounts of money. To solve this issue, PepeX has integrated anti-sniping tools and a bubble map tool to discourage early dumping and any shady launches. Besides, the creators’ holdings are capped at 5% of the total supply, which they could lose to its community should the project fail. 

    This one-of-a-kind infrastructure has attracted the attention of meme coin enthusiasts, enabling it to raise over $1.4 million just four weeks into its presale. In addition to its real-world use case and subsequent growth potential, early adopters have an opportunity to rake in huge gains during the 30-stage presale. 

    With every three-day stage, the token price increases by 5%. What started at $0.02 is currently at $0.0243 and is set to rally further to $0.0823 before the token hits the public shelves in Q3. Read more on how to buy PepeX.

    Solana dominance in DEX trading fuels recovery

    Solana Price Chart
    Solana Price Chart

    In the recent months, altcoins and meme coins have been under selling pressure. However, as the assets find their footing, Solana has emerged as one of the top performers. 

    Notably, its dominance in the decentralized exchange (DEX) space has fueled its recovery. As highlighted by CoinGecko, Solana dominated DEX trades at a rate of 39.6% in Q1’25. 

    A look at its daily chart shows Solana price trading above the 25 and 50-day EMAs. In the short term, I expect $126.90 to be a steady support zone as the bulls strive to break the resistance at $144.50. If successful, the next target will be at $155. 

    Source link

  • iDEGEN hits public shelves with momentum as crypto prices crash

    iDEGEN hits public shelves with momentum as crypto prices crash

    Bitcoin dump

    AI meme crypto market has grown to a market cap of $2.4 billion, and iDEGEN is set to take its rightful position on the table. After three months in the presale stage, it has hit the public shelves with the same viral momentum. 

    Its early adopters are set to continue reaping big from the project as the uncensored AI agent revolutionizes the crypto space. In addition to the 300,000% gains already locked in, its value may surge by at least 10X in coming months. This is despite the selling pressure current felt across the crypto majors.

    Ripple price chart pattern hints at further selling pressure in the short term

    After trading steadily above the support zone of $2.5000 in the past one week, Ripple price has plunged by about 16% since Monday. Similar to other crypto majors, the altcoin is under pressure as extreme fear grips the broader market. 

    A look at its daily chart points to the formation of a bearish death cross pattern as the short-term 25-day EMA crosses the 50-day EMA to the downside. In the near term, the range between $2.0000 and $2.3357 is worth watching. For a firm trend reversal, the bulls will need to gather enough momentum to rebreak the resistance at $2.5500.

    XRP Price
    XRP Price

    iDEGEN debuts on Raydium with the same viral momentum

    iDEGEN has hit the public shelves as promised; ending the three-month-long presale. It has debuted on Raydium, a Solana-based DEX and is set to also list on BitMart on 4th March.

    What started on a blank slate ready to learn from the crypto degens on X has grown into an ultra-popular AI crypto with the potential to compete with other AI meme coins like AI16Z, Hamster Kombat, and Fartcoin. 

    In three months, it has managed to raise $25 million. This has been made possible by its aggressive community, apt timing, and booming AI crypto market. If the presale is anything to go by, its viral momentum is set to yield growth of atleast 10X in the coming months. At its last stage price of $0.038, its early adopters are already enjoying returns of upto 300,000%. 

    Bitcoin spot ETF records streak of outflows as tariff jitters persist

    Bitcoin price

    Concerns over the impact that Trump’s trade policies will have on the US economy have triggered a shift in the market sentiment. Compared to last week’s neutral level of 49, the crypto fear & greed index is now at an extreme fear level of 10. 

    With the resultant plunge in Bitcoin price, Bitcoin spot ETFs have seen persistent outflows as its institutional demand falls. According to SoSoValue, Bitcoin spot ETFs recorded daily total outflows of $754.53 million on Wednesday. Notably, the trend has been on for 7 sessions in a row. 

    On its daily chart, the bearish death cross pattern points to continued selling pressure in the short term. At its current level, the bulls will be keen on defending the support at $81,600. A subsequent correction may have it rebound past $85,000 to find resistance at $90,000. 


    Source link