Tag: onchain

  • Chainlink price forecast as key metrics point to increased onchain activity

    Chainlink price forecast as key metrics point to increased onchain activity

    Chainlink Price Outlook

    • Chainlink price broke to highs $26 before correcting slightly.
    • LINK is surging amid a spike in onchain activity.
    • Partnerships and adoption trends remain bullish for Chainlink.

    Chainlink (LINK) broke above $26 for the first time in months on Monday, surging amid a notable spike in onchain activity.

    As LINK pares gains amid broader profit taking, analysts are saying the recent explosion of key network metrics could allow bulls to breach the supply wall at $30 as they target the all-time high of $52 seen over four years ago.

    Chainlink sees significant surge in onchain activity

    According to Santiment, Chainlink’s onchain activity has witnessed a significant spike in the past week.

    For instance, on Sunday, August 17, a total of 9,813 unique LINK addresses executed at least one transaction, while the next day saw more than 9,625 new LINK wallets.

    Per the onchain analytics provider, both metrics represent the blockchain network’s highest levels for the year.

    “Onchain activity has been even more impressive than the price,” Santiment analysts noted.

    Partnerships and LINK reserve

    Recently, Visa’s head of crypto, Cuy Sheffield, explained via Visa’s Tokenized podcast, that Chainlink is a major pull for institutional entry into crypto.

    Apart from Visa, Chainlink has partnered with ANZ, China AMC, and Fidelity International to bring cross-chain, cross-border settlements to tokenized assets across Australia and Hong Kong.

    A Mastercard partnership is also huge for LINK.

    Chainlink Data Streams is another solution seeing huge integration. Data Streams are now live for U.S. equities and exchange-traded funds such as AAPL, NVDA and CRCL.

    Chainlink also recently partnered with Intercontinental Exchange, the parent company of the New York Stock Exchange.

    “Using ICE’s Consolidated Feed data as an input into Chainlink’s derived FX and precious metals rates onchain via Chainlink’s institutional-grade infrastructure is a watershed moment in the evolution of global markets,” said Fernando Vazquez, president of capital markets at Chainlink Labs. “This collaboration signals a pivotal shift towards a unified, globally accessible onchain financial system, with hundreds of trillions in assets on a clear path to tokenization.”

    Chainlink Reserve, an effort launched to support Chainlink’s traction in the DeFi and TradFi ecosystems, is also a major boost.

    As well as being geared towards establishing Chainlink as a standard solution for global crypto adoption, the program bolsters its tokenized assets growth.

    What’s next for LINK price?

    Chainlink’s price action amid the surge in network activity suggests bulls are confident in LINK.

    Chainlink price chart

    Having broken above $20 and strengthened to $26, Chainlink is showing resilience. While bears have a say on immediate LINK price action, analysts say the altcoin could be on the cusp of a significant breakout.

    While the key metrics indicate that Chainlink’s network growth is outpacing price gains, there are more bulls who are upbeat about.

    A confluence of catalysts such as network integration across decentralized and traditional finance, whale accumulation and macro conditions, is what could propel LINK toward its ATH and into price discovery mode.

    LINK traded at the all-time high above $52 in May 2021, a level bulls may target if market conditions align. Currently, the altcoin is on an uptrend since hitting lows of $16 on Aug. 6.

    Source link

  • BTC holds $106K; analysts point to institutional integration, on-chain innovation

    BTC holds $106K; analysts point to institutional integration, on-chain innovation

    BTC holds $106K; analysts point to institutional integration, on-chain innovation

    • Bitcoin (BTC) regained its footing, trading around $106K after a tense weekend involving a US strike on Iran.
    • Bitcoin’s resilience is attributed to its growing integration into the broader macro-financial system via institutional infrastructure.
    • Bitcoin ETFs saw massive inflows ($1.1B last week, $350M one day), cited as a major bullish tailwind.

    Bitcoin (BTC) has regained its footing, hovering around the $106,000 mark as the Asian trading week gets underway on Wednesday.

    This resilient performance comes after a tense weekend that saw the US bomb an Iranian nuclear site, with Bitcoin now pushing past levels seen earlier this month when Israel first bombed Iran.

    This stability, in the face of significant geopolitical turmoil, is increasingly being attributed to a fundamental shift in Bitcoin’s market structure and a renewed wave of innovation flocking to its blockchain.

    Part of the reason why the crypto market has recovered so swiftly alongside traditional markets is the growing correlation between the two.

    The days of Bitcoin operating in a vacuum appear to be over. “Bitcoin’s sensitivity to traditional asset classes and macroeconomic indicators has evolved markedly over the past few market cycles, reflecting its growing integration into the broader macro-financial system,” reads a recent report from Glassnode and Avenir Group.

    This integration has been facilitated by the development of a robust institutional infrastructure. “Institutional infrastructure has reshaped how capital engages with bitcoin,” the report continues.

    As a result, its market behavior is increasingly governed by structural liquidity, long-horizon positioning, and regulated access points.

    This institutional backbone was clearly visible again this week. Semir Gabeljic, director of capital formation and investment strategy at Pythagoras Investments, highlighted the significant impact of Exchange-Traded Funds (ETFs), citing them as a major tailwind.

    “The huge recent capital inflows in Bitcoin ETFs of $1.1 billion last week and even $350 million today alone” are driving the positive trend, Gabeljic noted.

    Spencer Yang, a Core Contributor to Fractal Bitcoin, added another perspective on Bitcoin’s ability to shake off the war jitters so quickly.

    He argued that, fundamentally, nothing has changed about the asset class itself as a result of the conflict in the Middle East.

    The core metrics that long-term investors look to for Bitcoin remain intact. Furthermore, other bullish on-chain signals are potentially on the way.

    “We’re seeing continued interest in protocols like BRC-20, especially with the recent upgrade, as well as Runes and Alkanes, which have been getting a lot of attention,” Yang added.

    So overall, on‑chain activity across the board is increasing thanks to these types of assets.

    The key takeaway seems to be that as Bitcoin’s market becomes increasingly defined by institutional demand and macroeconomic liquidity cycles, its price action is becoming less about knee-jerk reactions to headlines and more about long-term capital commitment.

    It is this structural shift that appears to be anchoring Bitcoin firmly above the $100,000 level, despite the surrounding noise.

    Tim Draper’s thesis

    Adding to this long-term bullish outlook, legendary venture capitalist Tim Draper has argued that the Bitcoin blockchain is becoming the new epicenter for crypto innovation.

    In a recent post on the social media platform X, Draper drew a compelling parallel, suggesting that Bitcoin is now absorbing ideas once exclusive to altcoins, much in the same way that Microsoft once consolidated the software revolution under its dominant operating system empire.

    Draper pointed to Bitcoin’s rising dominance – a metric equivalent to its “market share” in the crypto world – as evidence.

    This figure has risen to over 60%, up from 40% after the 2017 boom-bust cycle and 50% following the 2021 peak, signaling that Bitcoin is reasserting its control over the broader crypto ecosystem.

    Much like how Microsoft integrated or cloned early software success stories like Lotus 1-2-3, WordPerfect, and PowerPoint to create its powerful software suite, Draper says Bitcoin is now systematically incorporating innovations that were once the exclusive domain of altcoins.

    These include functionalities like smart contracts, decentralized finance (DeFi), ordinals (a form of on-chain digital artifacts), and low-cost layer 2 scaling solutions.

    “All the successful innovations on other platforms are now being ported to Bitcoin,” Draper wrote, describing it as an “acceleration” that mirrors the consolidation phases seen in Big Tech.

    He argued that developers are increasingly gravitating toward Bitcoin because it is the most secure and valuable blockchain.

    Draper, who runs a Bitcoin-focused accelerator with Boost VC, stated that the next generation of entrepreneurs is building on Bitcoin not just for ideological reasons, but because the infrastructure and surrounding ecosystem are now mature and ready for this new wave of development.

    “Smart entrepreneurs are always building on the platform with the strongest gravitational pull,” he wrote.

    “That platform is Bitcoin.”

    Source link

  • Polyhedra’s ZKJ token collapses following ‘abnormal on-chain activity’

    Polyhedra’s ZKJ token collapses following ‘abnormal on-chain activity’

    Polyhedra’s ZKJ token collapses following ‘abnormal on-chain activity’

    • The Polyhedra Network (ZKJ) token has plunged 91% after abnormal on-chain activity.
    • Binance has blamed whale exits and a liquidation cascade for the token crash.
    • The upcoming June 19 token unlock may trigger further price drops.

    The cryptocurrency market has once again been rocked by a dramatic price collapse, this time involving Polyhedra Network’s native token, ZKJ.

    The ZKJ token has suffered an unprecedented decline of over 91% in less than 24 hours, sending shockwaves across exchanges and drawing scrutiny from regulators, investors, and analysts alike.

    ZKJ, which had been trading steadily around $2.00 for over a month, crashed to a record low of $0.2676 on June 15, 2025, wiping out nearly $500 million in market capitalisation.

    ZKJ token crash

    This price crash has raised serious concerns over liquidity risks, tokenomics structure, and the influence of large holders in decentralised finance.

    What caused the sudden Polyhedra Network (ZKJ) price collapse?

    The ZKJ price collapse began early on June 15 when Polyhedra Network posted on X (formerly Twitter) that a wave of “abnormal on-chain transactions” had struck the ZKJ/KOGE trading pair.

    Within hours, the token’s price plummeted by more than 83%, as market participants scrambled to understand what had triggered the meltdown.

    Binance later weighed in, attributing the collapse to a liquidity crisis stemming from large-scale withdrawals involving KOGE, a token closely paired with ZKJ.

    According to the exchange, these withdrawals created a “liquidation cascade” as major wallets began offloading their holdings.

    As KOGE’s USDT pool was drained, traders moved their assets into the ZKJ/USDT pool, which quickly became overloaded.

    This sudden shift overwhelmed the system, accelerating the sell-off and deepening the decline in ZKJ’s value.

    Massive withdrawals and whale activity

    Blockchain data has revealed several wallets that had been actively farming Alpha Points before the crash.

    One wallet alone withdrew more than $3.7 million in KOGE and $530,000 in ZKJ.

    Two other wallets combined pulled out nearly $5 million, further intensifying the downward spiral.

    These actions suggest the involvement of large holders, commonly known as whales, whose exits likely triggered cascading liquidations across leveraged positions.

    As prices tumbled, margin calls were activated, leading to forced liquidations that compounded the selling pressure.

    Although some community members have speculated about foul play, no leading blockchain analytics platform has verified such claims.

    Polyhedra, for its part, insists it is conducting a thorough review and maintains that its core technology remains unaffected.

    Binance has altered its Alpha Points rules for ZKJ and KOGE

    In response to the unfolding situation, Binance announced a major change to its Alpha Points rewards program.

    Starting June 17, trades between Alpha tokens, including ZKJ and KOGE, will no longer count toward Alpha Points calculations.

    This policy shift is aimed at reducing systemic risk and discouraging concentrated trading behaviors that can lead to abrupt market failures.

    Binance’s decision is being viewed as a proactive step to restore market integrity and reduce manipulation.

    Upcoming token unlock adds to the bearish pressure

    Further adding to investor anxiety is the imminent unlock of 15.5 million ZKJ tokens scheduled for June 19.

    Valued at approximately $10 million, this unlock could flood the market with fresh supply at a time when confidence is already severely shaken.

    Given that this represents more than 5% of the current circulating supply, market analysts warn that another sharp drop could occur if holders rush to sell upon unlocking.

    The timing could not be worse for a token already reeling from its steep fall.


    Source link

  • Litecoin price outlook as on-chain activity spikes

    Litecoin price outlook as on-chain activity spikes

    • Litecoin price was down 3% to trade around $67 on Friday morning.
    • Santiment wrote on X that the altcoin has seen a rapid increase in on-chain movement.
    • LTC is seeing a spike in address activity and whale transactions, with metrics at highest levels since June.

    The total crypto market is down 1.5% in the past 24 hours to $1.3 trillion, with Bitcoin hovering just above $34,000. Meanwhile, most altcoins are struggling to hold onto recent gains. 

    But as market observers and analysts put it, the overall outlook is bullish for crypto ahead of what could be a massive bull market in 2024. Could this be the same scenario for Litecoin price?

    Litecoin price outlook- what’s next for LTC?

    Litecoin’s 24-hour price was down 3%, with recent gains trimmed to about 7% over the past week as it traded around $67.80. The psychological $100 continues to prove a difficult hurdle for bulls, despite there being a burst of on-chain activity.

    While address activity and whales both hit June 2023 levels, there has been the observation of dormant LTC suddenly spiking – “usually indicative of more coins beginning to circulate,” the market intelligence platform Santiment wrote in a post on X.   

    The overall bullish picture for Bitcoin suggests investors could be positioning for a potential uptick in its price. Optimism over factors such as spot Bitcoin ETF approval could help LTC rebound past the main supply wall.

    Yet, with dormant coins on the move again, sell-off pressure could be huge in the short term. In this case, a correction could see Litecoin price retreat further, bears likely targeting key support zones in the $60-50 region.


    Source link

  • Bitcoin supply on exchanges the lowest since 2017, but why? On-chain report

    Bitcoin supply on exchanges the lowest since 2017, but why? On-chain report

    Key Takeaways

    • 11.8% of the Bitcoin supply is currently on exchanges, the lowest mark since 2017
    • Supply of Bitcoin on exchanges has been consistently falling since March 2020, when crypto bottomed ahead of the explosive pandemic bull run
    • Originally, people pulled Bitcoin to participate in vibrant crypto ecosystem, with high volumes and activity and much scope for yield
    • Today, volumes and interest have fallen, but pattern of Bitcoin fleeing exchanges has continued, albeit for different reasons
    • Bitcoins leaving exchanges in recent months are likely due to fears over security and transparency, heightened after FTX collapsed

    “Not your keys, not your coins”. 

    One of the oldest sayings in crypto. And after a year that saw one of the biggest exchanges around shockingly gamble away customer assets in secret, many will wish they had paid it more attention. 

    Now, people are listening. Although in truth, this has been happening all throughout the pandemic. The balance of bitcoins on exchanges is now down to 2.27 million – that is the lowest mark since March 2018, a month which saw “God’s Plan” by Drake being played on the radio over and over and over and over again. 

    The mark is even lower when compared to the overall supply. There is currently 11.8% of the Bitcoin supply on exchanges. This is the lowest mark since December 2017. 

    Crypto fans will remember December 2017 as the month that Bitcoin went absolutely bananas. I remember exactly where I was when I saw that Bitcoin had breached the $20,000 mark for the first time; it felt like a seminal moment. 

    It marked the top, incidentally, with the orange coin at $7,500 seven weeks later. Within a year, it wasn’t far above $3,000. It was a long and barren bear market with fortunes not turning around until COVID hit in 2020. 

    Where is the Bitcoin going?

    I say “not your keys, not your coins”, but this isn’t the only thing driving the movement of coins off exchanges. 

    As the above charts show, the Bitcoin supply on exchanges has been coming down since March 2020. This is also the month that COVID kicked off. Since I’ve been in crypto, I also believe it was the scariest time of all – Bitcoin plunged from close to $10,000 to $5,000 in a gruesome 48 hour stretch as markets around the world tried to figure out what exactly this COVID-19 thing was. 

    But after this, the bull market kicked into gear. So, why has Bitcoin on exchanges been falling throughout this period?

    The truth is, ironically, that it could be for the exact opposite of the matra behind “not your keys, not your coins”, at least in part. This is due to the rise of crypto lending platforms during the bull run – firms like Celsius, BlockFi, Voyager Digital and so on.

    These platforms offered a nice yield on Bitcoin, and this attracted billions of dollars of inflows. Now, you may notice one thing about those names: today, they are all bankrupt. Which means that, obviously, coins currently leaving exchanges in recent months are for other reasons. 

    So there could be a dual explanation here: during the bull run, coins were leaving exchanges for yield on centralised platforms. Or they were leaving exchanges for DEXs, or other destinations. Crypto was booming at this time; there were no shortage of things to do or yield to earn. 

    Today, however, volumes have been decimated. Looking at total value locked within DeFi, it is down to $50 billion, having been up to $180 billion in December 2021. That is a fall of 72%. Simply put, prices are down, volumes are down and interest in general is down. 

    This fallen volume and interest have likely reduced the pull of Bitcoin off exchanges. But this drop may have been replaced by people pulling Bitcoin at a similar rate, but for an entirely different reason: to be secure, and to send to cold storage. You can thank Sam and the various other scandals for this. 

    Source link

  • Bitcoin on-chain metrics are now bullish: Bitfinex

    Bitcoin on-chain metrics are now bullish: Bitfinex

    • Bitfinex market report points to bullish metrics for BTC
    • Supply in Profit, Bitcoin Realised HODL (RHODL) Multiple and Reserve Risk ratio are all flashing green.
    • Bitcoin has traded to above $23k again after slipping on Monday following broader market reaction to economic news.

    Bitcoin is trading around $23,360 at the time of writing, about 2.4% up in the past 24 hours as cryptocurrencies flash green on Tuesday amid an improving market sentiment.

    For the world’s leading cryptocurrency by market cap, it appears on-chain metrics are ticking further north to suggest a strengthening bullish case.

    Supply in Profit up 20%, points to buy signal

    According to analysts at Bitfinex, one of Bitcoin’s on-chain metrics suggesting fresh upside momentum is likely the Supply in Profit indicator. Data shows bulls look to have successfully absorbed selling pressure as short-term and some long-term HODLers turn profitable.

    An observation of the metric on the 90-day time frame highlights a 20% jump for the “supply in profit” chart in January 2023, the analysts wrote in the report released on Monday.

    This implies that larger and longer-term investors currently hold profitable on-paper spot positions. This is healthy for the latter half of a bear market as a sustained 30-day uptrend after an extensive downtrend on this indicator has historically provided a good buy signal for the following two years,” the Bitfinex team noted.

    As far as markets are concerned, the above scenario doesn’t mean that the crypto market is set for an “up-only” move. However, the outlook does suggest bulls have an upper hand in the spot markets, a scenario that’s historically reflective of “late bear and early bull markets.”

    The Bitcoin Realised HODL (RHODL) Multiple, historically also bullish, has also been in an uptrend. According to data, the RHODL Multiple has remained positive over a 90-day window, to also suggest profitability for HODLers.

    Key metrics suggest a 10x jump for BTC price

    Apart from the 90-day EMA, other technical indicators flipping green include the net adjusted Spent Output Profit Ratio. Per on-chain data, the indicator is currently above one, which suggests that net sales across the Bitcoin market are profitable.

    Also, the Realised Profit to Losses (RPLR) ratio is above zero, which also confirms the profitable selling observed in past few weeks. The metric is currently moving towards 0.2, a reading comparable to the RPLR measure when Bitcoin price fell to lows of $3,600 in 2019. After the RPLR hit 0.2, BTC price flipped green and rallied 19x, hitting its all-time high in November 2021.

    Bitcoin Realized Profit Loss Ratio chart by Glassnode

    With the metric approaching this ratio when Bitcoin fell to lows of $16,000, the possibility of another 10x rally could see BTC target highs of $160,000 over the next two-three years.

    Bitcoin’s reserve risk ratio suggests HODLer conviction is high

    Looking at a longer time frame, Bitcoin’s on-chain metrics are also pointing to a bullish outlook. One odf these technical indicators is the Reserve Risk ratio.

    According to on-chain analytics platform Glassnode, Bitcoin’s reserve risk ratio has fallen to its all-time low. This puts the metric lower than when markets bottomed in 2019 or 2020, Bitfinex analysts pointed out.

    As the ratio is a cyclical oscillator that highlights price vs. HODLer conviction, with incentive to sell factored against opportunity cost, a very low ratio translates to a higher conviction among investors.

    A positive outlook for Bitcoin is also seen in the Market Value Realised Value (MVRV) ratio, which has recovered and has often coincided with historically bullish returns.


    Source link

  • Normalcy returning to crypto markets, on-chain data shows

    Normalcy returning to crypto markets, on-chain data shows

    Over the last few months, the crypto market has largely been pretty serene. Bitcoin had been in crab motion around $20,000 for quite a while, as it plodded along while waiting for the wider macro conditions to make a move.

    I wrote in late October to be cautious around this price action, and that Bitcoin could be one bearish event away from an aggressive downward wick. What I did not except was that event to be shake crypto to its bones, as one of the blue-chip companies in the space, FTX, inexplicably descended into insolvency.  

    This obviously shook markets. Last week I assessed how the flow of bitcoins out of exchanges has been fierce, as people’s trust in these central entities to store their coins was understandably at an all-time low. 

    In fact, I saw yesterday that 200,000 bitcoins have left exchanges since the FTX implosion. But now, the data suggests that the market is calming down a bit. And again, it seems like we may enter crab mode until macro provides an impetus one way or another – or an unexpected crypto-specific development comes out of the woodwork. 

    The first way to demonstrate that the dust is beginning to settle is by looking at Bitcoin’s volatility. This obviously spiked as Sam Bankman-Fried’s “games” were revealed to the public. But after remaining elevated throughout the last few weeks, it has fallen back down to more standard levels in the last few days.  

    Another way to view this is the falloff in large transactions. These transactions (defined as greater than $100,000) jumped up in the few days around the bankruptcy, but have fallen gradually since, back to the same levels we have seen throughout much of 2022.

    Another useful metric to track is the net realised profit or loss of moved coins. This spikes in times of crisis as the price abruptly drops, before typically coming back towards the $0 mark as the markets calm down.

    The below chart shows this well, with trades on November 9th netting an ugly $2 billion loss, before November 18th then topped this with a $4.3 billion loss. That is lower than the worst mark post-Celsius crash ($4.2 billion loss) and Luna ($2.5 billion loss).

    This reflects the continued downward pressure on Bitcoin’s price, but the trend has bounced back up to close to zero again.

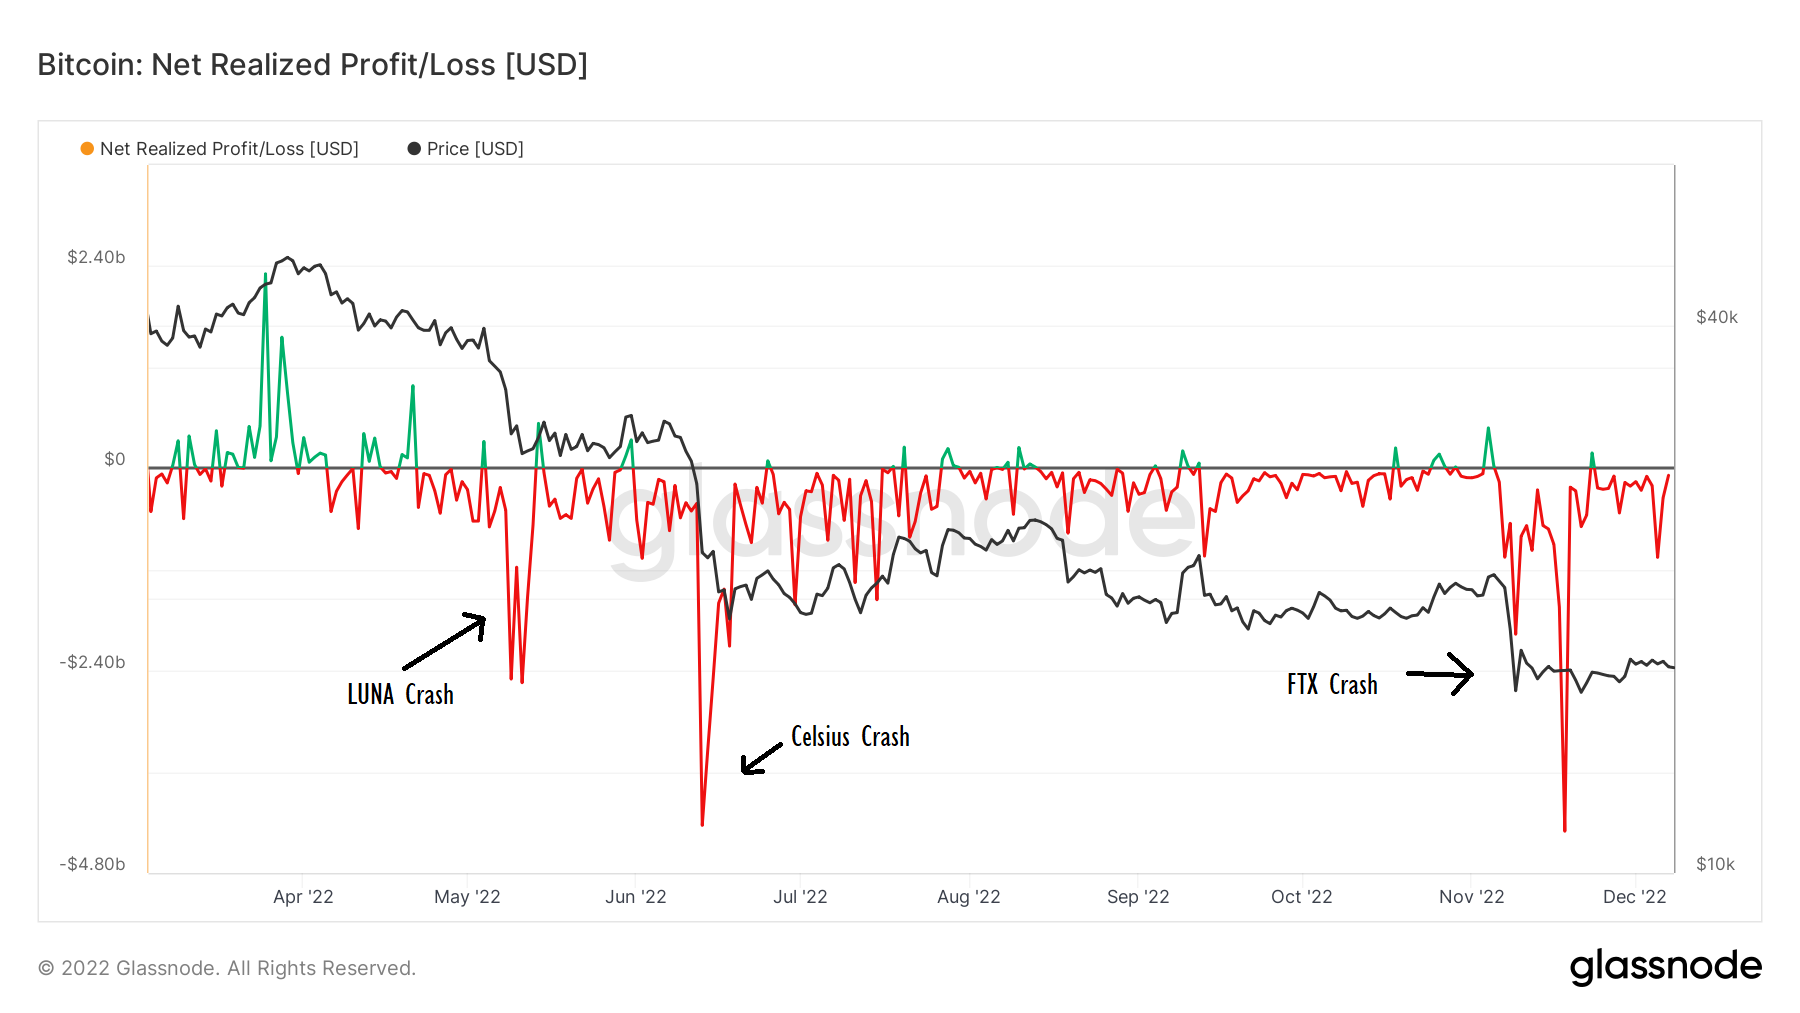
    FTX was a central part of the ecosystem, and its bankruptcy understandably rocked the market. As I wrote recently, this contagion is not over.

    Yet data from the last week or so suggests that normalcy is returning to the crypto markets. Going forward, it may tread water again for a while. With China opening up post-lockdown, the latest inflation numbers imminent and the EU ban on Russian crude imports, macro certainly has a lot going on. 

    Crypto investors will just need to hope that the crypto-native scandals are out of the way for the time being.  

    Source link

  • This analyst relies on on-chain metrics to support a Bitcoin price (BTC/USD) rally

    This analyst relies on on-chain metrics to support a Bitcoin price (BTC/USD) rally

    • Bitcoin rose to $17,000 on Monday.

    • InvestAnswers thinks BTC is about to become bullish based on realised value.

    • The token faces resistance at $19,000 and 50-day MA.

    Bitcoin price (BTC/USD) was up marginally on Monday as most cryptocurrencies made slight recoveries. BTC was back to $17,000 even as data by crypto derivatives exchange Deribit showed that sentiment had shifted in favour of the cryptocurrency. But as this happens, a popular crypto analyst is projecting a rally.

    InvestAnswers, a popular crypto analyst, says that on-chain signals suggest BTC is overdue for a rally. The pseudonymous analyst examines Bitcoin’s realised price or RP metrics in making the argument. Normally, RP posts the value of all BTC at the price the tokens were bought and then divides it by the number in circulation. InvestAnswers says that BTC never stays below the RP for long. 

    The analyst says BTC has been under RP for 170 days. In 2020, BTC stayed below the RP for 8 days, while in 2018, it was 115 days. In 2015, it stayed a little longer at 240 days and only 110 days in 2011. According to the analyst, the RP of BTC lies at $21,000. Using the analogy, he says that the Bitcoin price is about to soar.

    Besides the RP, InvestAnswers says that the rising weakness in the US dollar index suggests a likely rally. The index is inversely correlated to the risk-on assets, meaning that if it goes lower, cryptocurrencies go the other way.

    BTC price analysis and outlook amid slight recoveries

    BTC/USD Chart by TradingView

    BTC trades above the 20-day moving average. Bulls have been winning the war at $16,000, although the bears are still relentless. The RSI remains below the midpoint, and the bullish momentum looks somewhat weak but improving.

    Bulls will have the next test at the 50-day MA and the $19,000 resistance.

    Should you buy BTC?

    BTC is still largely bearish. However, all indications are buyers looking for the next opportune moment. In the meantime, BTC’s eyes $19,000 and a recovery past the level could usher in more upsides.

    Where to buy BTC

    eToro

    eToro offers a wide range of cryptos, such as Bitcoin, XRP and others, alongside crypto/fiat and crypto/crypto pairs. eToro users can connect with, learn from, and copy or get copied by other users.


    Buy BTC with eToro today

    Bitstamp

    Bitstamp is a leading cryptocurrency exchange which offers trading in fiat currencies or popular cryptocurrencies.

    Bitstamp is a fully regulated company which offers users an intuitive interface, a high degree of security for your digital assets, excellent customer support and multiple withdrawal methods.


    Buy BTC with Bitstamp today

    Source link