
- Bitcoin has suffered its worst weekly percentage loss since the collapse of FTX.
- Some of the factors behind the dip include reports of SpaceX selling its BTC holdings and the Chinese property giant Evergrande bankruptcy filing.
- Top prediction markets tokens have maintained a bullish trend amid the crypto meltdown.
In what has caught most crypto investors by surprise, the price of Bitcoin (BTC) has decreased by 11.2% to about US$26k. Last week has been the worst week for Bitcoin (BTC) since FTX’s demise in November 2022.
The market crash has not only affected BTC, seeing that the rest of the asset class has not fared any better. Ethereum (ETH) fell by approximately 9.5% to $1.7K and Binance-coin (BNB) dropped by about 9.8% to $217, just to mention a few of the top cryptocurrencies by market capitalization.
While most of the top cryptocurrencies experienced a price dip, popular prediction markets tokens like Gnosis (GNO), SX Network (SX), Kleros (PNK), and Augur (REP) registered significant gains. Chancer (CHANCER), a new prediction markets token is also gaining traction as its token presale continues to gain traction.
What caused the crypto market to drop?
The price decrease was caused by a number of causes. They included speculation that SpaceX wrote down the value of its Bitcoin assets, the collapse of the Chinese real estate firm Evergrande, and rising yields in the US.
SpaceX Bitcoin holdings
The Wall Street Journal published a report late last week stating that Elon Musk’s space exploration company SpaceX marked down the value of the Bitcoin it had on its books by US$373 million for the years 2022 and 2021. The report claims that the business also sold a portion of the BTC it had at one point over the previous two years. The WSJ has identified documents that it claims offer uncommon insights into the business’s finances.
However, the WSJ’s assertions cannot be independently verified because SpaceX is a privately held corporation. Musk acknowledged that SpaceX did acquire Bitcoin during a panel appearance in 2021, but it is unclear how much or when the commodity was purchased.
Evergrande bankruptcy
In a disclosure made over the weekend, the Chinese real estate tycoon Evergrande filed for bankruptcy protection in the United States. The corporation reportedly took action to secure its assets while still trying to control its creditors.
Before proposing a comprehensive off-shore debt restructuring program in 2021, Evergrande experienced a public meltdown and went into default on its obligations. The business currently seems to be on life support.
Investors are worried that China’s enormous real estate market may become contagious. Country Gardens and other significant developers are not paying their debts either, and the industry—which is thought to account for up to 30% of Chinese GDP—is in serious need of government assistance.
US Treasury yields
US Treasury yields are skyrocketing and pushing away investors from risky markets like the crypto market and toward saving. As the US Federal Reserve gradually increased rates throughout the previous year to reach a target rate of slightly over 5%, bond yields increased.
As strong US economic data keeps coming out, yields have increased this week in anticipation that rate rises will continue. Since 2011, the 30-year US Treasury yield has never been higher. Treasury bonds give a high, secure yield, which is detracting from the value of other asset types like shares and cryptocurrencies.
Gnosis and Augur price prediction
Gnosis has risen by 0.2% while Augur has registered a 1% surge after a bear week. In the past seven days, Gnosis dropped by 8.8% while Augur fell by 11.7%.
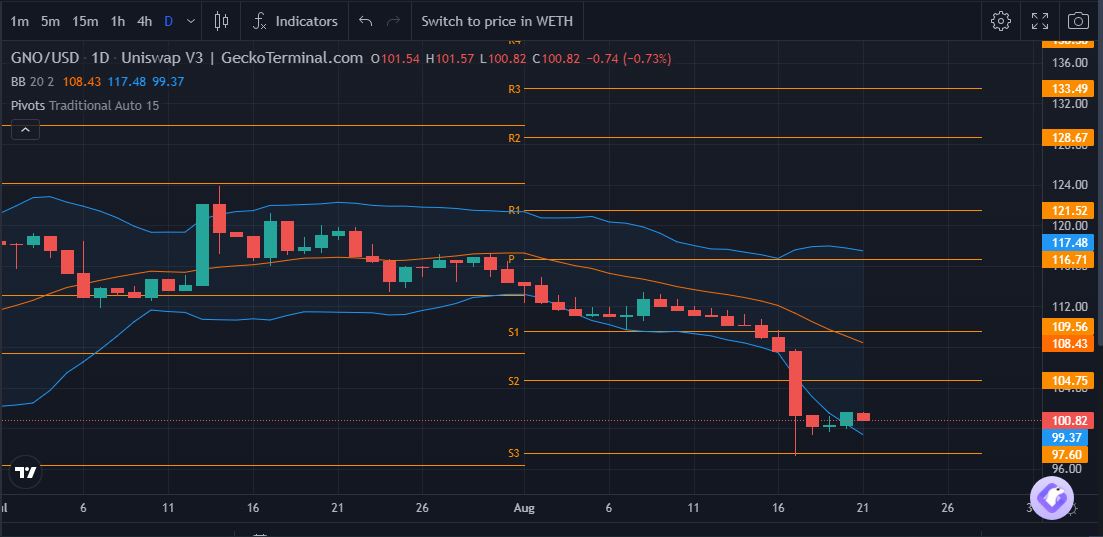 Gnosis price daily chart
Having bounced off the support at $97.60, the Gnosis (GNO) token is expected to test the resistance at $104.75. However, that depends on whether the current daily candlestick closes above the lower band line of the Bollinger Bands indicator.
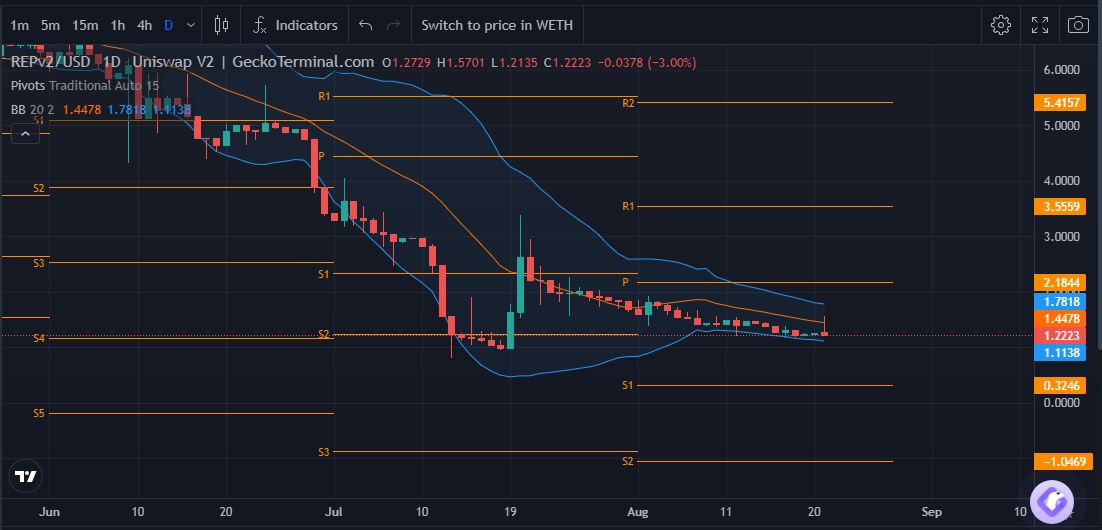 Augur price daily chart
Augur, on the other hand, seems to have slid into consolidation after erasing most of the gains it made between July 19 and July 20. All eyes are on the support at $0.3246 and the resistance at $2.1844. If the REP price jumps above the upper Bollinger Bands line, it could test the $2.1844 resistance level and if it drops below the lower Bollinger Bands line, it could drop to the support at $0.3246.
The prediction markets tokens including Chancer, are expected to experience significant price gains as popular games including the English Premier League and the American MSL gather steam.