Tag: pattern

  • Kaspa price climbs 10% on Layer 2 rollout, forms double-bottom pattern

    Kaspa price climbs 10% on Layer 2 rollout, forms double-bottom pattern

    Kaspa Price Bullish

    • KAS price is up 10% in 24 hours as Kaspa mirrors other altcoins’ gains.
    • The cryptocurrency is also surging after seeing a double-bottom bounce with support near $0.05.
    • Bulls could breach resistance around $0.12 and target the $0.18-$0.20 supply zone.

    The Kaspa price has surged by 10% in the past 24 hours, reaching an intraday high of $0.105.

    Notably, this has added to weekly gains of over 18% as Kaspa rides the bullish momentum, with top cryptocurrencies Ethereum, XRP, and Solana seeing notable gains.

    BNB price has jumped to near its all-time high and could eye $1,000.

    As these top altcoins eye key technical levels, Kaspa’s upward momentum is drawing significant attention. Both market dynamics and upcoming network developments suggest bulls may not be done yet.

    Why is Kaspa price up today?

    Kaspa’s price increase aligns with a robust altcoin market.

    ETH, XRP, SOL, and BNB are all climbing toward critical resistance zones or all-time highs, adding to buying pressure for small-cap cryptocurrencies.

    However, Kaspa’s rally is not solely tied to market-wide optimism.

    A key driver is the growing anticipation surrounding the Kasplex mainnet, a significant step forward for the Kaspa Network, which is renowned for its high-speed, proof-of-work blockDAG architecture.

    The Kasplex Layer 2 public testnet, dubbed Kasplex zkEVM, has officially launched, marking a pivotal milestone in Kaspa’s roadmap.

    This fully Ethereum Virtual Machine (EVM)-compatible rollup leverages Kaspa’s Layer 1 (L1) for decentralized sequencing and data availability.

    Kasplex zkEVM introduces several groundbreaking features. A full EVM equivalence allows developers to deploy Ethereum-native smart contracts with minimal adjustments.

    With bridged KAS as the native testnet token, the protocol also allows for integration with standard EVM wallets like MetaMask.

    Additionally, the testnet includes a live faucet, explorer, and expanding developer tooling, fostering an environment for building decentralized applications (dApps) and smart contracts on Kaspa.

    This development positions Kaspa as a unique proof-of-work blockchain with Layer 2 smart contract functionality.

    Its growth potential has sparked increased interest in the KAS token, contributing to its price surge.

    KAS price: technical outlook

    From a technical perspective, Kaspa’s price action is showing bullish signals. The KAS token has formed a double-bottom pattern, a classic reversal signal.

    It indicates strong support in the $0.05-$0.06 range.


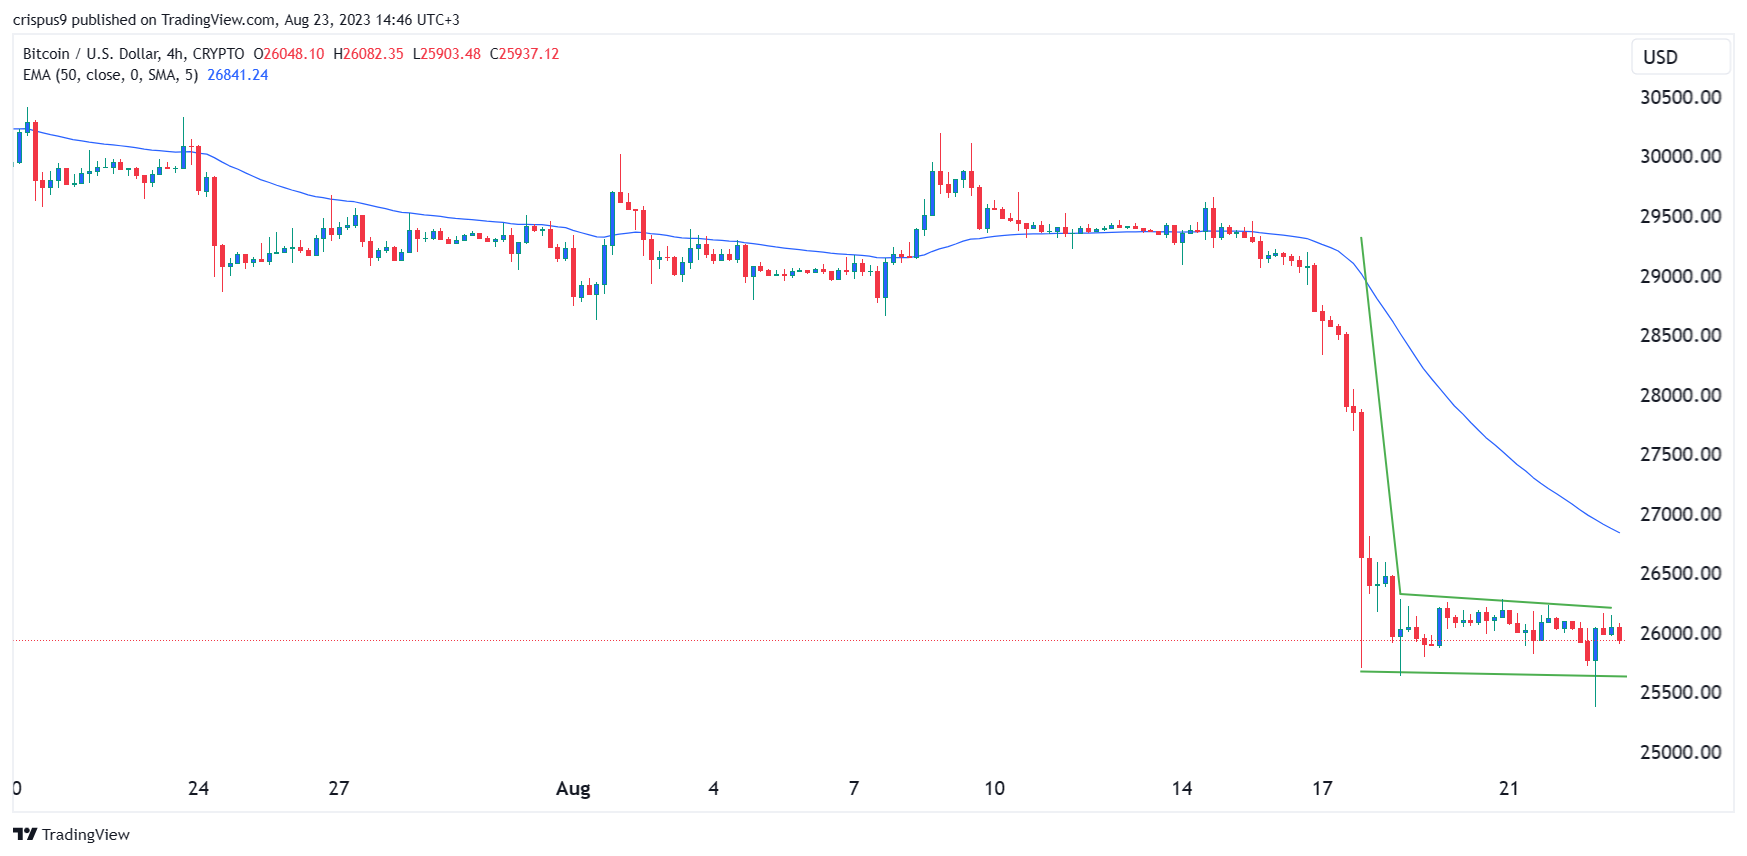
    Kaspa price chart by TradingView 

    This bounce has propelled the price toward a key resistance level near $0.12.

    According to the price outlook on the weekly chart, a decisive breakout above this level could open the door for buyers to target the $0.18-$0.20.

    The area might prove a crucial supply zone, with the level aligning with previous highs from July and December 2024.

    Source link

  • SUI price breakout? Technical pattern signals move toward $4.25

    SUI price breakout? Technical pattern signals move toward $4.25

    Sui Surges As Altcoins Tap Upside Momentum

    • SUI price gains as token continues upside with monthly gains of over 85%
    • The altcoin is rising as the overall crypto market bounces amid gains for Bitcoin.
    • Crypto analyst Captain Faibik shared a SUI price prediction suggesting a surge to $4.25.

    Sui price is up 12% in the past week, with the altcoin rising as Bitcoin spikes to near $100k.

    With equities also on the up after US President Donald Trump announced a trade deal with the United Kingdom, BTC looks poised for further gains.

    A leg up for the altcoin market amid this scenario could tie into Sui’s latest pump.

    One crypto analyst forecasts Sui price could rally to above $4 with a key technical pattern breakout.

    Gains see Sui ecosystem tokens rise

    The Sui ecosystem tokens have seen their total market capitalization jump by more than 6% in the past 24 hours to above $29 billion.

    While most of this is in the SUI network’s native token at $12 billion, a lot of the top ecosystem tokens are registering notable gains.

    Bonk (BONK), Walrus (WAL), and DeepBook Protocol (DEEP) prices have increased 10%, 9%, and 12%, respectively, in the last 24 hours.

    The three tokens’ market cap values stood at over $1.4 billion, $800 million, and $596 million, respectively.

    Is Sui price set for a rally above $4?

    The gains for Sui and the ecosystem tokens mirror broader market performance this week, with bulls looking to take control amid macroeconomic and regulatory catalysts.

    In this respect, crypto analyst Captain Faibik has shared a bullish price prediction for SUI.

    According to the analyst, who shared the outlook via X, the layer blockchain network’s native token could spike to $4.25.

    He based his forecast on the technical chart for Sui, which shows a breakout from a channel pattern.

    The analyst’s 4-hour chart shows the SUI/USD pair breaking above the upper trendline.

    Currently, SUI price hovers near at $3.79, up nearly 12%, and with a 24-hour volume of $2.18 billion.

    The altcoin changed hands at $3.24 during the Asian session on Thursday, and a surge to above $4 will see buyers flip focus to the all-time high of $5.35 reached on January 6, 2025.

    From the current level, this will be a 29% increase.

    Notably, SUI is up more than 85% in the past month, having jumped from lows of $2.03 on April 16, 2025.

    While the broader risk asset market may yet hit macroeconomic headwinds, the current outlook suggests bulls may have an upper hand.

    Sui’s traction as the blockchain network for digital asset ownership helps this outlook.

    Headwinds will, however, stall upside momentum, likely exacerbated by profit-taking deals.


    Source link

  • A very dangerous pattern is forming

    A very dangerous pattern is forming

    Bitcoin price remained in a tight range this week as concerns about the industry continued. The BTC/USD pair was trading at 26,000, where it has been in the past few days. Similarly, the BTC/GBP was stuck at 20,522, which was much higher than last Friday’s low of 19,762.

    Bitcoin flash crash 

    Bitcoin and other cryptocurrencies continued plunging last week as concerns about the industry rose. As it dropped, Bitcoin moved below the important support at $28,300, where it failed to move below in July.

    There are numerous reasons for the crash. Technically speaking, Bitcoin formed a double-top pattern, which is one of the most accurate bearish signs in the market. 

    At the same time, analysts cite the performance in the derivatives market. Data compiled by CoinGlass showed that open interest worth over $2.5 billion was cleared in a few hours.

    This perforance is notable since implied volatility in the options market had crashed to an all-time low earlier tis month. This volatility has now somewhat recovered following the recent plunged. 

    As shown below, cumulative volume delta (CVD) has been in the green in the past few days. Weighted open interest has risen while aggregated liquidations have remained substantially low.

    Looking ahead, the next likely catalyst for Bitcoin price will be the upcoming meeting at Jackson Hole in Wyoming. This is an annual meeting of central bank officials from around the world. Jerome Powell and other officials will talk about the current state of the economy and the potential actions.

    Bitcoin price forecast 

    The 4H chart shows that the BTC/USD pair has been in a strong bearish trend in the past few months. The chart shows that Bitcoin has moved below the 50-period and 25-period exponential moving averages (EMA).

    Most importantly, Bitcoin price has formed a bearish flag pattern. In price action analysis, this pattern is usually a bearish sign. Therefore, there is a likelihood that Bitcoin price will have a bearish breakout in the coming days, with the next level to watch being at $25,000.

    How to buy Bitcoin

    Skilling EU

    Skilling is a regulated Forex and CFD broker that allows traders to access 800+ financial instruments, including 10 popular cryptocurrency CFDs with competitive pricing and fast execution time. Skilling offers a selection of trading platforms, including the proprietary Skilling Trader and popular, industry renown cTrader and MetaTrader 4 platforms, which can suit the needs of customers with different levels of trading experience.

    eToro

    eToro is a multi-asset investment platform with more than 2000 assets, including stocks, ETF’s, indices, commodities and Cryptoassets. eToro offers over 60+ Cryptoassets to invest or invest in their CryptoPortfolio where investors can benefit from the accumulated growth of Bitcoin, Ethereum, XRP, Litecoin and other leading cryptocurrencies. eToro users can connect with, learn from, and copy or get copied by other users.

    Source link

  • Why is Ethereum being outperformed by Bitcoin? Historical pattern changing in 2023

    Why is Ethereum being outperformed by Bitcoin? Historical pattern changing in 2023

    Key Takeaways

    • Ethereum has historically outperformed Bitcoin in bull runs
    • The pattern has flipped to start the year, with Bitcoin dominance rising 
    • Our Analyst Dan Ashmore jumps on-chain to look through history, and show how and why the pattern is changing

    The Flippening, huh? Nothing incites debate within crypto circles quite like it. 

    Referring to a scenario where Ethereum flips Bitcoin for the number one spot in the cryptocurrency ranks, the Flippening is anything from inevitable to delusional, depending on who you ask. 

    I’m not sure I want to walk across the eggshells of that debate, for fear of my Twitter DMs, but I noticed something pretty interesting today when digging into the data on Ethereum vs Bitcoin. 

    Ethereum is strongly correlated with Bitcoin

    Firstly, the obvious. Ethereum is incredibly correlated with Bitcoin because, well, it is a cryptocurrency, and every crypto’s fate is tied to that of the orange coin. We know this by now. 

    The graph below shows how tight this relationship has been since Ethereum went live back in 2015. 

    But while these two best buddies follow each other around across the price charts, there are scenarios where they diverge a little bit. The famous ETH/BTC ratio is one which Ether fans in particular keep a keen eye on. 

    It peaked in June 2017 at close to 0.15 before freefalling down to 0.025 before the end of the year. Today, it trades at around 0.07. 

    Ether is better at bull markets than Bitcoin

    You may have noticed that the previous ETH/BTC chart resembled the shape of the crypto market overall, through its many ups and downs. 

    I plotted the price of Bitcoin against this ETH/BTC ratio. Indeed, the ratio rises as Bitcoin rises, and falls and Bitcoin falls. Using the Bitcoin price as a proxy for the whole industry, this suggests that the ETH/BTC ratio rises in bull markets and falls in bear markets. 

    This makes sense. Bitcoin is often referred to as the boomer coin. I quite like it that way, despite it being meant as an insult, by the way. But it’s an understandable moniker because Bitcoin does move like a pensioner during bull markets when compared to altcoins. 

    Ether may be the largest of the altcoins, but it still outperforms Bitcoin when the bulls are out to play. 

    On the flip side, Bitcoin outperforms when the party ends. And by outperform, I mean that it tends to drop 60% as opposed to 70%. But hey, that’s for another day.

    Pattern has flipped in 2023

    But the price charts are showing something different. One month into the new year, Bitcoin has surged while the ETH/BTC ratio has fallen – precisely the opposite of what has happened historically. 

    I charted the ratio back to the start of November, when Sam Bankman-Fried’s fun and games were revealed to the world and crypto fell, with Bitcoin cratering down to $16,000. 

    The chart shows that the pattern remained as you would expect, i.e. the ratio fell as crypto and Bitcoin pulled back. But as we turned the page into 2023, the crypto market flipped and Bitcoin soared. Only problem is, ETH didn’t follow, but rather the ratio has fallen, from 0.077 on January 11th to 0.068 currently, despite Bitcoin spiking from $17,400 to close to $23,000 over the same period. 

    Why? Honestly, I’m not sure. It’s unusual. 

    Bitcoin is up 36% on the year whereas Ether is only up 29%. Yet looking at the returns of other altcoins, perhaps it is nothing to do with Ether. Many are being outperformed by Bitcoin, while even the outperformers are not doing so by as much as has been seen previously (note I have removed Solana for scale purposes, which is up 125% thus far this year, following being decimated by links to Sam Bankman-Fried and multiple projects fleeing the blockchain at the end of last year). 

    In truth, this has just been a remarkable rise for Bitcoin from the depths of bear market pain. The rest of the market is not quite ready to forget the armageddon that was 2022, with many altcoins paring down over 90%. 

    Ethereum wasn’t quite as bad, but still fell from an all-time high of nearly $5,000. The free money and stimulus packages of the pandemic are over. It is a different climate now, and it is proving more challenging to kick up hype for altcoins. 

    The web3 narrative has faltered. NFTs have been crushed. There is no doubt that the narrative around ETH has been torn down. I have written about how institutional adoption will pare back in crypto, and how the sector’s reputation will take a long time to fix.

    That is true for Bitcoin. Perhaps it rings even more true for ETH and altcoins, which have even more to do to regain investors’ trust. 

    Source link

  • pattern points to a comeback

    pattern points to a comeback

    • Bitcoin price has retreated after the Fed decision.

    • The Fed decided to hike rates by 50 basis points.

    • The inverted head & shoulders pattern points to more upside.

    Bitcoin price pulled back on Thursday as the market reflected on the latest interest rate decision by the Federal Reserve. After soaring to $18,378 on Wednesday, Bitcoin retreated by 4% to $17,673. It is still substantially higher than the year-to-date low of $15,470.

    Central banks downshift

    The BTC/USD, BTC/GBP, and BTC/EUR prices declined slightly after central banks started to downshift their policies. On Wednesday, the Federal Reserve decided to hike interest rates by 0.50%, which was lower than the last four hikes of 0.75%.

    And on Thursday, other influential central banks decided to lower the size of their rate increases. In the UK, the Bank of England (BoE) decided to hike rates by 0.50%, which was lower than the previous increase of 0.75%. The same happened in the European Union, where the European Central Bank (ECB) increased by 0.50%.

    Federal Reserve decision

    Bitcoin’s main catalyst was the Fed statement. In it, the bank sounded more hawkish and hinted that it will continue hiking in 2023. Precisely, it guided that it will deliver another 0.75% hike in 2023 before hitting a pause. 

    As such, it will likely hike interest rates by 0.50% in February following another 0.25% in March. Alternatively, it could deliver three 25 basis point increases, as we wrote in this article.

    Still, I believe that the Fed was concerned about the falling bond yields and the signal they were sending. In the past few weeks, bond yields and mortgage rates have been falling. As such, the trend could spur more inflation in the coming months.

    Bitcoin also reacted to the latest outflows from key exchanges, which is a signal that many investors are afraid of the industry. This is confirmed by the fear and greed index, which has dropped to 24. Binance has seen outflows worth $5.2 billion in the past 7 days.

    Bitcoin price prediction

    BTC/USD chart by TradingView

    The 4H chart shows that the BTC price formed a bearish engulfing pattern on Wednesday. In price action analysis, this pattern is usually a bearish sign. A closer look shows that the coin formed an inverted head and shoulders pattern. The neckline of this pattern is at $17,437.

    Therefore, I suspect that Bitcoin will form a break-and-retest pattern, which is a bullish sign. If this happens, it will likely resume the bullish trend as investors digest the latest decision. A such, the coin will likely rise to a high of $19,000.

    How to buy Bitcoin

    eToro

    eToro offers a wide range of cryptos, such as Bitcoin, XRP and others, alongside crypto/fiat and crypto/crypto pairs. eToro users can connect with, learn from, and copy or get copied by other users.


    Buy BTC with eToro today

    Bitstamp

    Bitstamp is a leading cryptocurrency exchange which offers trading in fiat currencies or popular cryptocurrencies.

    Bitstamp is a fully regulated company which offers users an intuitive interface, a high degree of security for your digital assets, excellent customer support and multiple withdrawal methods.


    Buy BTC with Bitstamp today

    Source link

  • Bitcoin (BTC/USD) choppy pattern continues. Here is why the next breakout could be catastrophic

    Bitcoin (BTC/USD) choppy pattern continues. Here is why the next breakout could be catastrophic

    Since breaking below $19,000, Bitcoin (BTC/USD) has been unable to recover to the crucial psychological level. As of press time, the cryptocurrency trades slightly above $16,000, the level it bottomed at post-FTX collapse. It’s nearly two weeks now, and the price of BTC has been consolidating at this yearly low. Can it recover in the next few days?

    It is hard to tell if BTC will find a bullish footing as crypto sentiment remains weak. Besides the FTX-inspired crash, BTC remains a key barometer of global economic health. Central banks are tightening the belts with rate increases to tame high inflation. With the situation looking gloomy, it could take a while before we find the right balance to take BTC higher. 

    Once again, BTC’s decline below $19,000 indicated its bottom still needs to be found. Is $16,000 the likely bottom, or could we see a further decline below this level? A potential breakout is imminent that could help answer the question. Let’s turn to the technical levels and price action:

    BTC eyes a potential bearish inside bar breakout at $16,000

    BTC/USD Chart by TradingView

    On the daily chart, BTC trades with weakening momentum at the support of $16,000. The MACD indicator shows a strong bear market for BTC. Multiple pin bars formed at the level, indicating indecision in the market.

    What’s likely to happen for BTC?

    Two possible scenarios are likely for the BTC price in the coming days. If bulls defend the $16,000 level successfully, it will set BTC for a recovery to $19,000. An improved market outlook or momentum will strengthen a bullish market. A bullish signal at the crucial support zone will be needed to confirm an upside. 

    On the flip side, Bitcoin could fall to $11,000 if bulls fail at the $16,000 level. This is a more likely outcome, given the weak momentum at the current BTC price. In the bear scenario, a bearish breakout of the inside bars formed at $16,000 will be confirmed. That will give bears control to take BTC lower.

    Where to buy BTC    

    eToro

    eToro offers a wide range of cryptos, such as Bitcoin, XRP and others, alongside crypto/fiat and crypto/crypto pairs. eToro users can connect with, learn from, and copy or get copied by other users.


    Buy BTC with eToro today

    Bitstamp

    Bitstamp is a leading cryptocurrency exchange which offers trading in fiat currencies or popular cryptocurrencies.

    Bitstamp is a fully regulated company which offers users an intuitive interface, a high degree of security for your digital assets, excellent customer support and multiple withdrawal methods.


    Buy BTC with Bitstamp today

    Source link

  • Is Solana sol facing a catastrophic breakout from an inside-bar pattern?

    Is Solana sol facing a catastrophic breakout from an inside-bar pattern?

    It’s an indecision moment as Solana trades at an oversold level of $13. The cryptocurrency has formed multiple pin bars at the level, indicating indecision in the market. A potential breakout to the downside could see SOL claim a single-digit price.

    CoinMarketCap data shows that SOL has lost more than 25% in a week. The loss is among the highest among the cryptocurrencies in the top 100 bracket. Concerns that the Solana ecosystem has a huge exposure to the collapsed FTX and Alameda have been fueling the bear market. Alameda is believed to hold 50.5 million SOL worth $708 million. Amid the exposure, Solana founder Anatoly Yakovenko has maintained that the investment is unaffected.

    SOL remains under the mercy of bears, who are increasingly active at the $13 price level. Here is the price outlook:

    SOL is under pressure at $13 even as the price hits oversold levels

    Technically, SOL is creating a support zone at $13. However, a likely bullish reversal looks unlikely as the token trades with weakening momentum. The formation of multiple inside bars at the crucial level suggests that buyers and sellers match the effort. 

    SOL/USD Chart by TradingView

    Turning to the RSI shows that SOL is oversold. An attempted recovery has been muted, with a further slip of the RSI reading to 29. The MACD indicator underlines a weak and worsening momentum.

    Which way is SOL?

    An inside-bar pattern can break on either side. An upside breakout will confirm a bullish reversal for SOL. However, a quick sell-off for SOL could occur if the breakout occurs to the downside. In such a case, the SOL price could touch $10 or below. 

    With the weak sentiment, a bearish breakout carries a higher chance. Investors should be cautious about buying SOL at this level.

    Where to buy SOL

    eToro

    eToro offers a wide range of cryptos, such as Bitcoin, XRP and others, alongside crypto/fiat and crypto/crypto pairs. eToro users can connect with, learn from, and copy or get copied by other users.


    Buy SOL with eToro today

    Binance

    Binance is one of the largest cryptocurrency exchanges in the world. It is better suited to more experienced investors and it offers a large number of cryptocurrencies to choose from, at over 600.

    Binance is also known for having low trading fees and a multiple of trading options that its users can benefit from, such as; peer-to-peer trading, margin trading and spot trading.


    Buy SOL with Binance today

    Source link