
- Sign (SIGN) price has jumped more than 80% amid multiple exchange listings, including on South Korea’s largest crypto exchange.
- Upbit plans to list SIGN trading pairs for Korean won, Bitcoin and Tether (USDT).
- Profit taking could derail Sign price momentum.
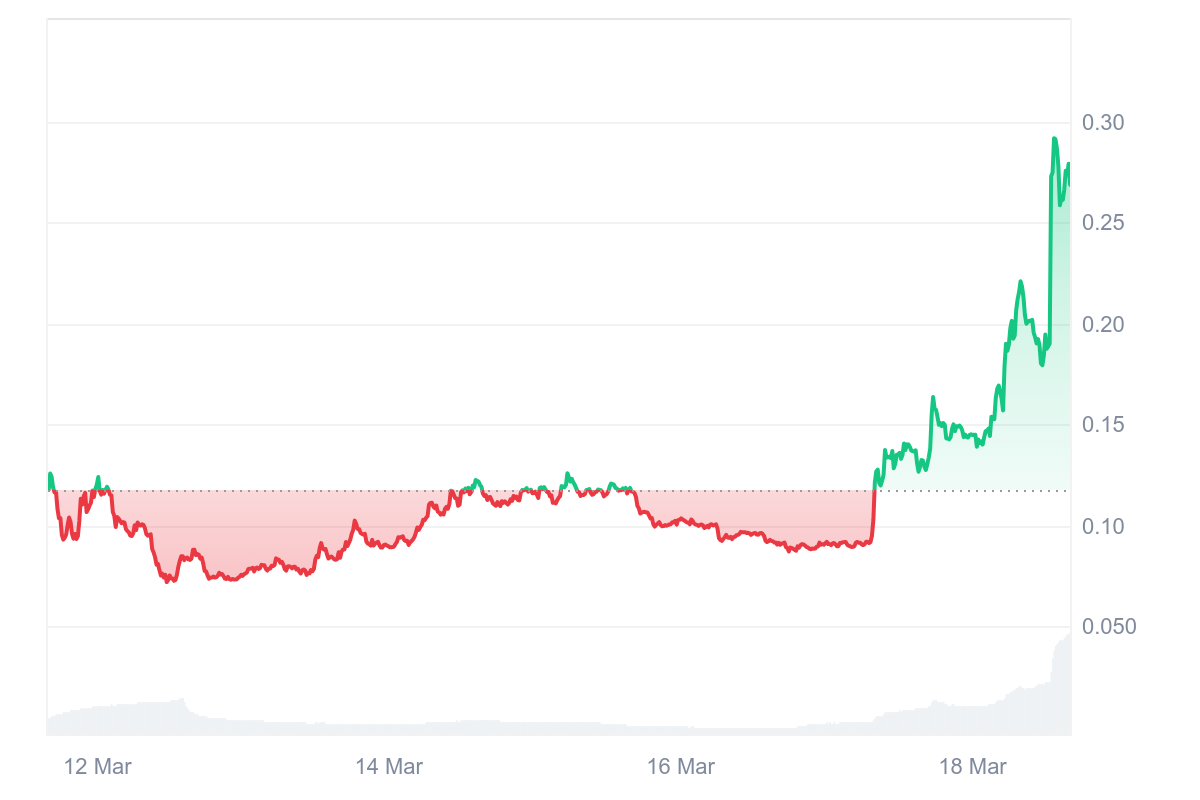
Sign (SIGN) is up more than 80% in the past 24 hours, skyrocketing as multiple exchanges and trading platforms list the token.
As of writing, the SIGN token traded near $0.13, up 85% and likely to rally further following its listing on Upbit, the largest cryptocurrency exchange in South Korea.
Market buzz as Sign surges
Sign is an omni-chain attestation protocol designed to power on-chain claims for identity, ownership, and credentials.
The Sign Protocol, which operates across multiple blockchains, aims to make attestation technology more accessible and user-friendly, embedding it into everyday digital interactions.
With services like Token Table for on-chain token distribution, EthSign for web3 signing, and the Sign Protocol for omni-chain attestation.
Meanwhile, the Sign (SIGN) token is the platform’s native token, used for gas fees, staking and airdrop rewards.
SIGN token’s remarkable price rally comes as Upbit, South Korea’s largest cryptocurrency exchange, announced the listing of the token.
It joins other platforms, including Bitget, Bitrue and Gate.io in adding support for the token.
신규 디지털 자산 사인(SIGN) 거래지원 안내
✅ 지원 마켓: KRW, BTC, USDT 마켓
📅 거래지원 개시 시점 : 추후 공지 예정🔗공지 바로가기:https://t.co/aXbkAJGAQB#Upbit #SIGN@ethsign pic.twitter.com/iFe88IcmGH
— Upbit Korea (@Official_Upbit) April 29, 2025
The hype amid these developments have seen Sign’s token price jump sharply.
Upbit plans to list SIGN with Korean won (KRW), Bitcoin (BTC), and Tether (USDT) trading pairs.
Upbit said in a notice that deposits/withdrawals will open three hours after the announcement.
However, the exchange did not provide an exact listing time for the token.
Why does Upbit listing matter?
South Korea is a major hub for crypto trading, and Upbit’s dominant position in the market has given SIGN a significant boost.
The exchange’s decision to support SIGN reflects growing confidence in the project’s potential, especially given the fact that South Korean investors have historically shown massive enthusiasm for digital assets. Its listing of the token could help push prices higher.
Notably, the trading volume of Sign (SIGN) has reached over $658 million, representing a staggering 1,462,136% increase in 24 hours.
CoinGecko analysts indicate the spike signals a sharp rise in sentiment and market activity.
Analysts are optimistic about its short-term trajectory, given the heightened trading volume and market interest.
Price discovery may see buyers extend beyond $0.13, with momentum continuation benefiting from overall market performance.
However, monitoring of whale activity could be key as is the fact that a reversal amid profit taking may be equally sharp and painful.