
- Crypto prices traded within a range last week as crypto takes is relegated to the back burner in the wake of economic uncertainties
- Exchange-traded fund (ETF) inflows were negative as Bitcoin ETFs logged net outflows of $62.9 million while Ethereum ETFs logged $8.9 million in outflows
Bitcoin
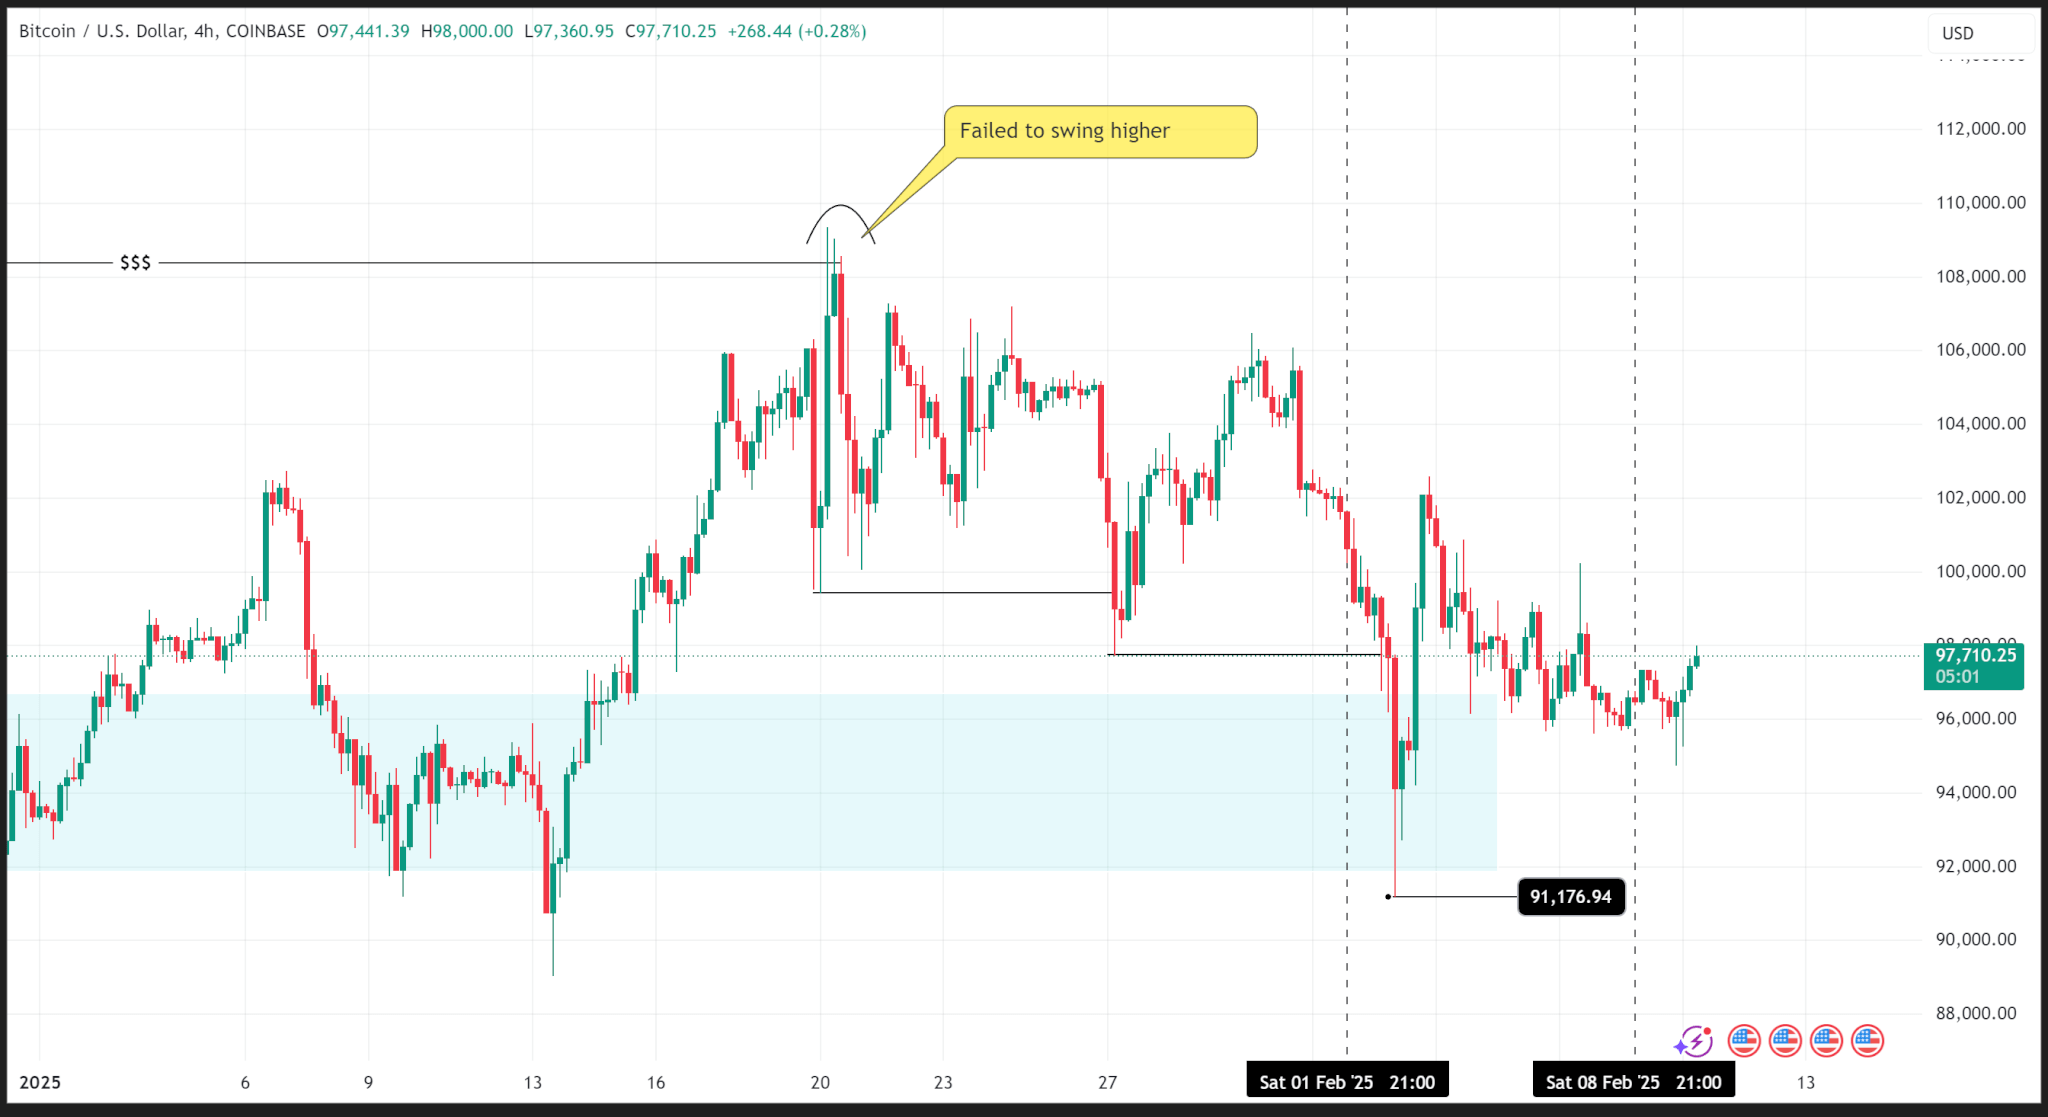
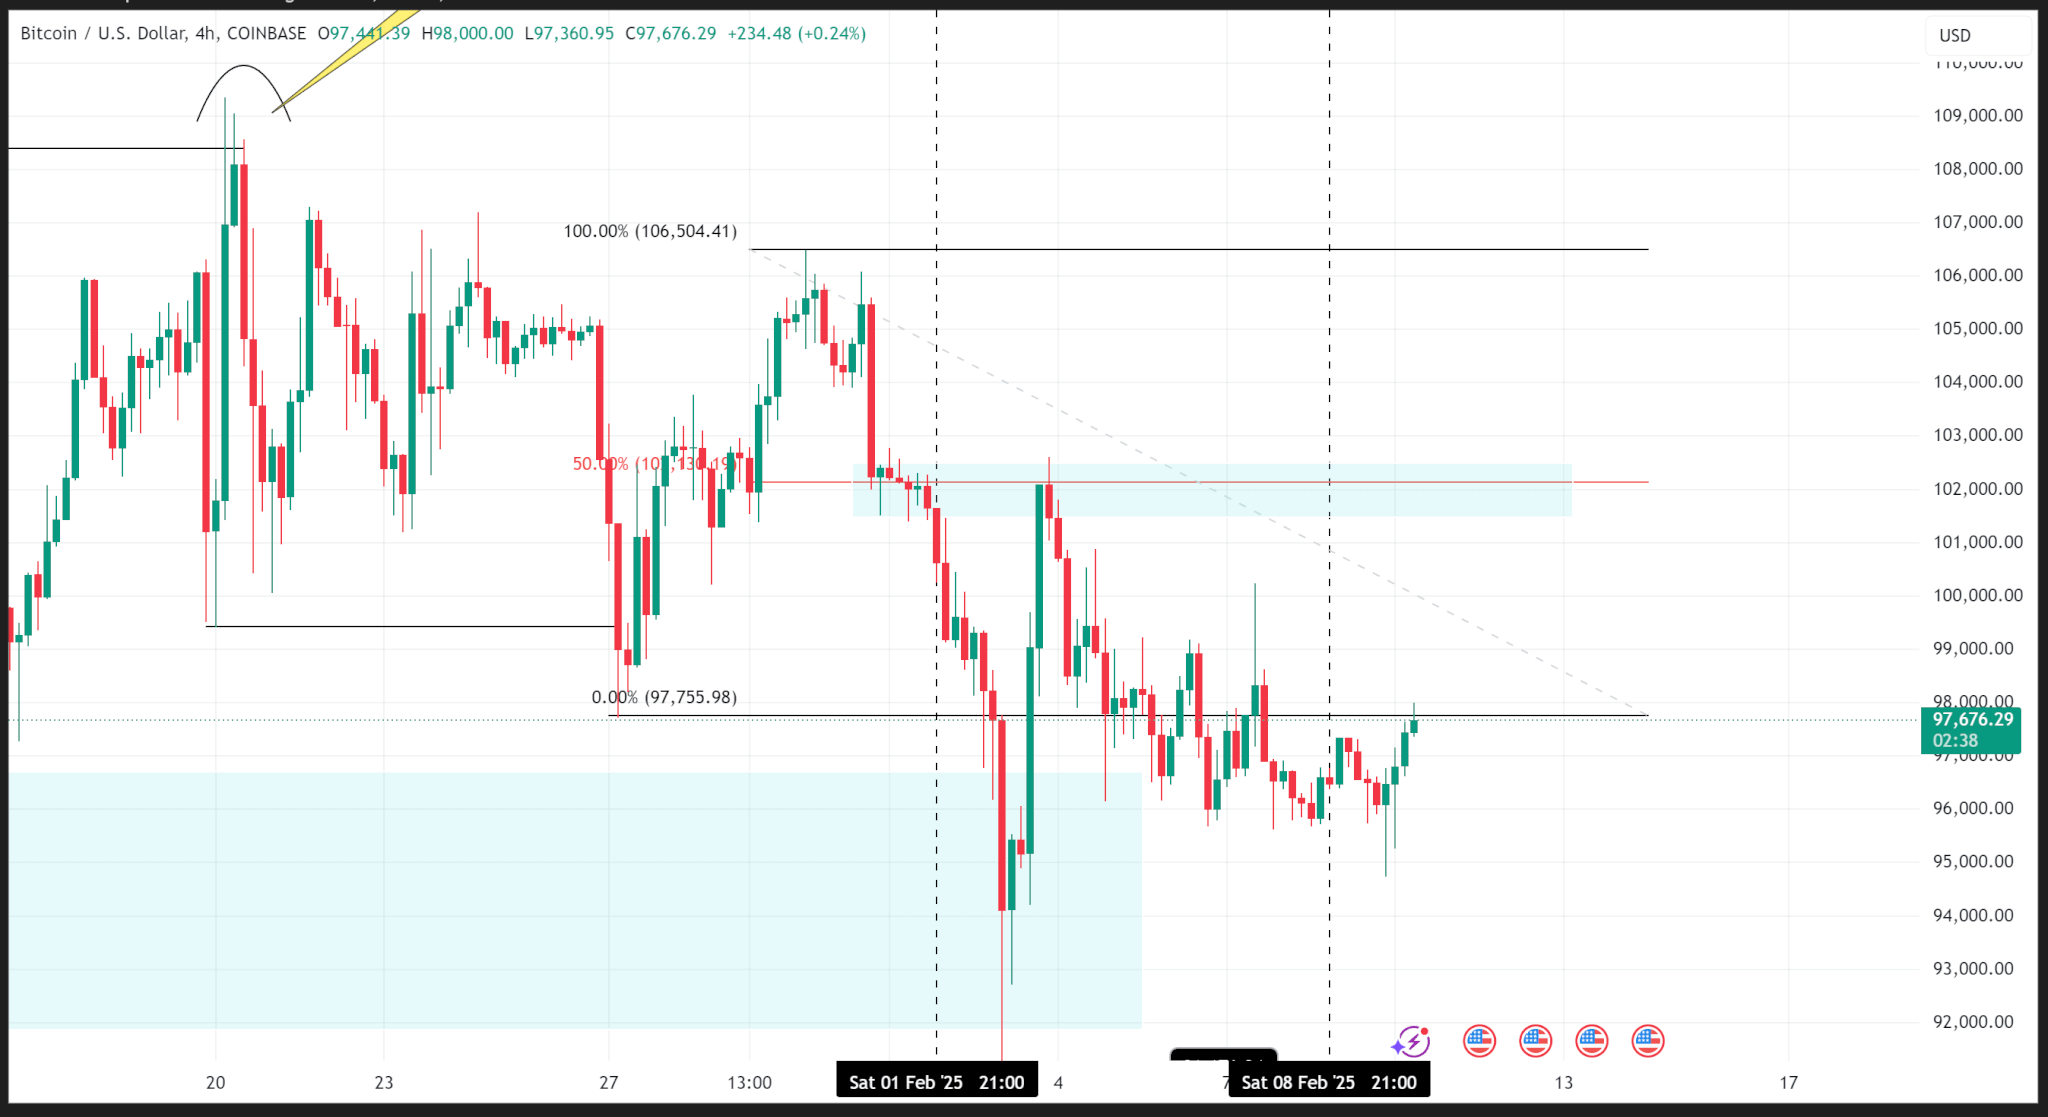
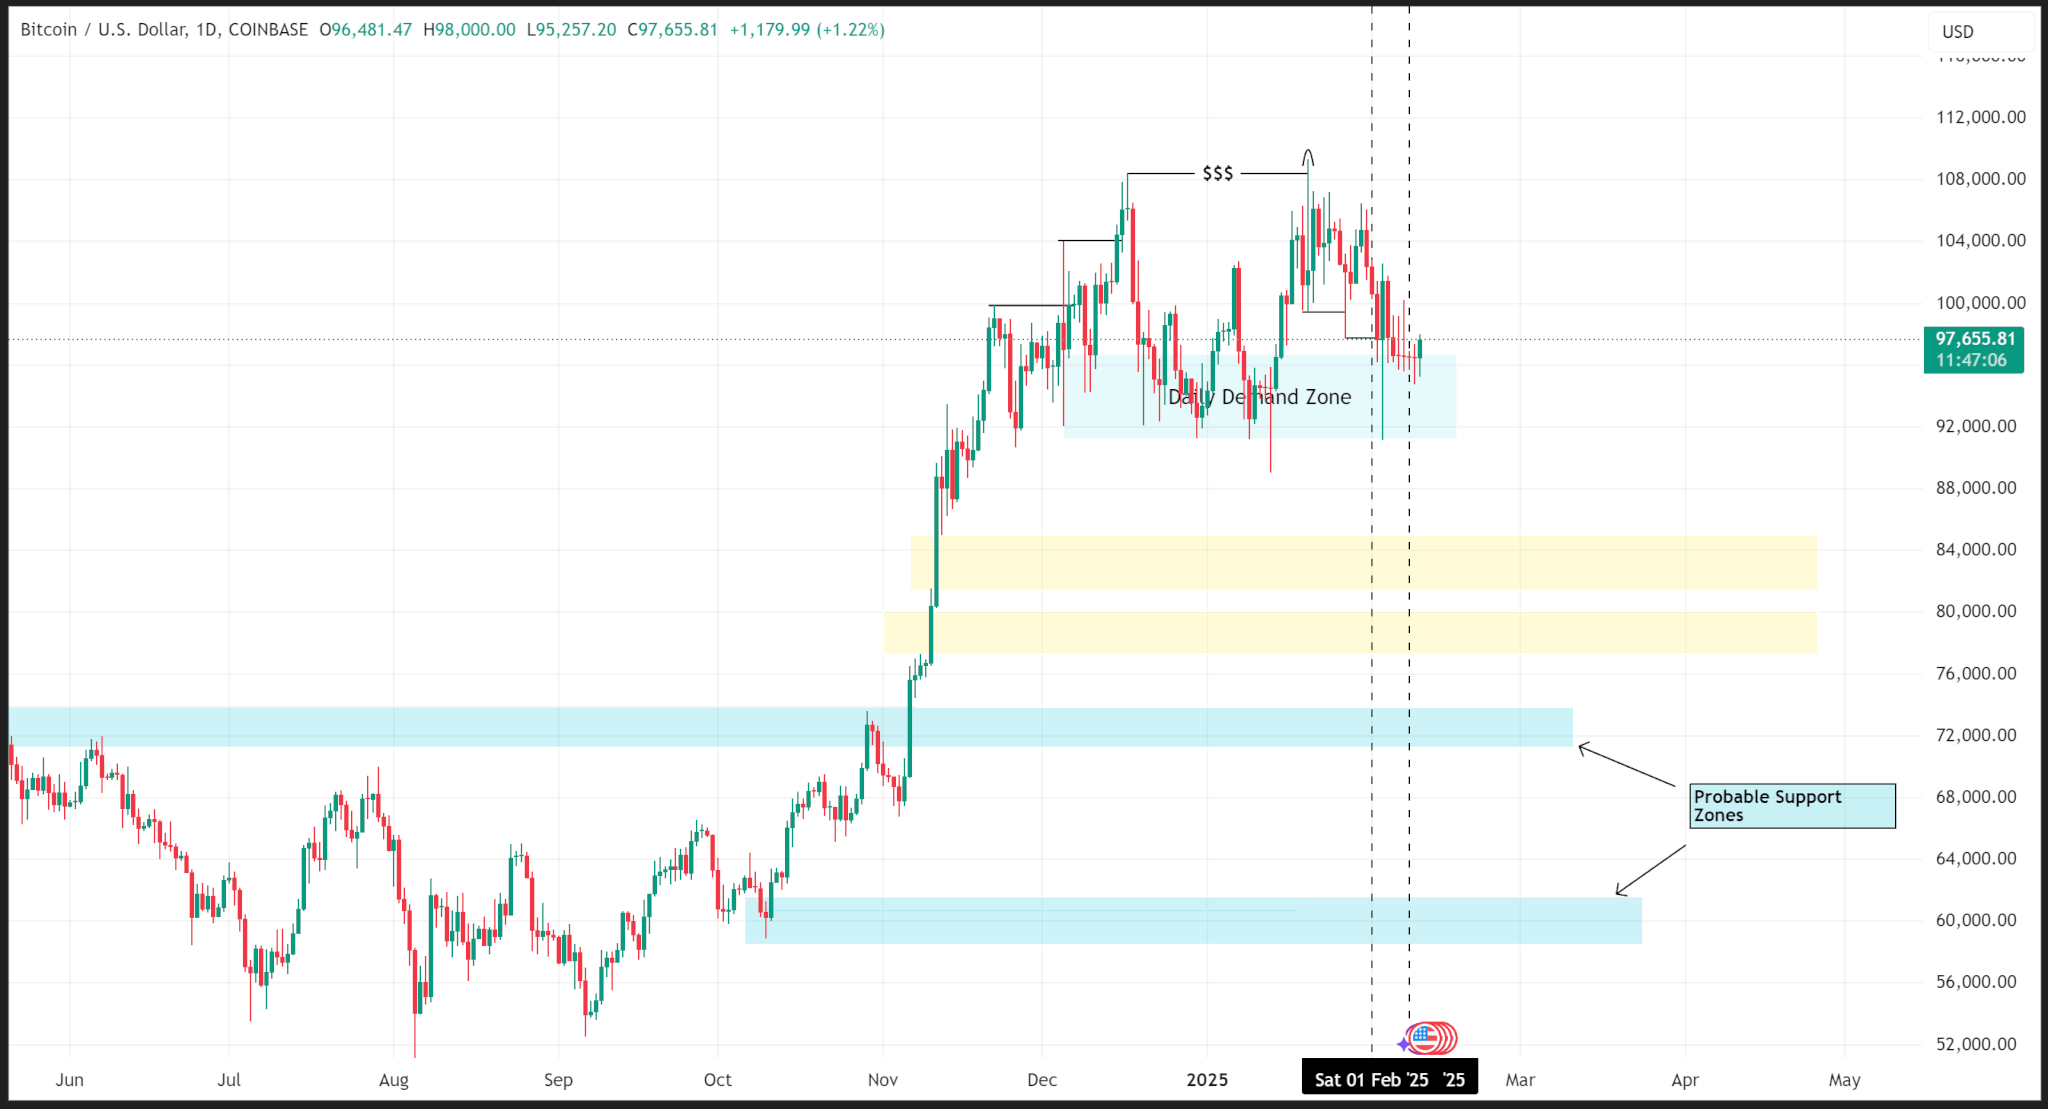
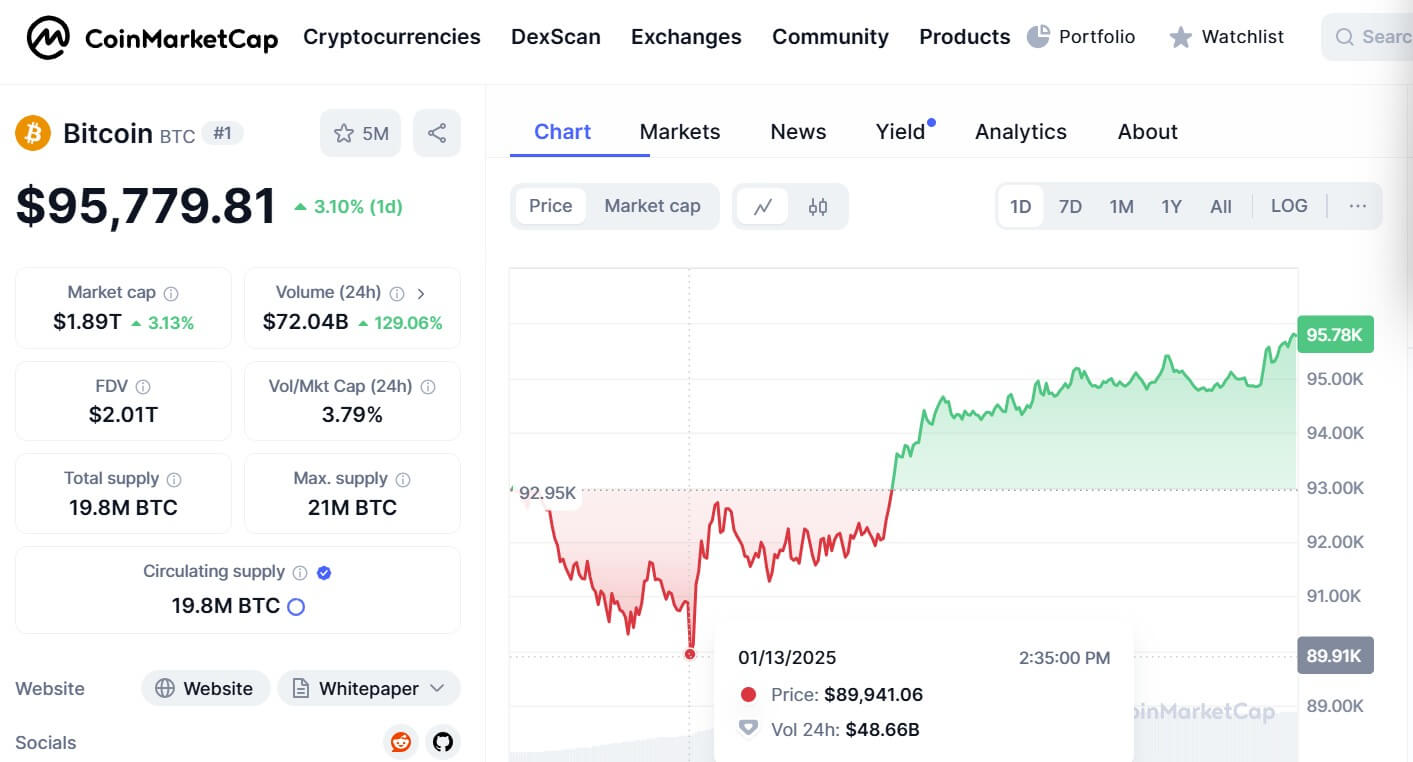
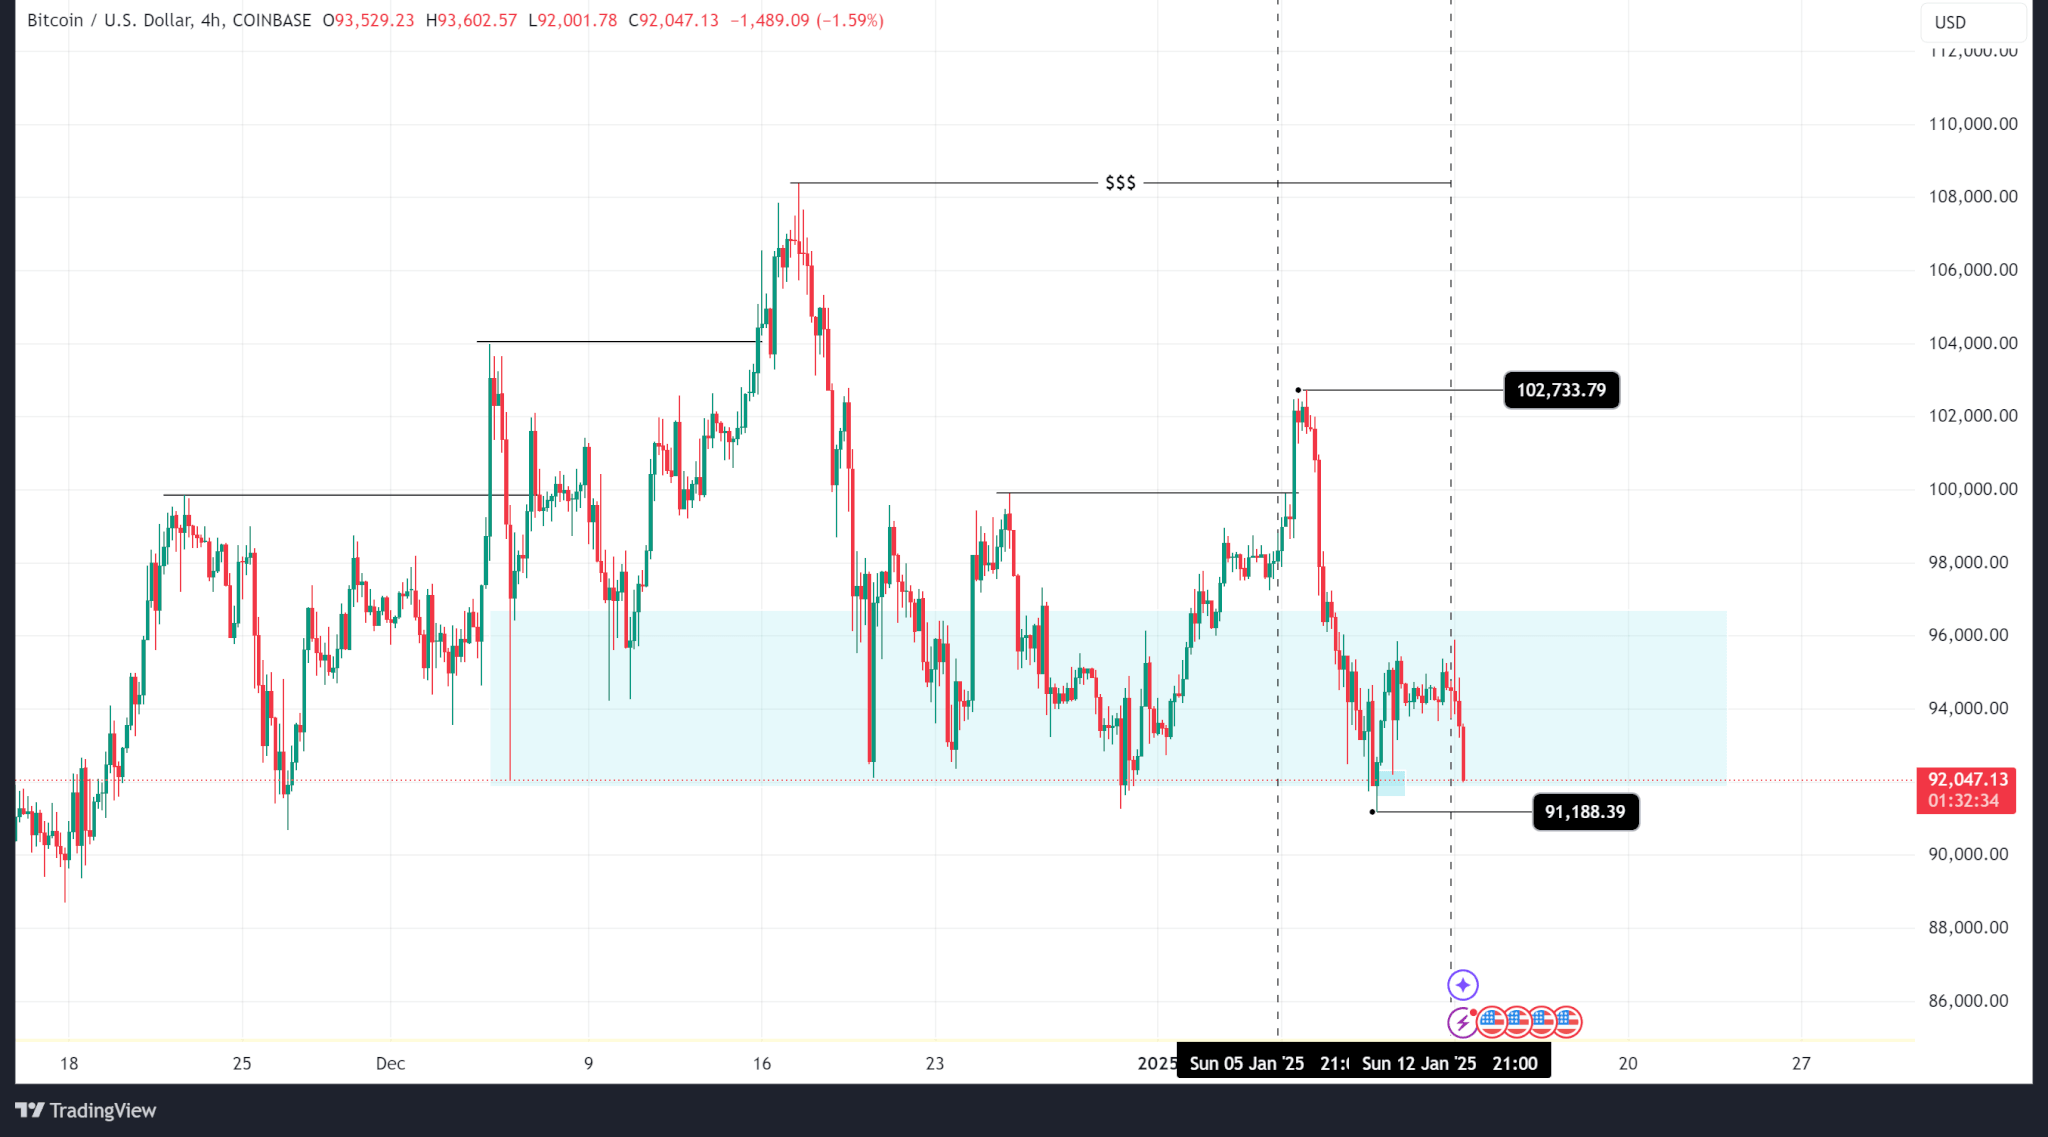
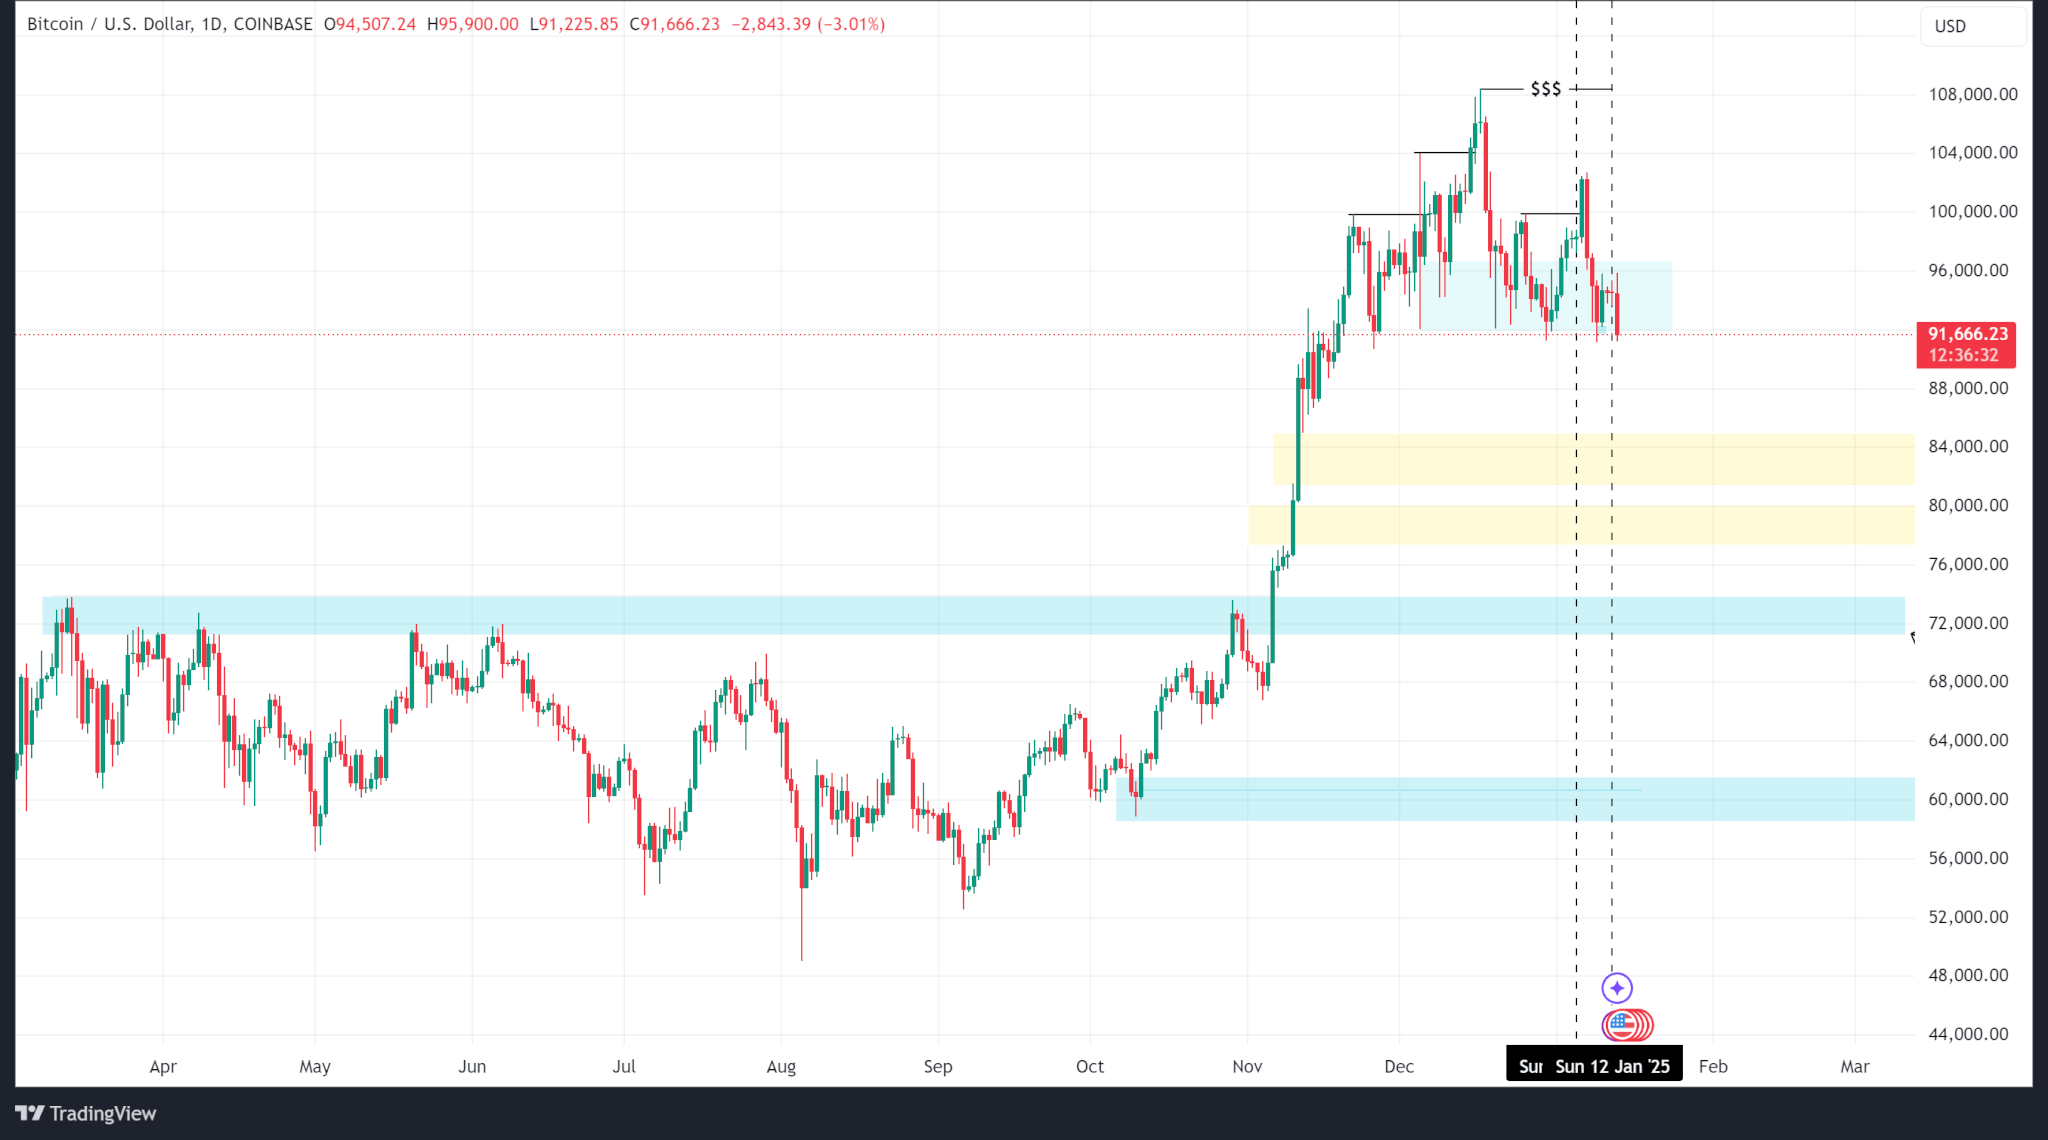
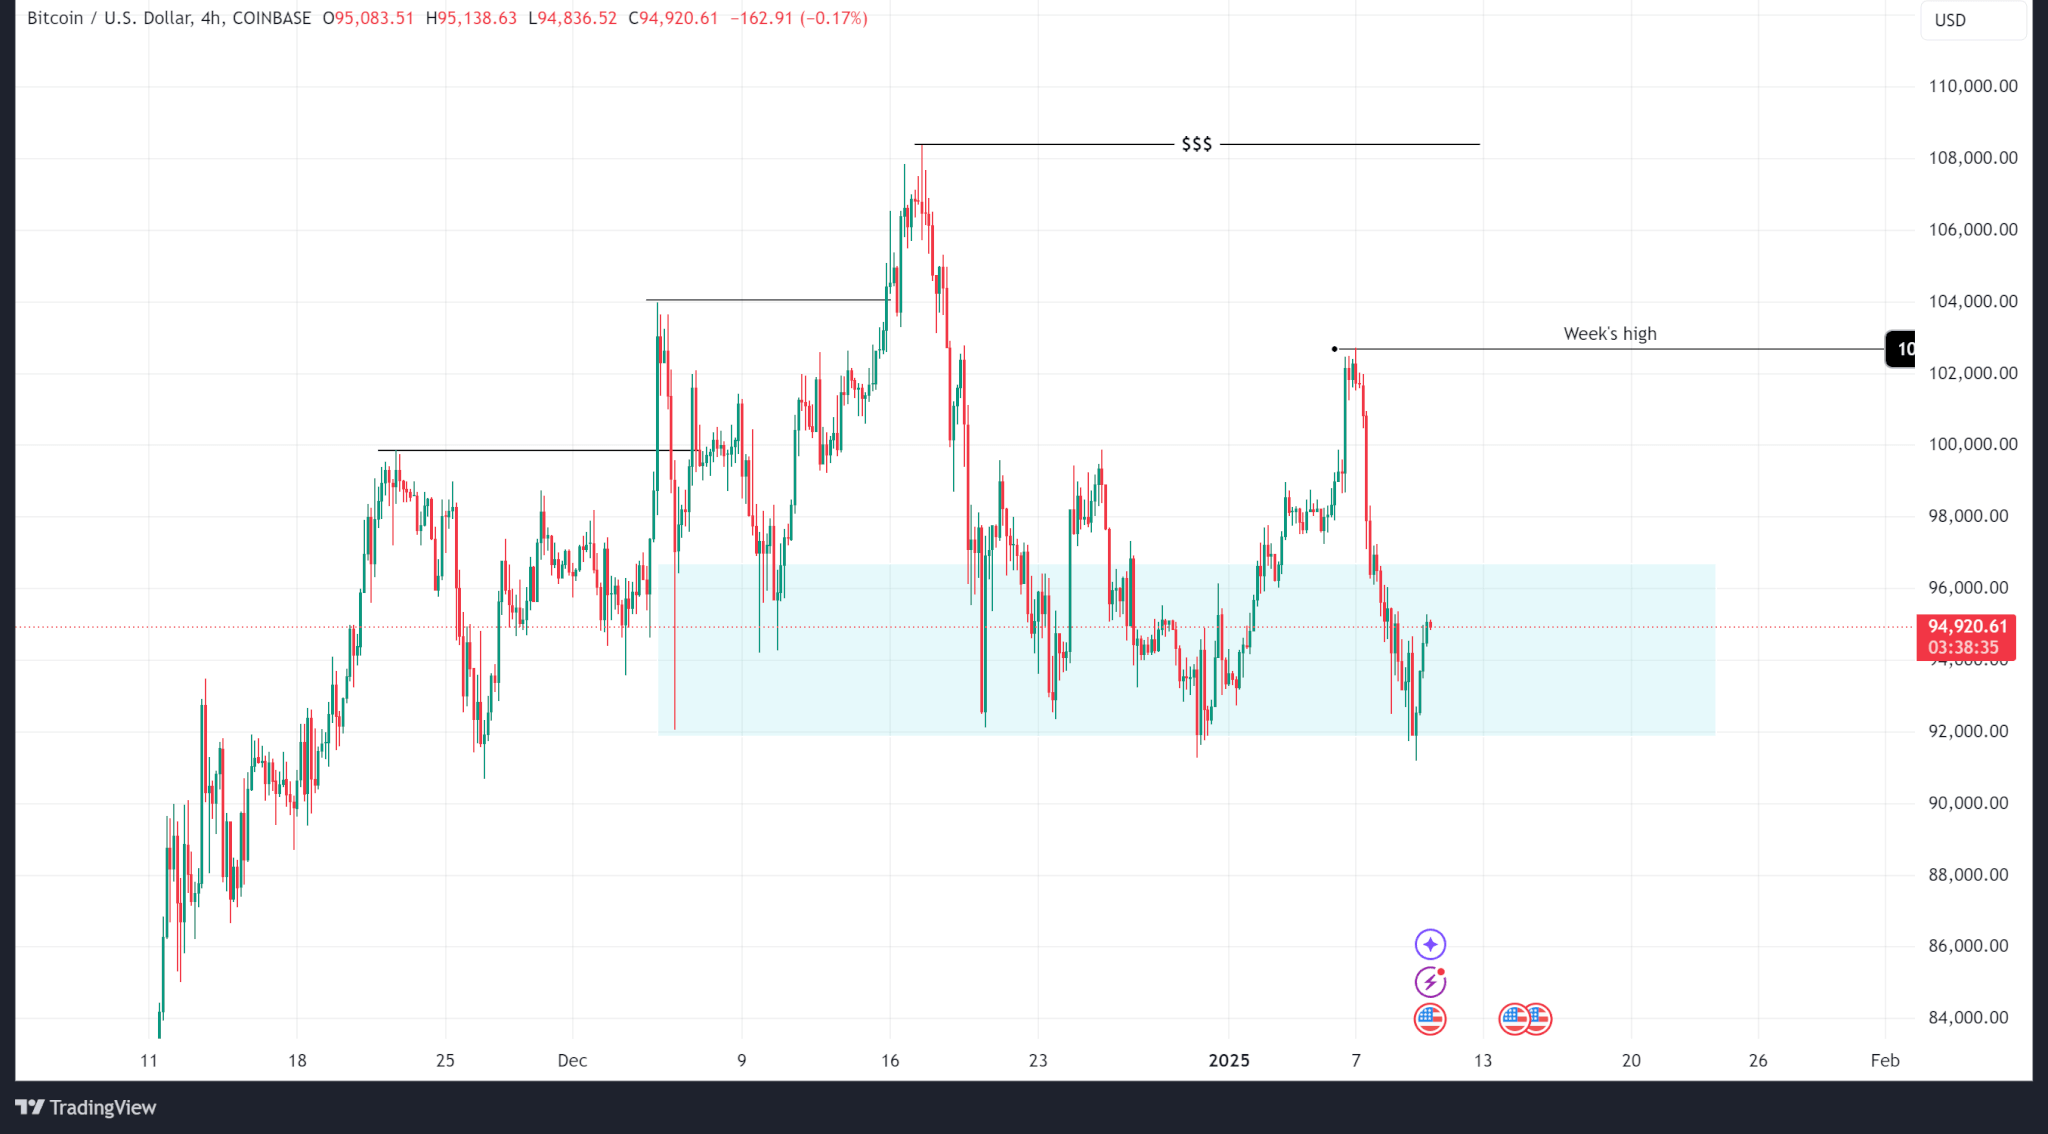
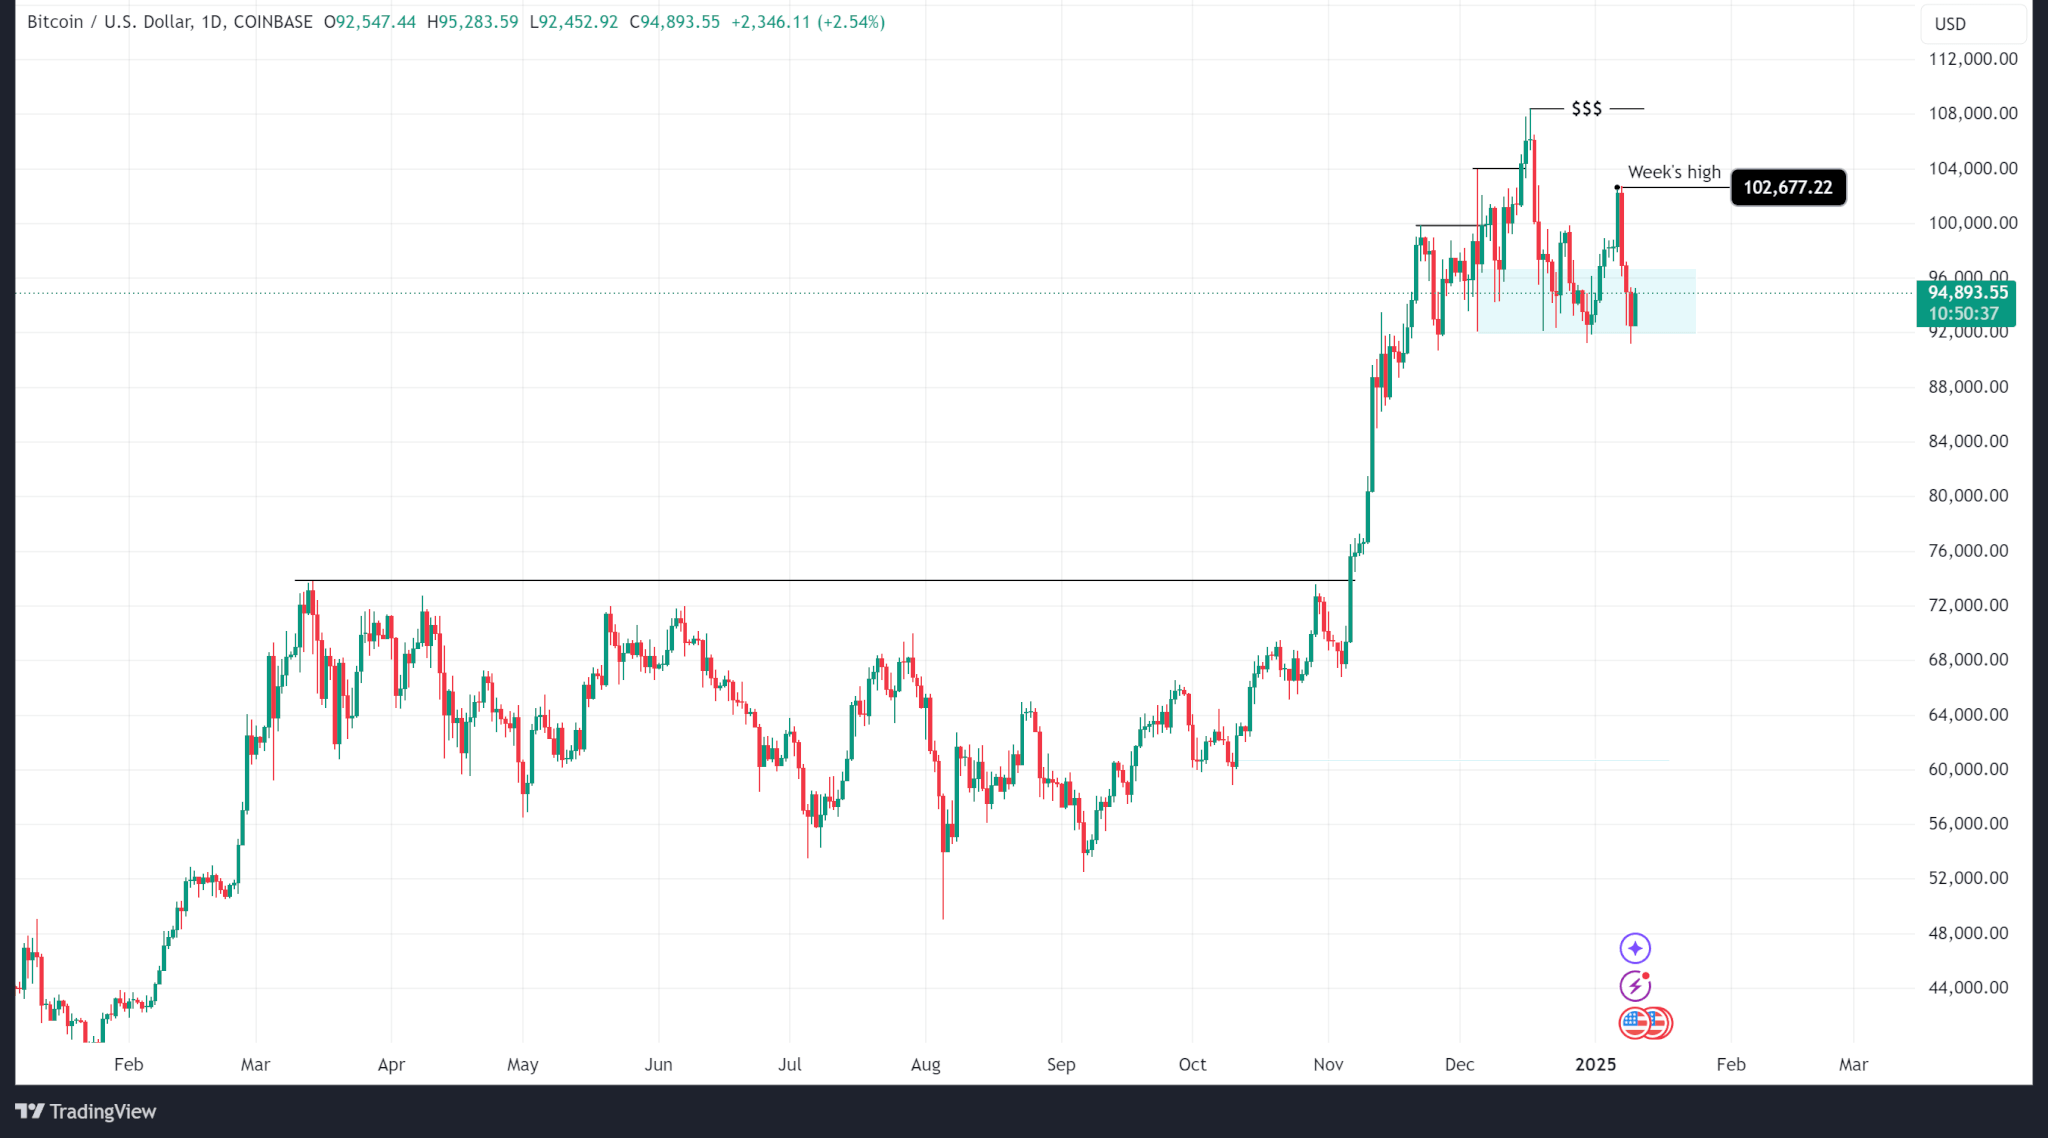
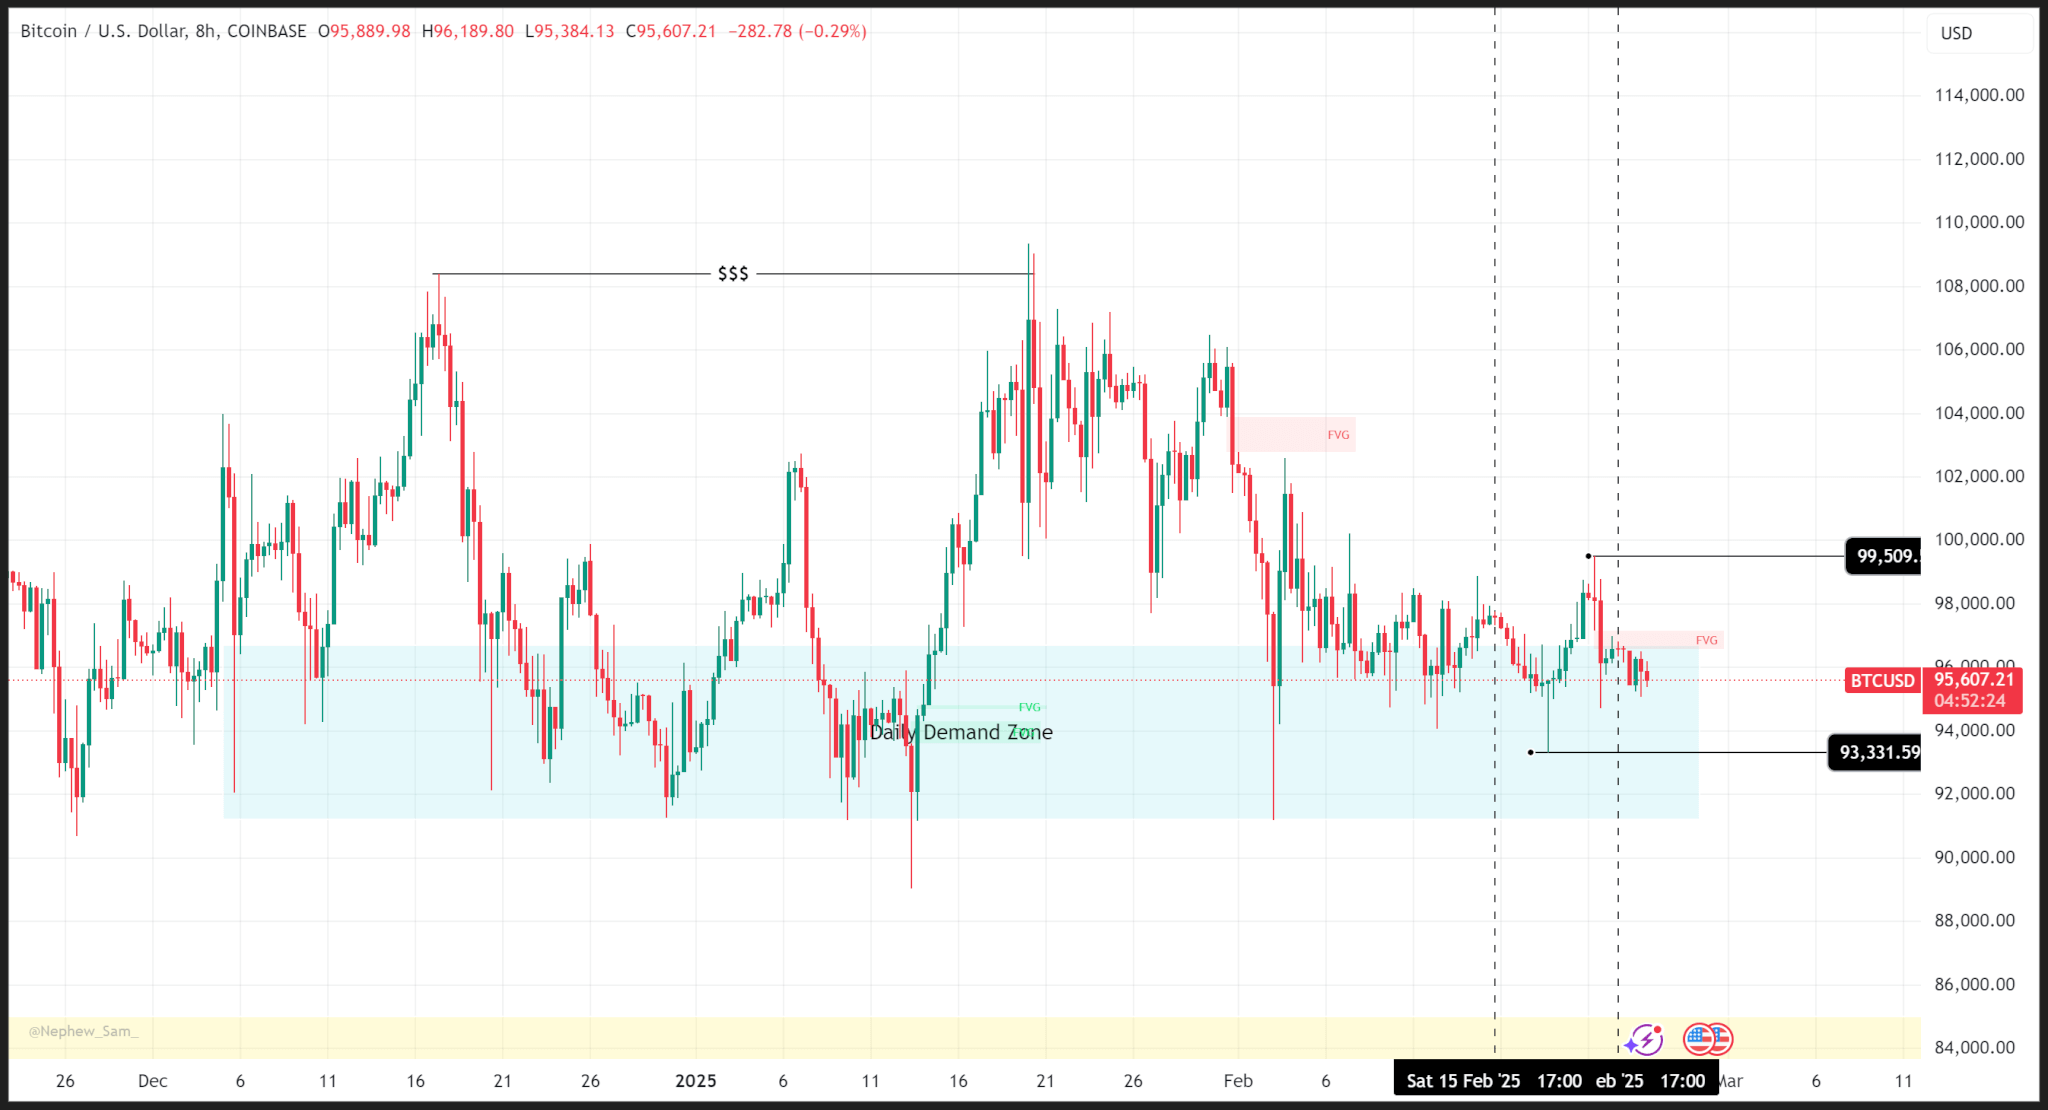
Bitcoin’s price action continued trading rangebound, with weekly highs and lows of $99,509 and $93,331, as uncertainty looms around inflation, US President Donald Trump’s policies, and geopolitical events.
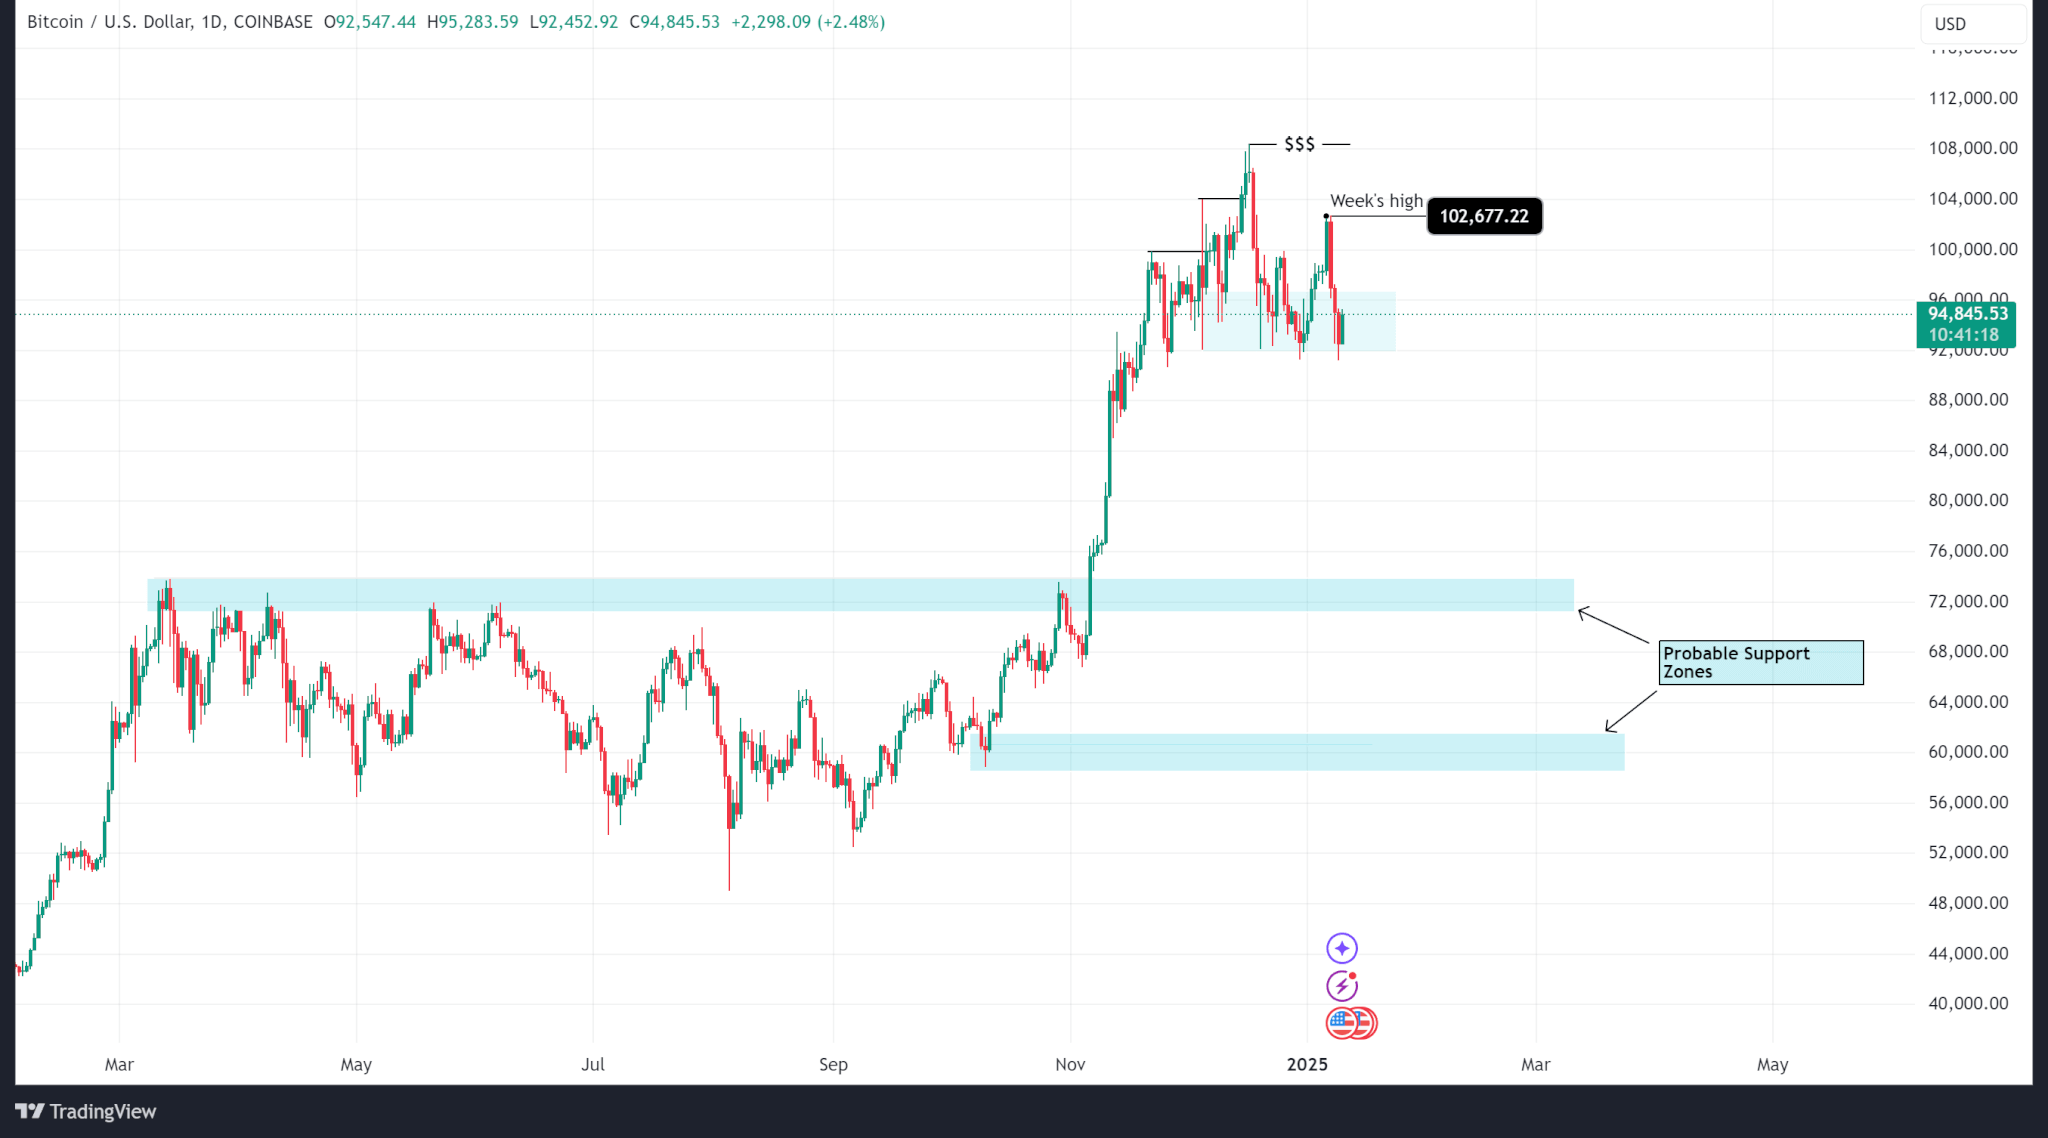
Zooming out, we see that price action has ranged at the daily support level for the last three weeks as current market conditions lack sufficient catalyst to push prices to new highs.
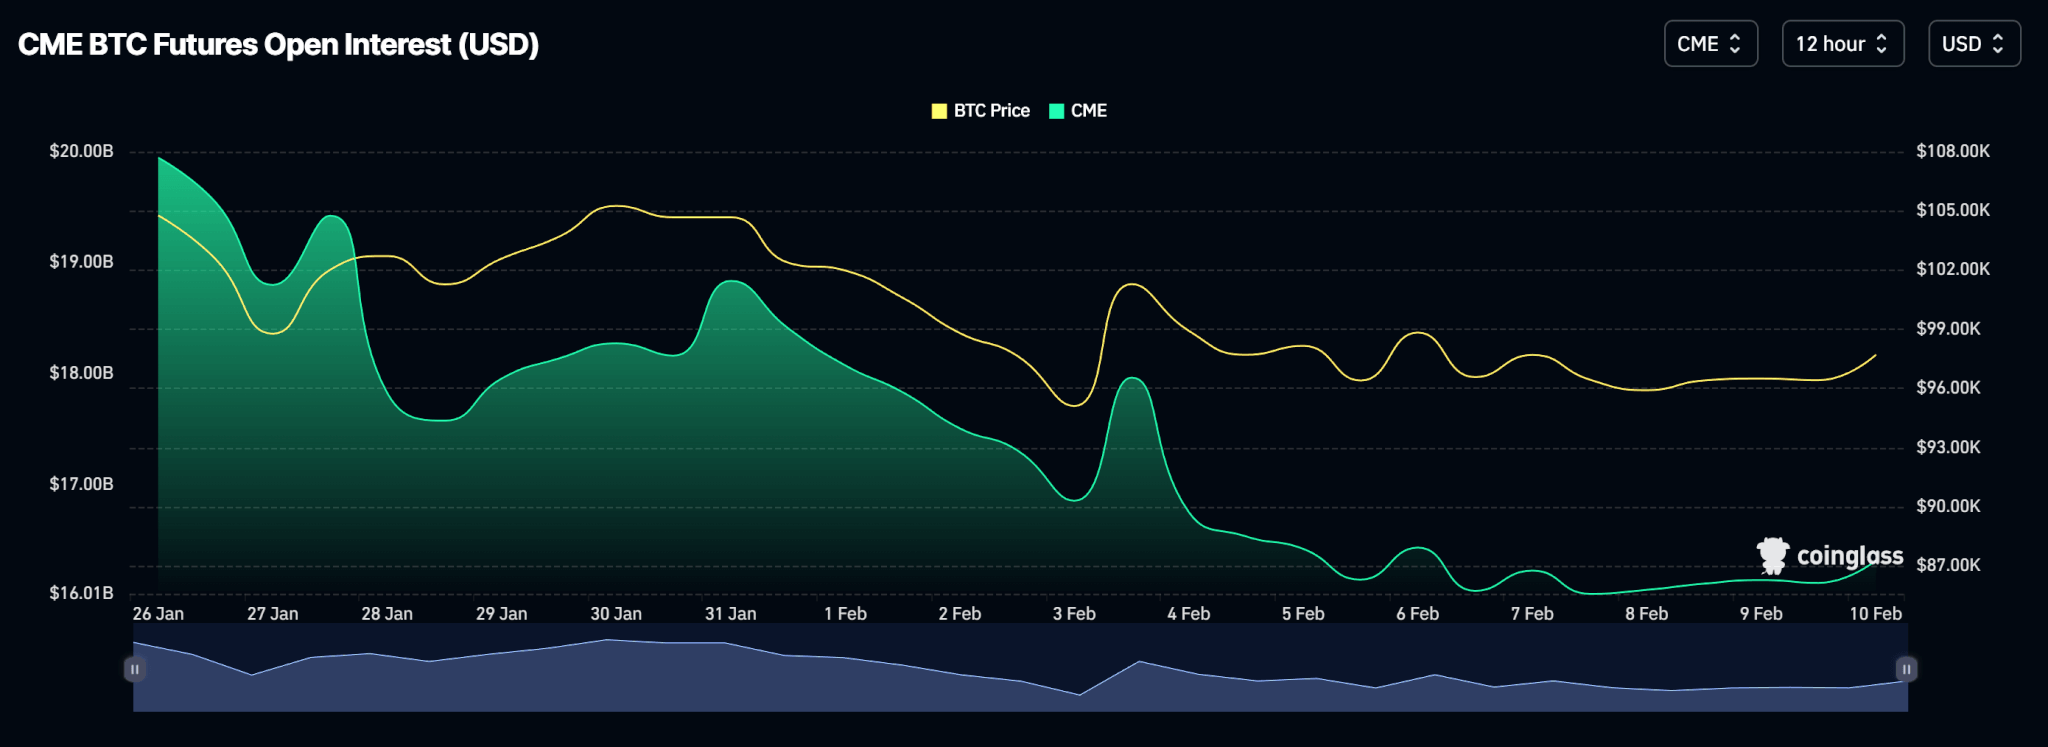
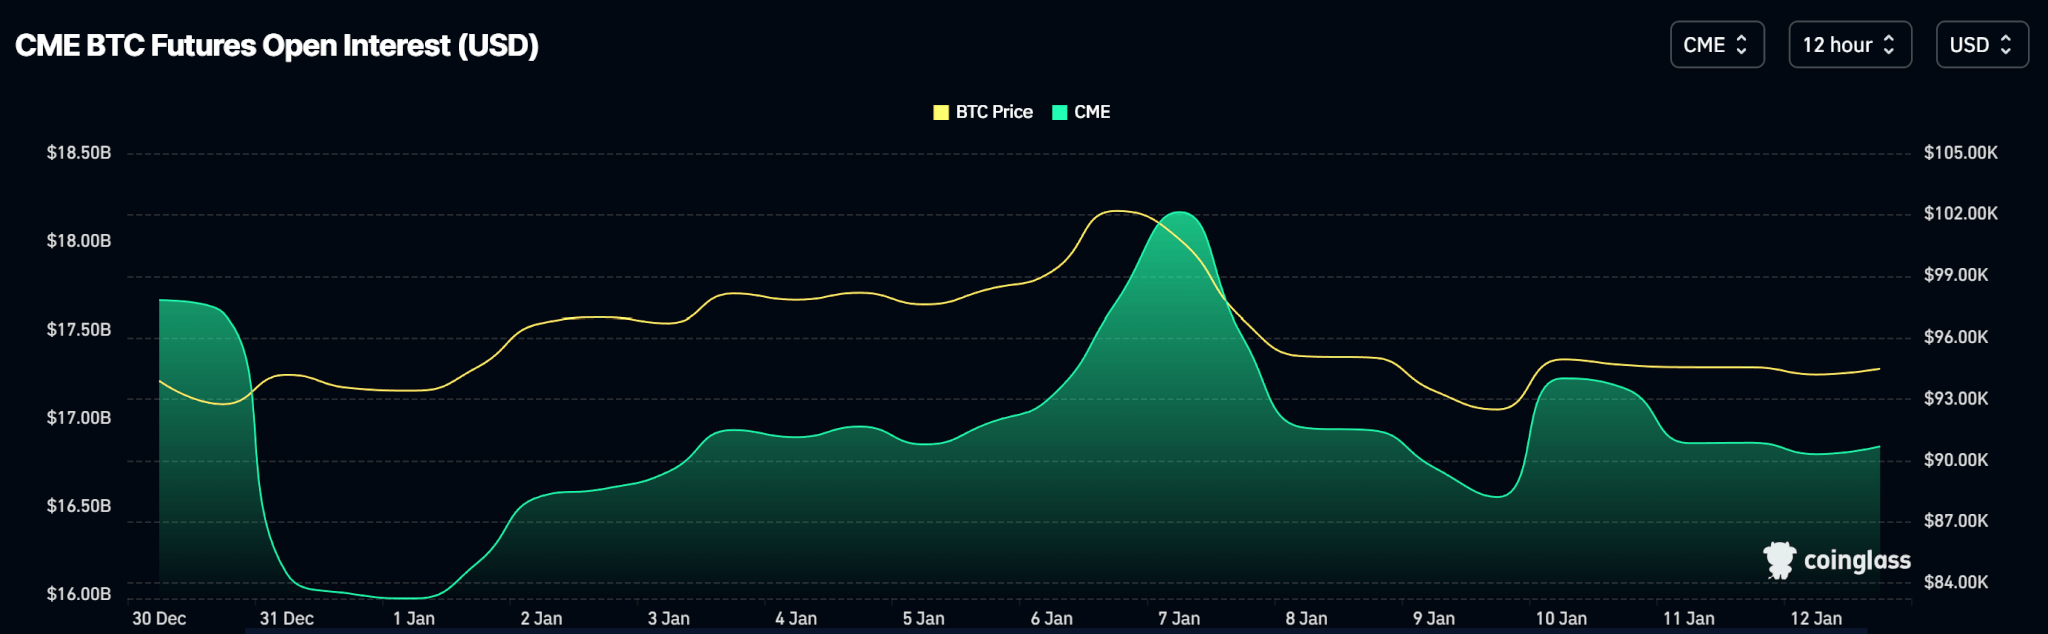
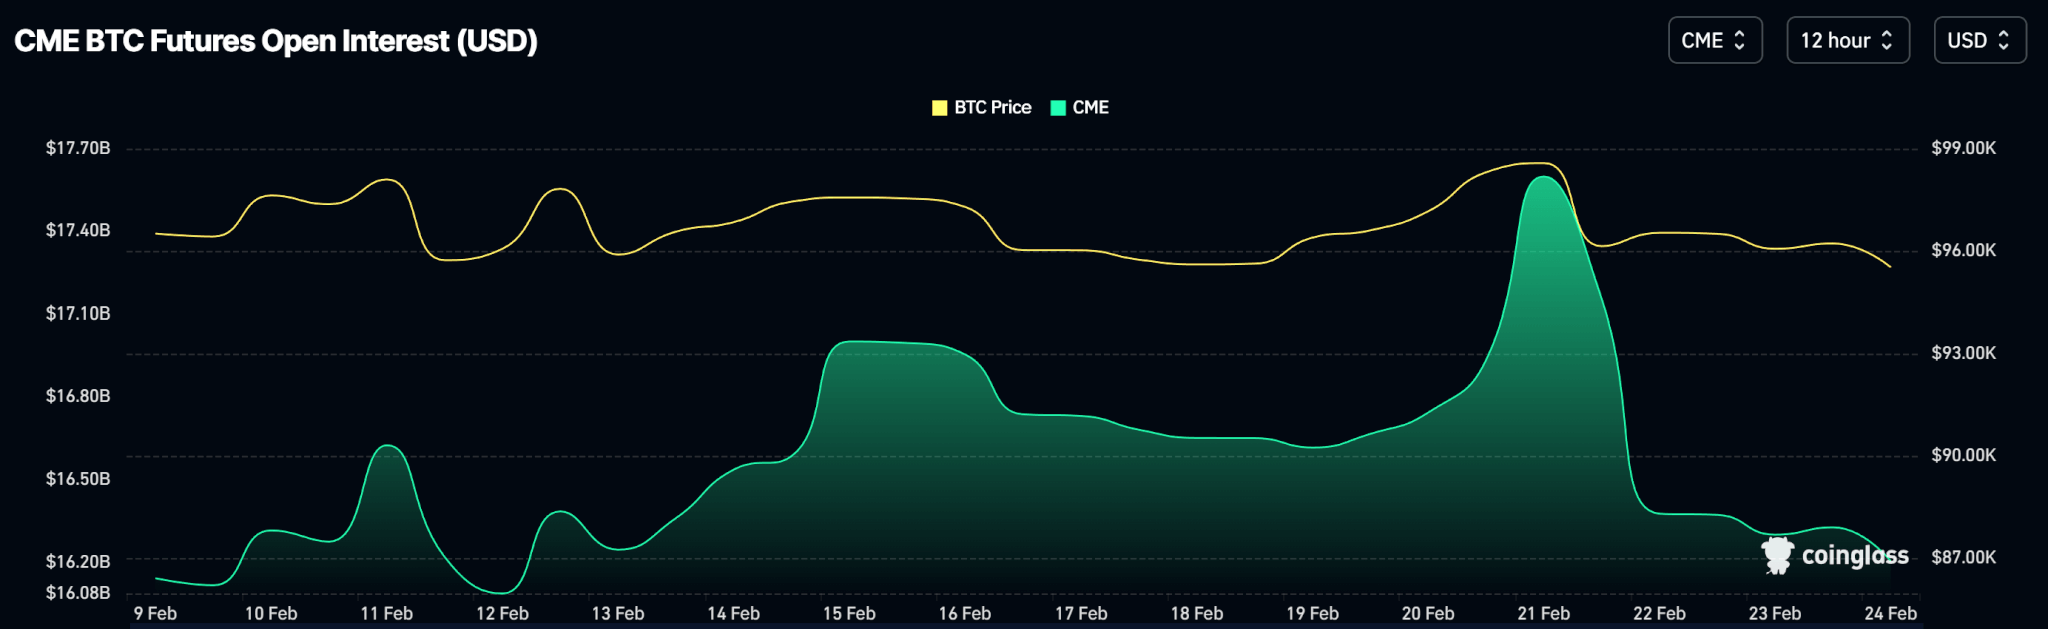
Open interest mimics price action as the week began with a reduction in the volume of open contracts which picked up on Wednesday, February 19, congruent with price action.
Outlook
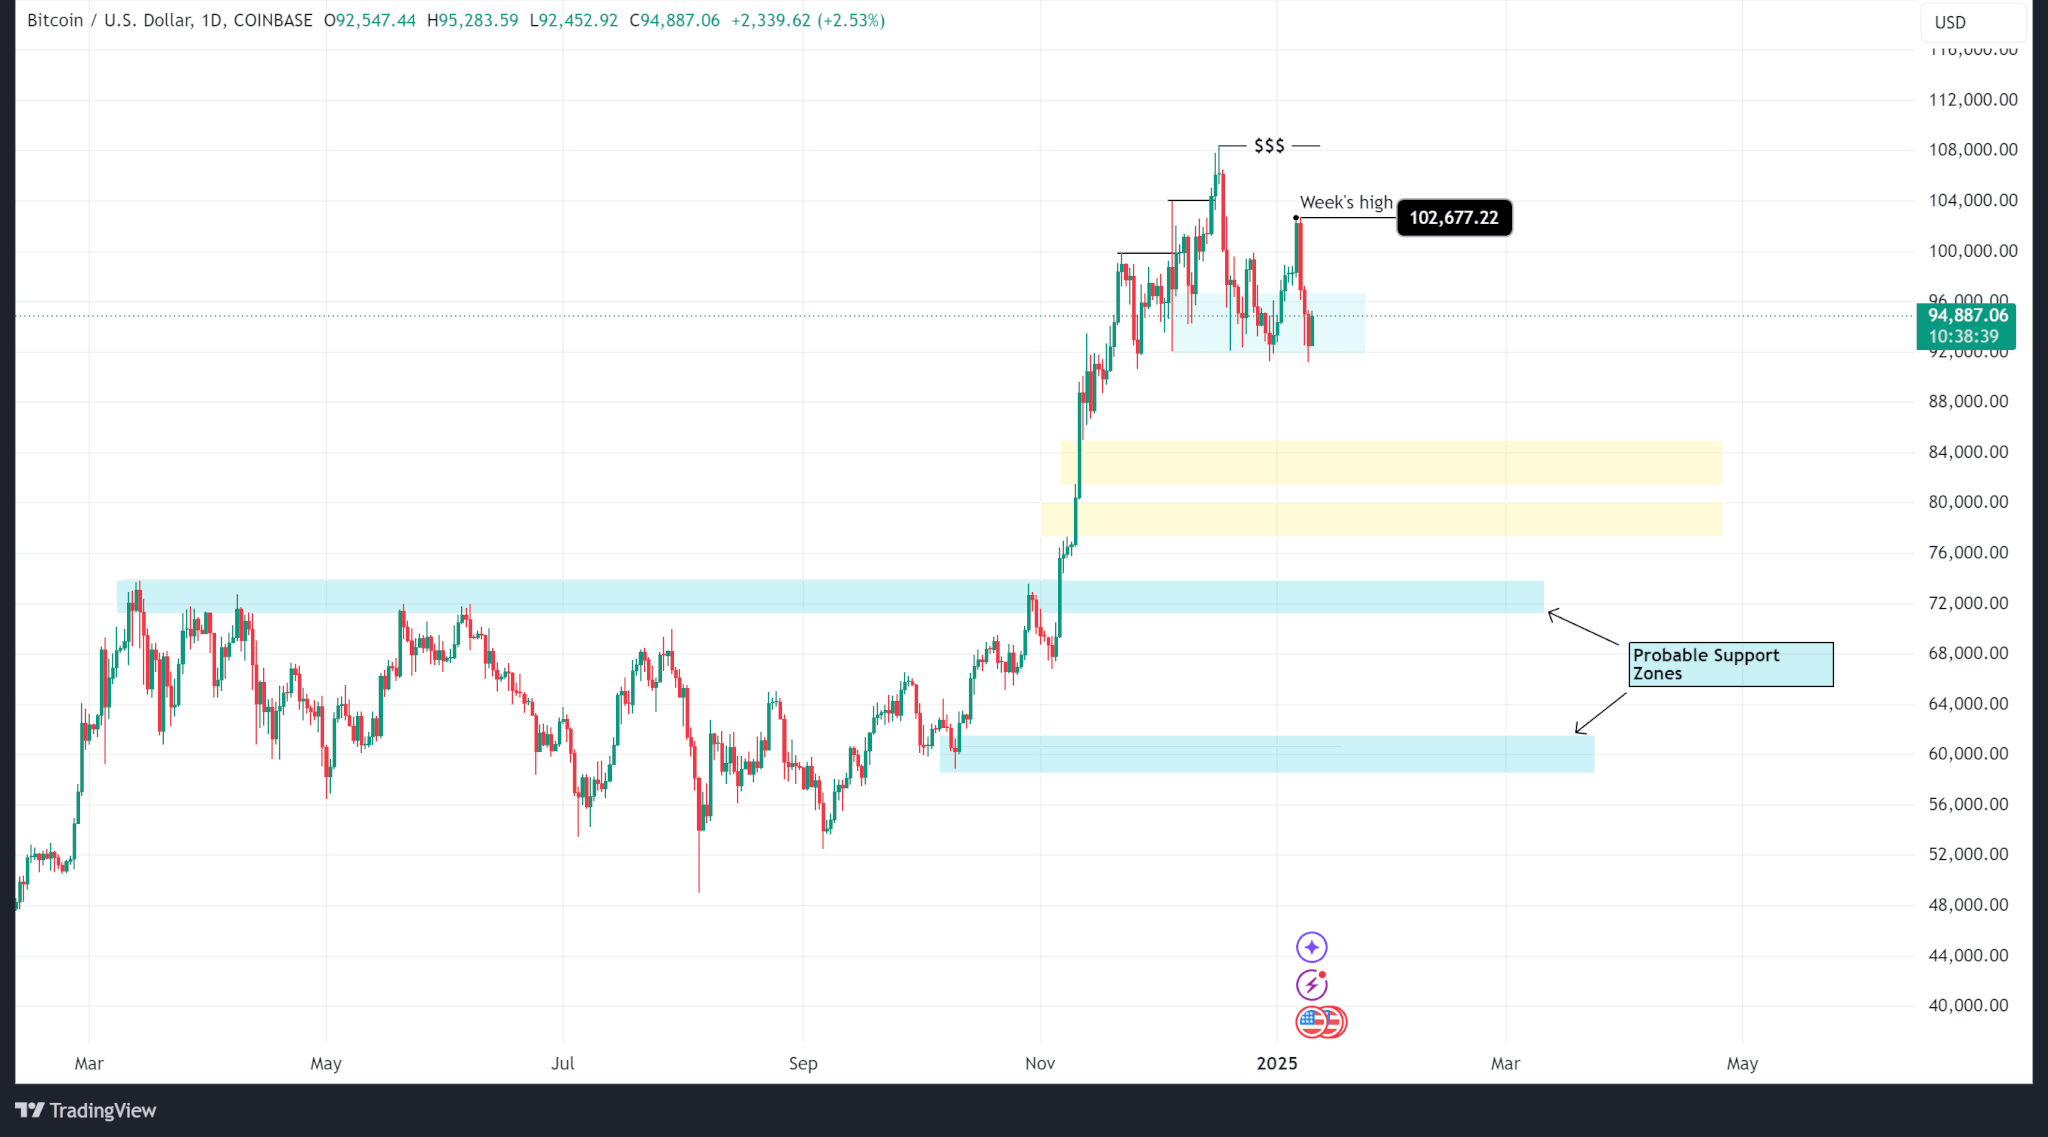
Bitcoin must remain above the daily support of $90,673 to remain in bullish territory. A close below this level on the daily time frame could trigger a fall to the $84,000 level.
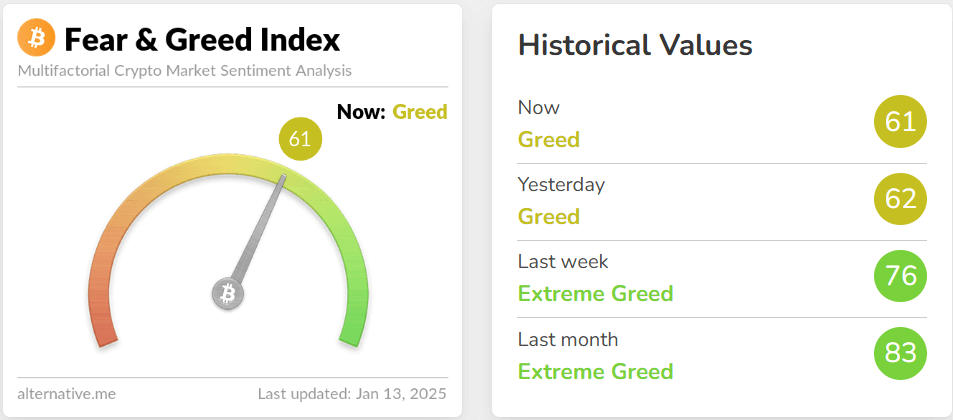
Meanwhile, market sentiment has cooled significantly over the last month and is in neutral territory.
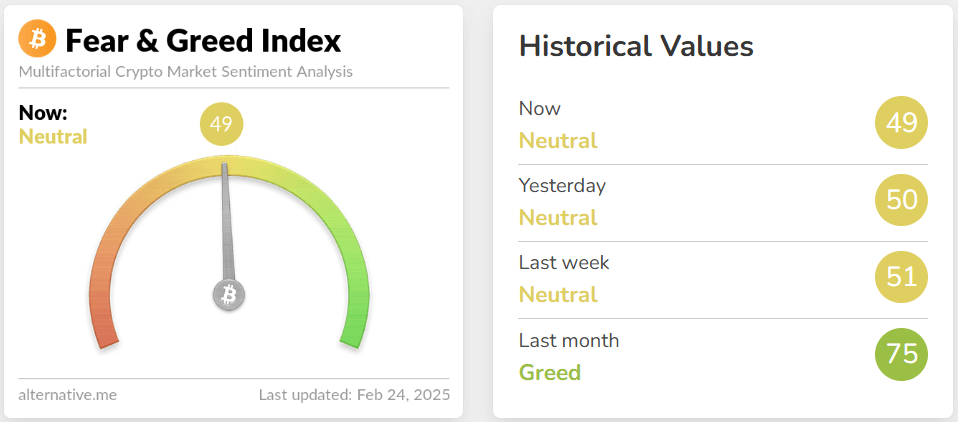
Bitcoin trades at $87,900 as of publishing.
Ethereum
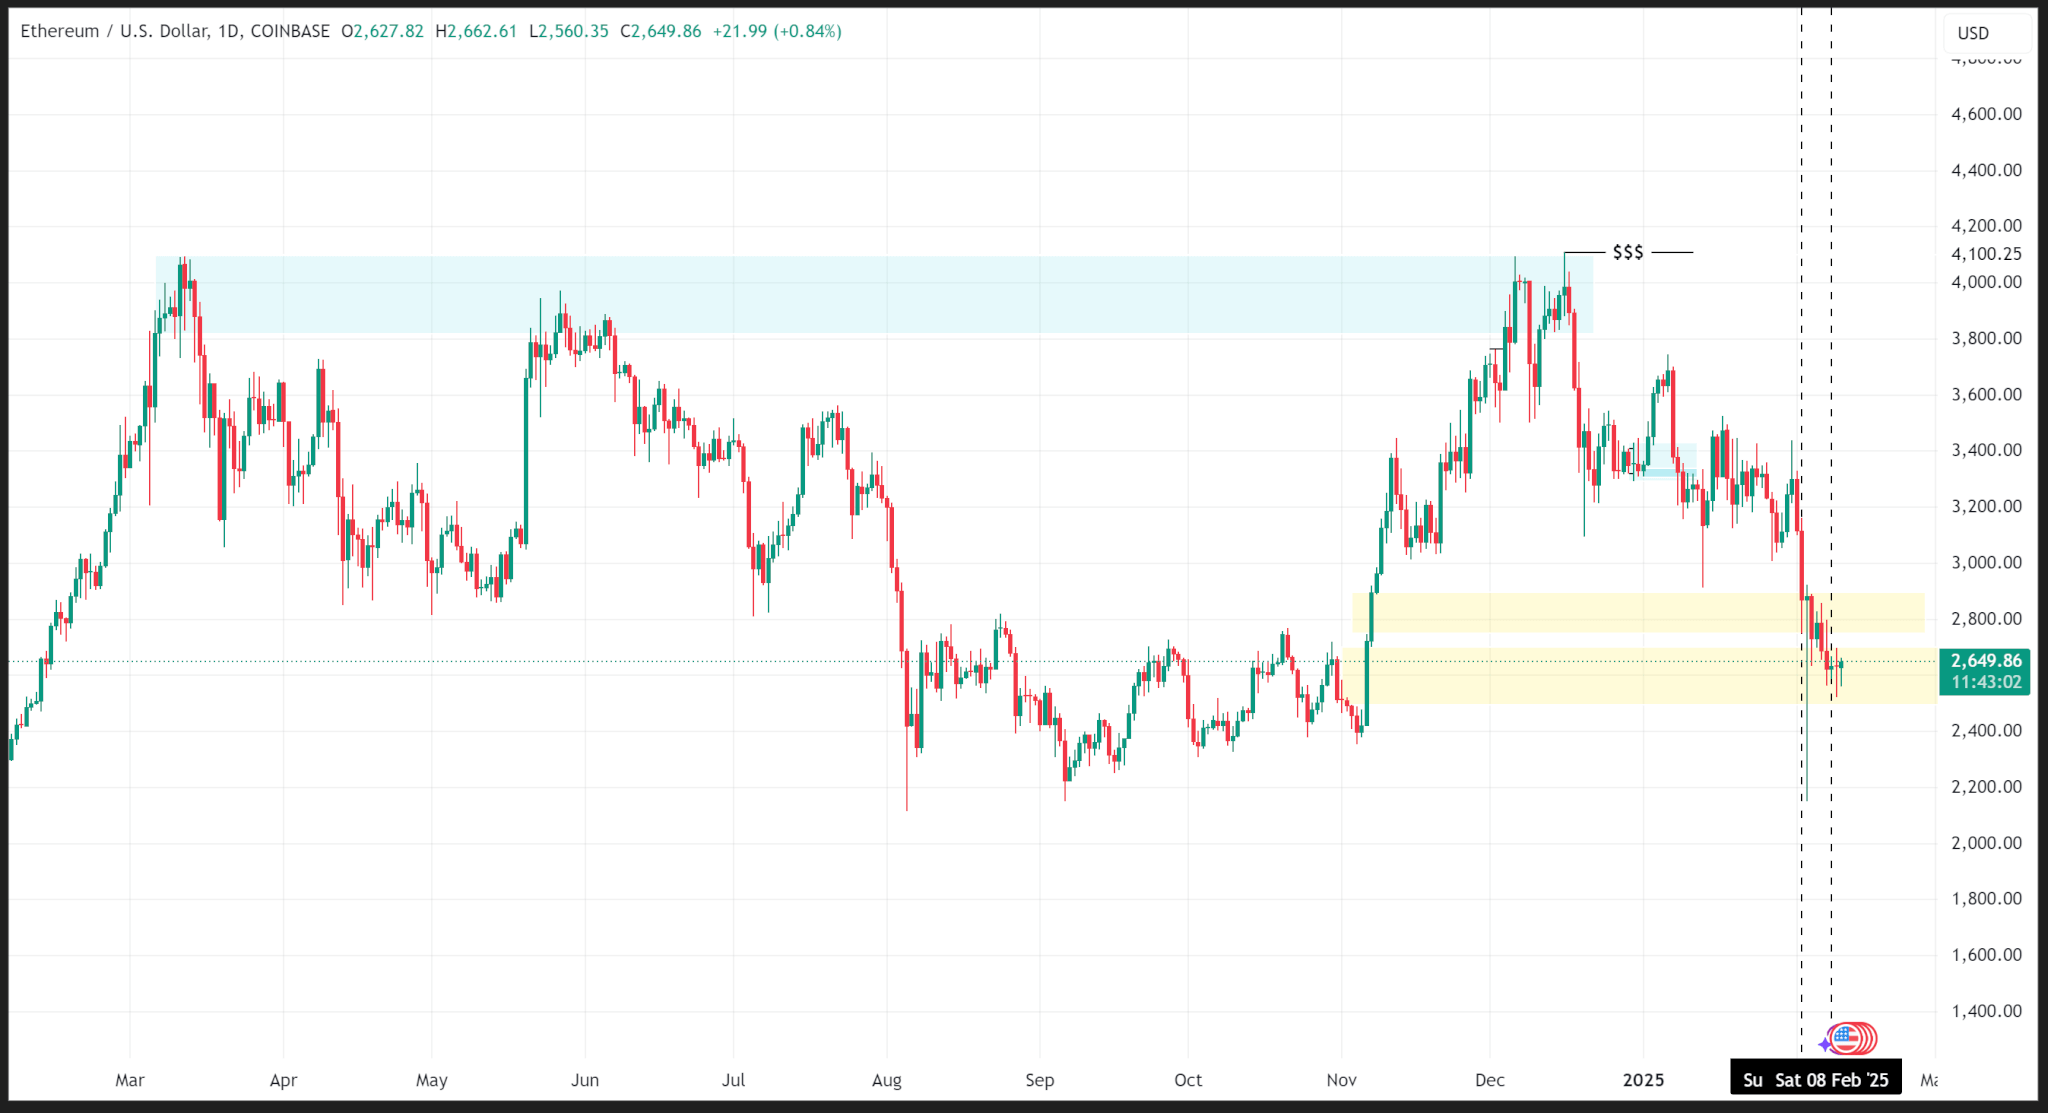
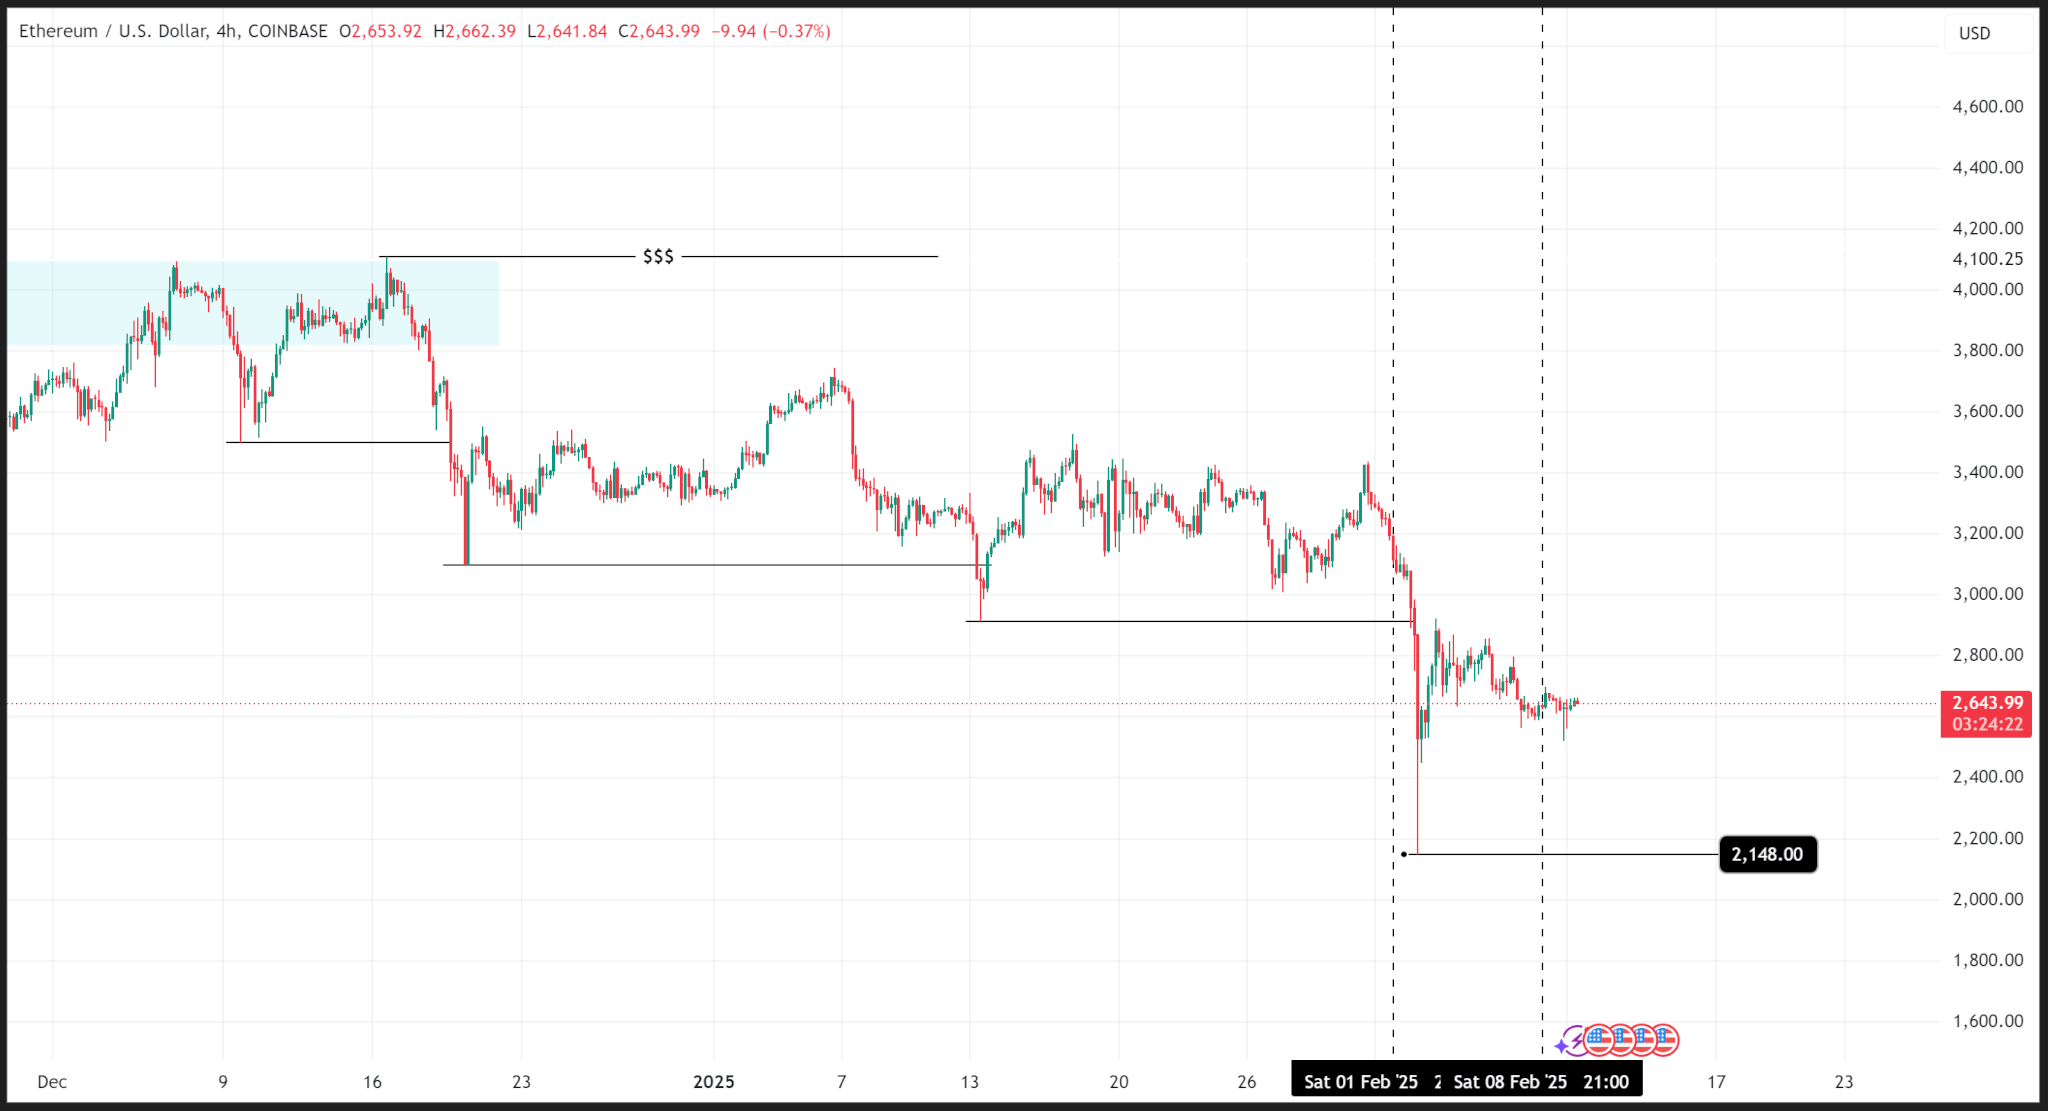
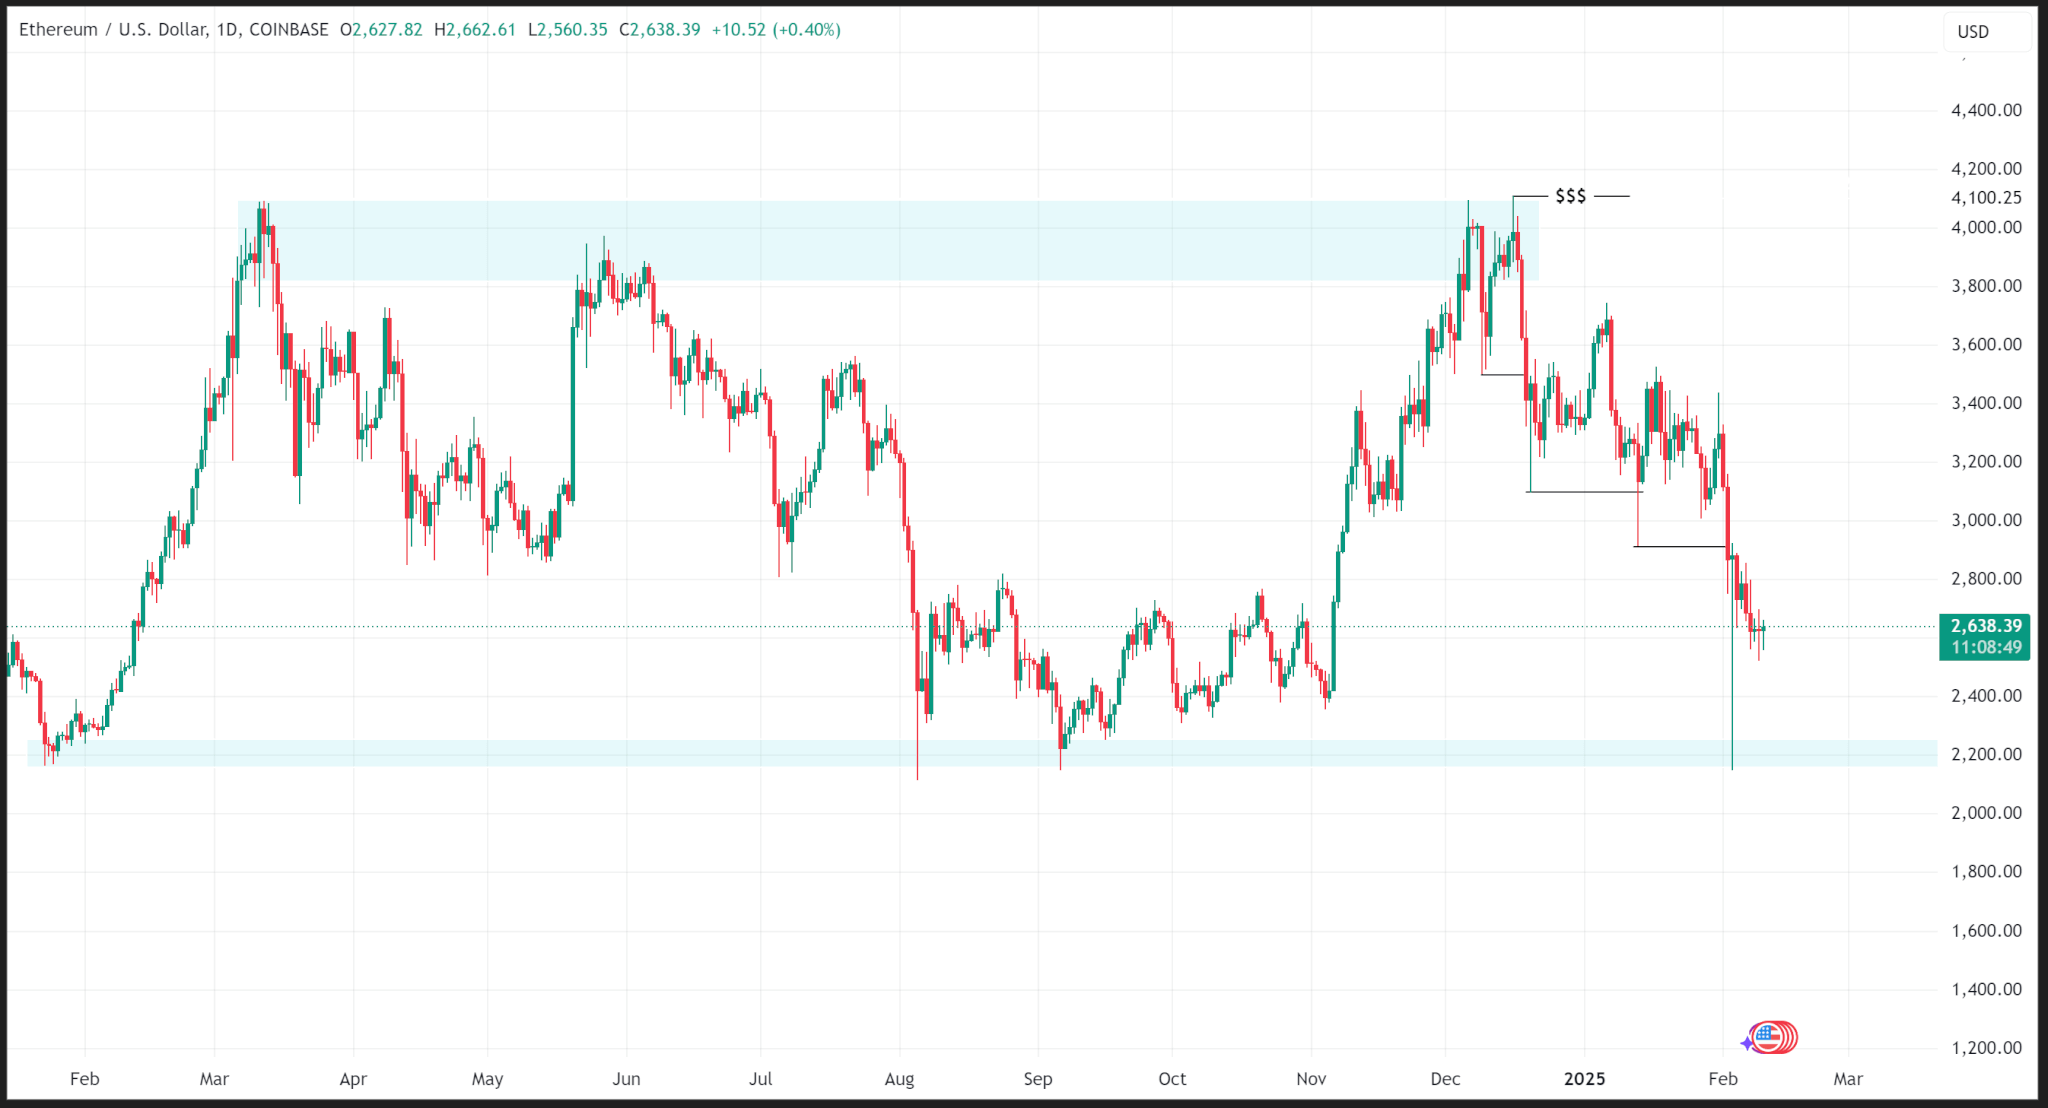
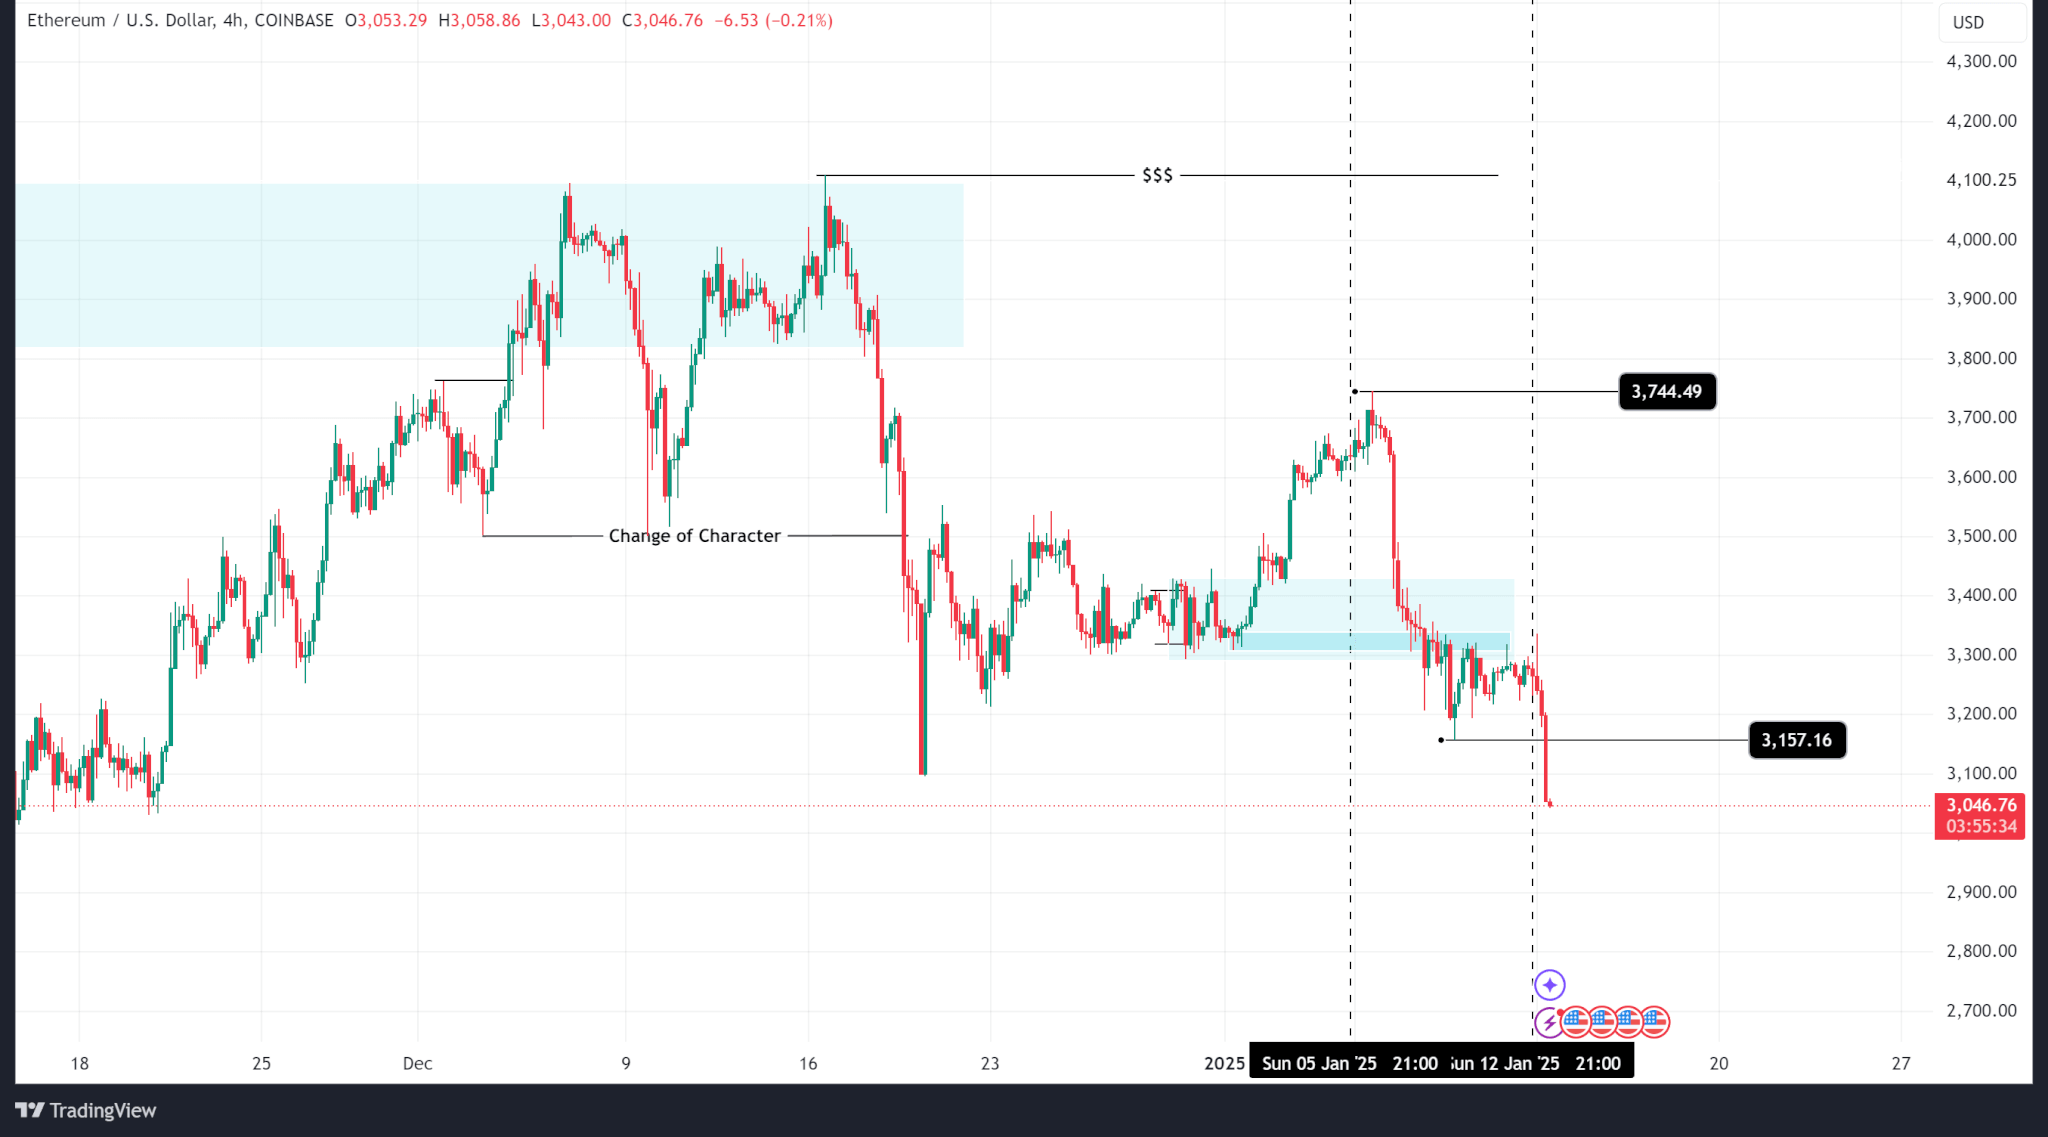
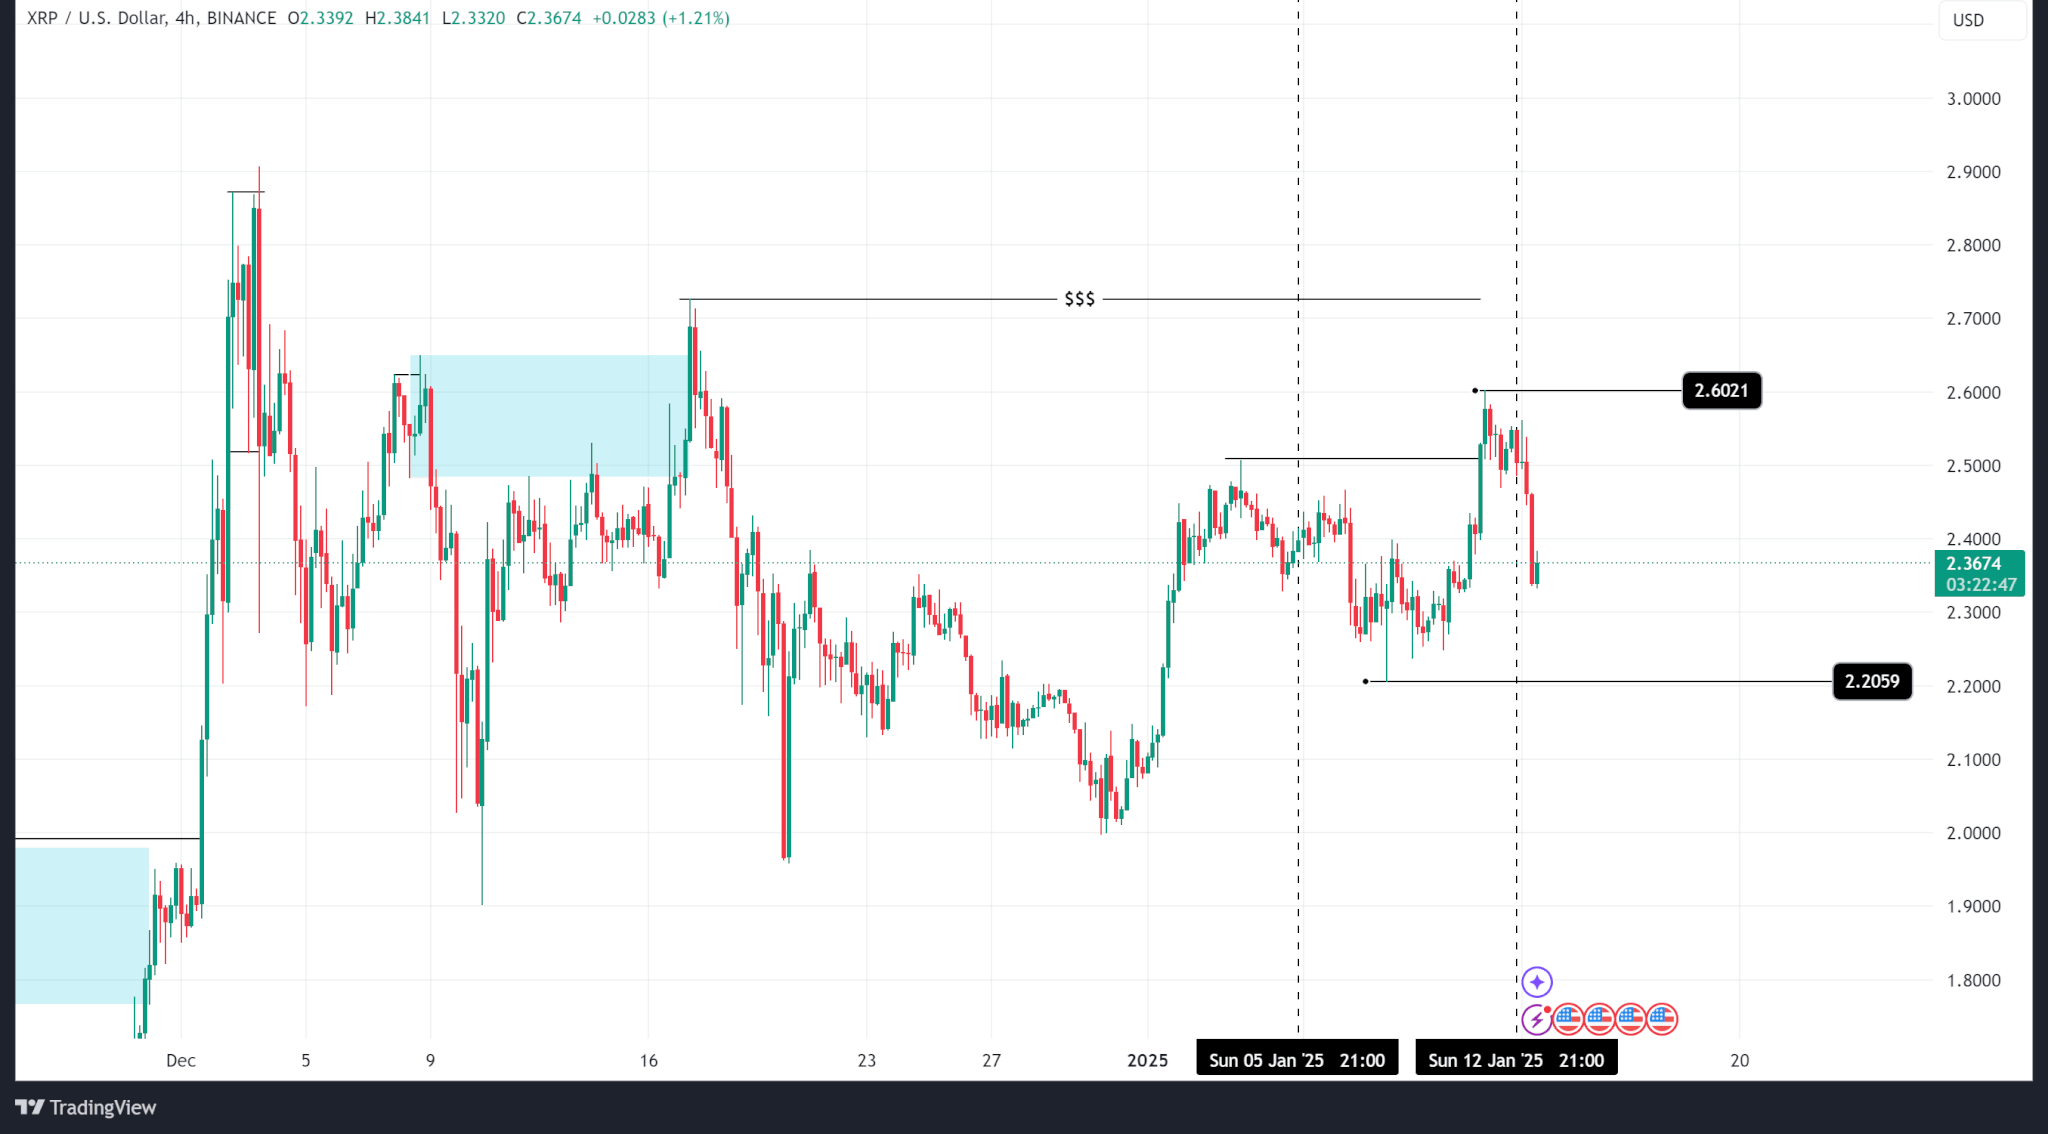
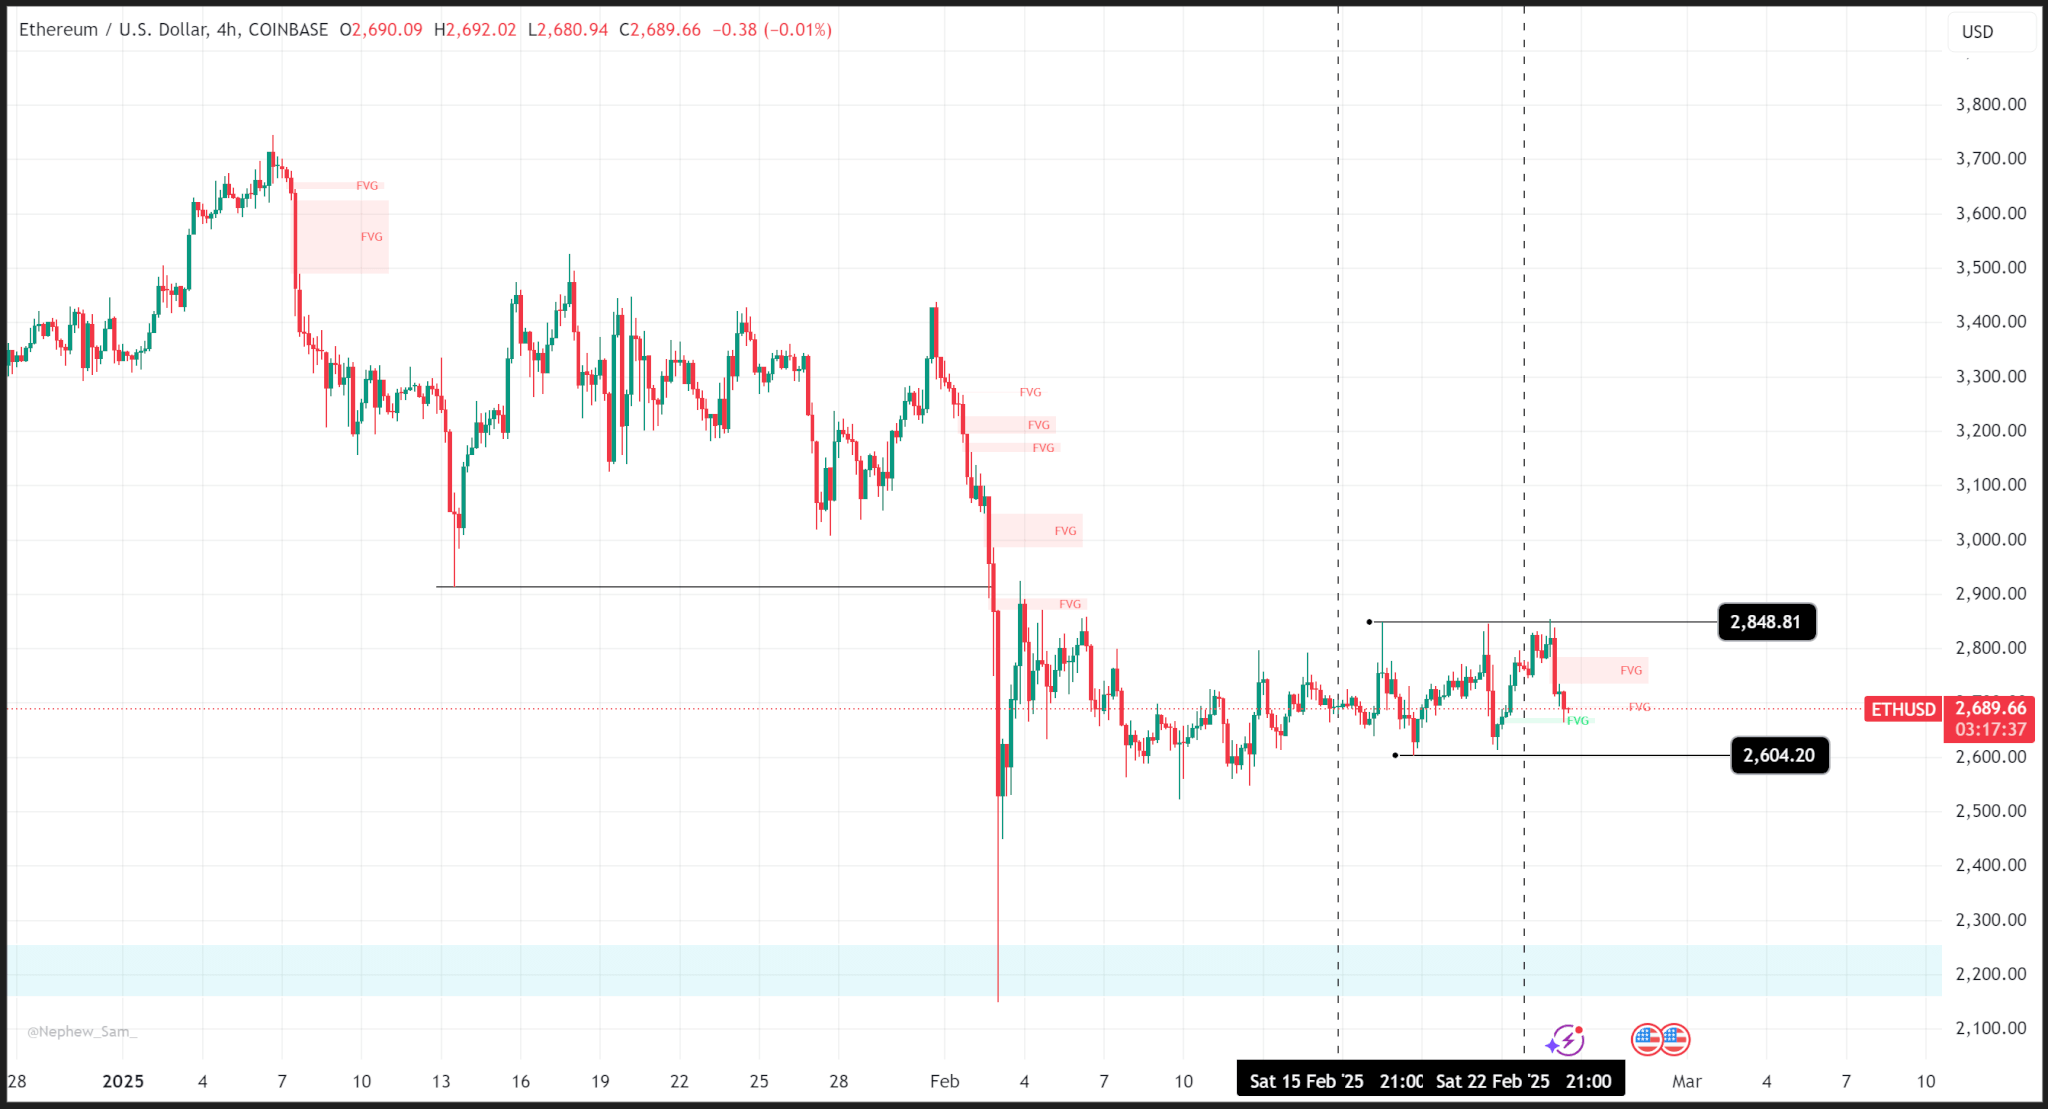
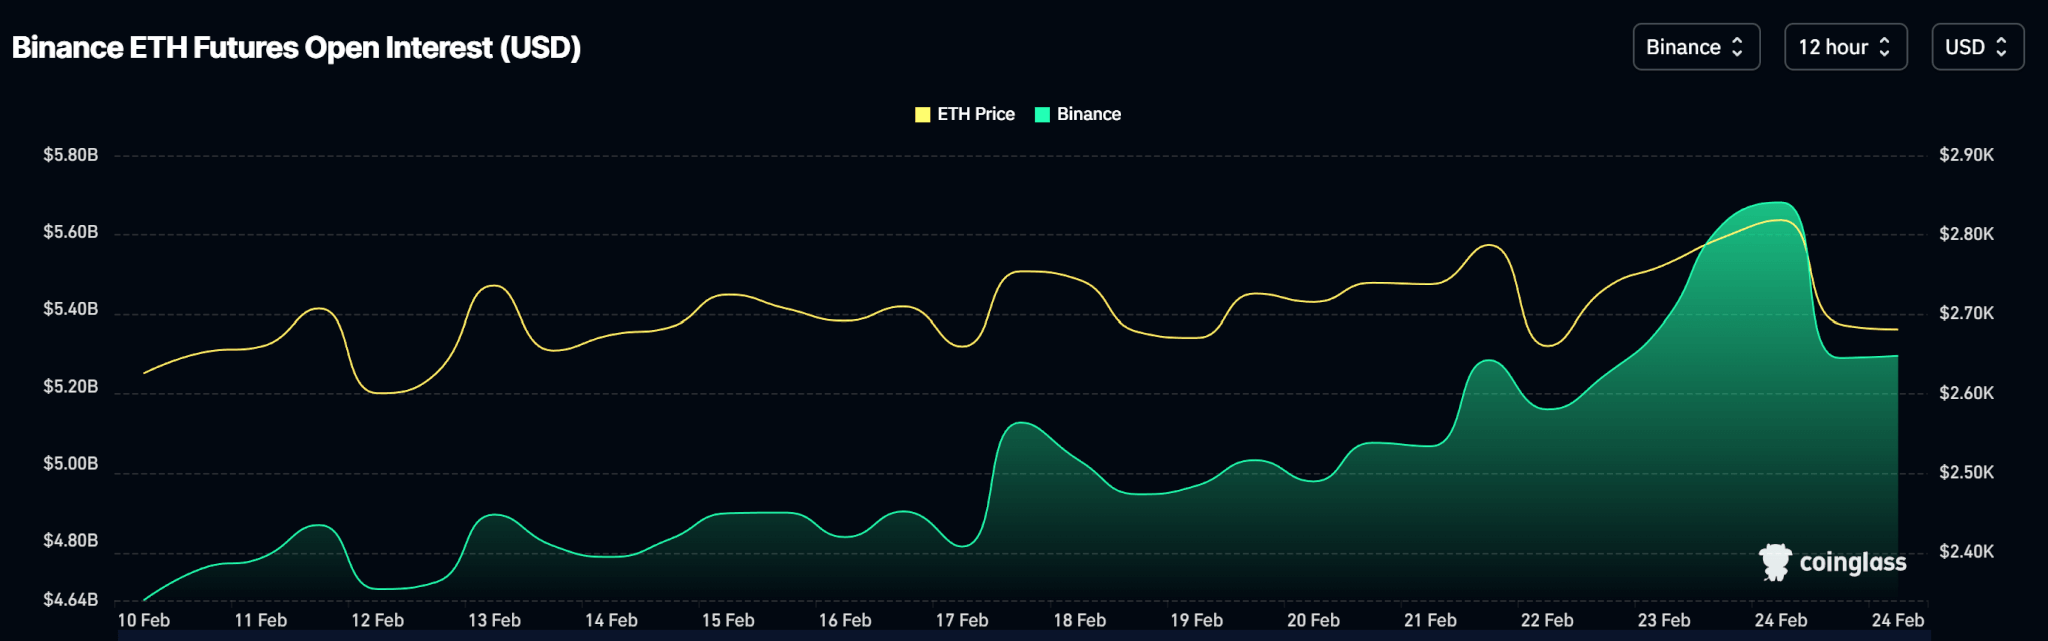
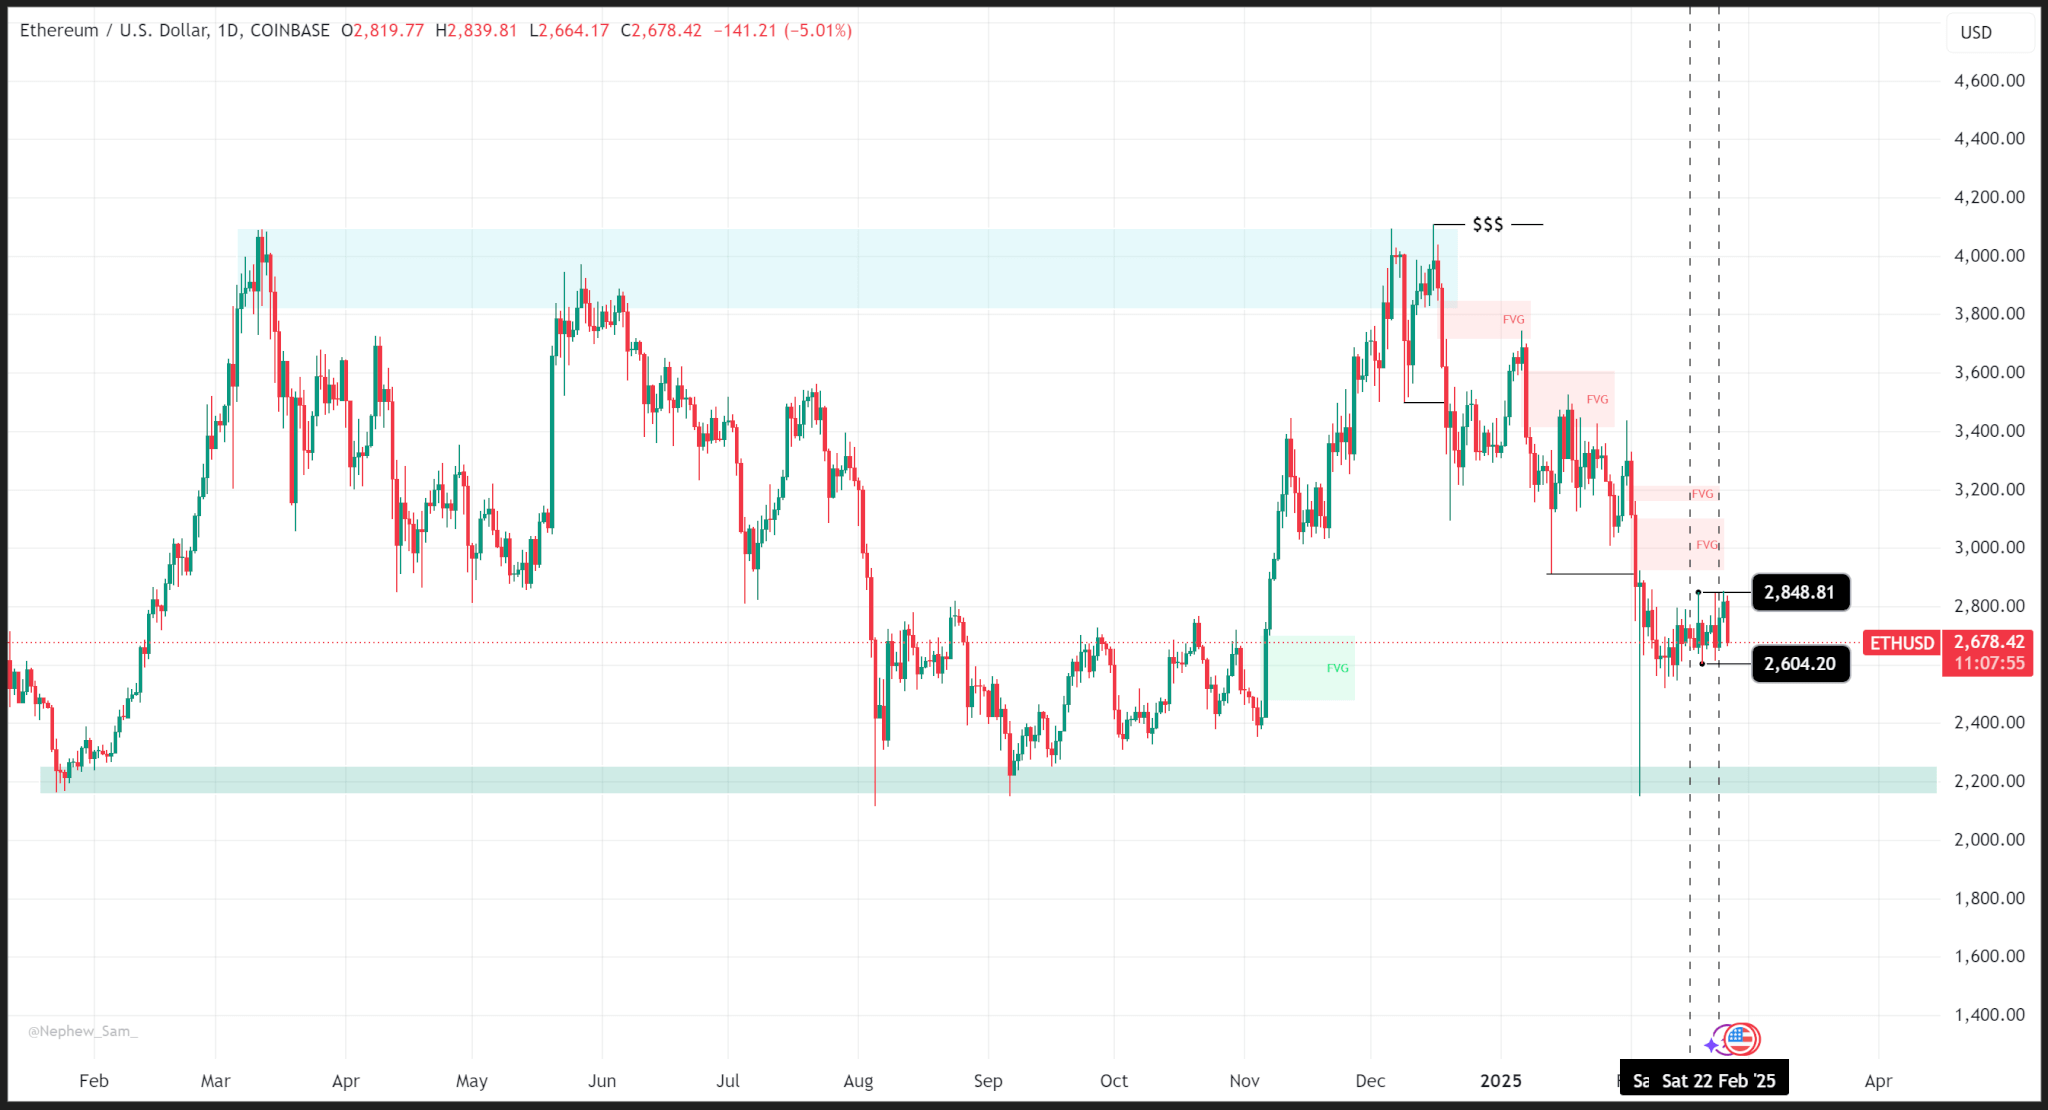
Ethereum’s price action ranged last week logging a weekly high and low of $2,848 and $2,604 despite last week’s news of the Bybit hack.
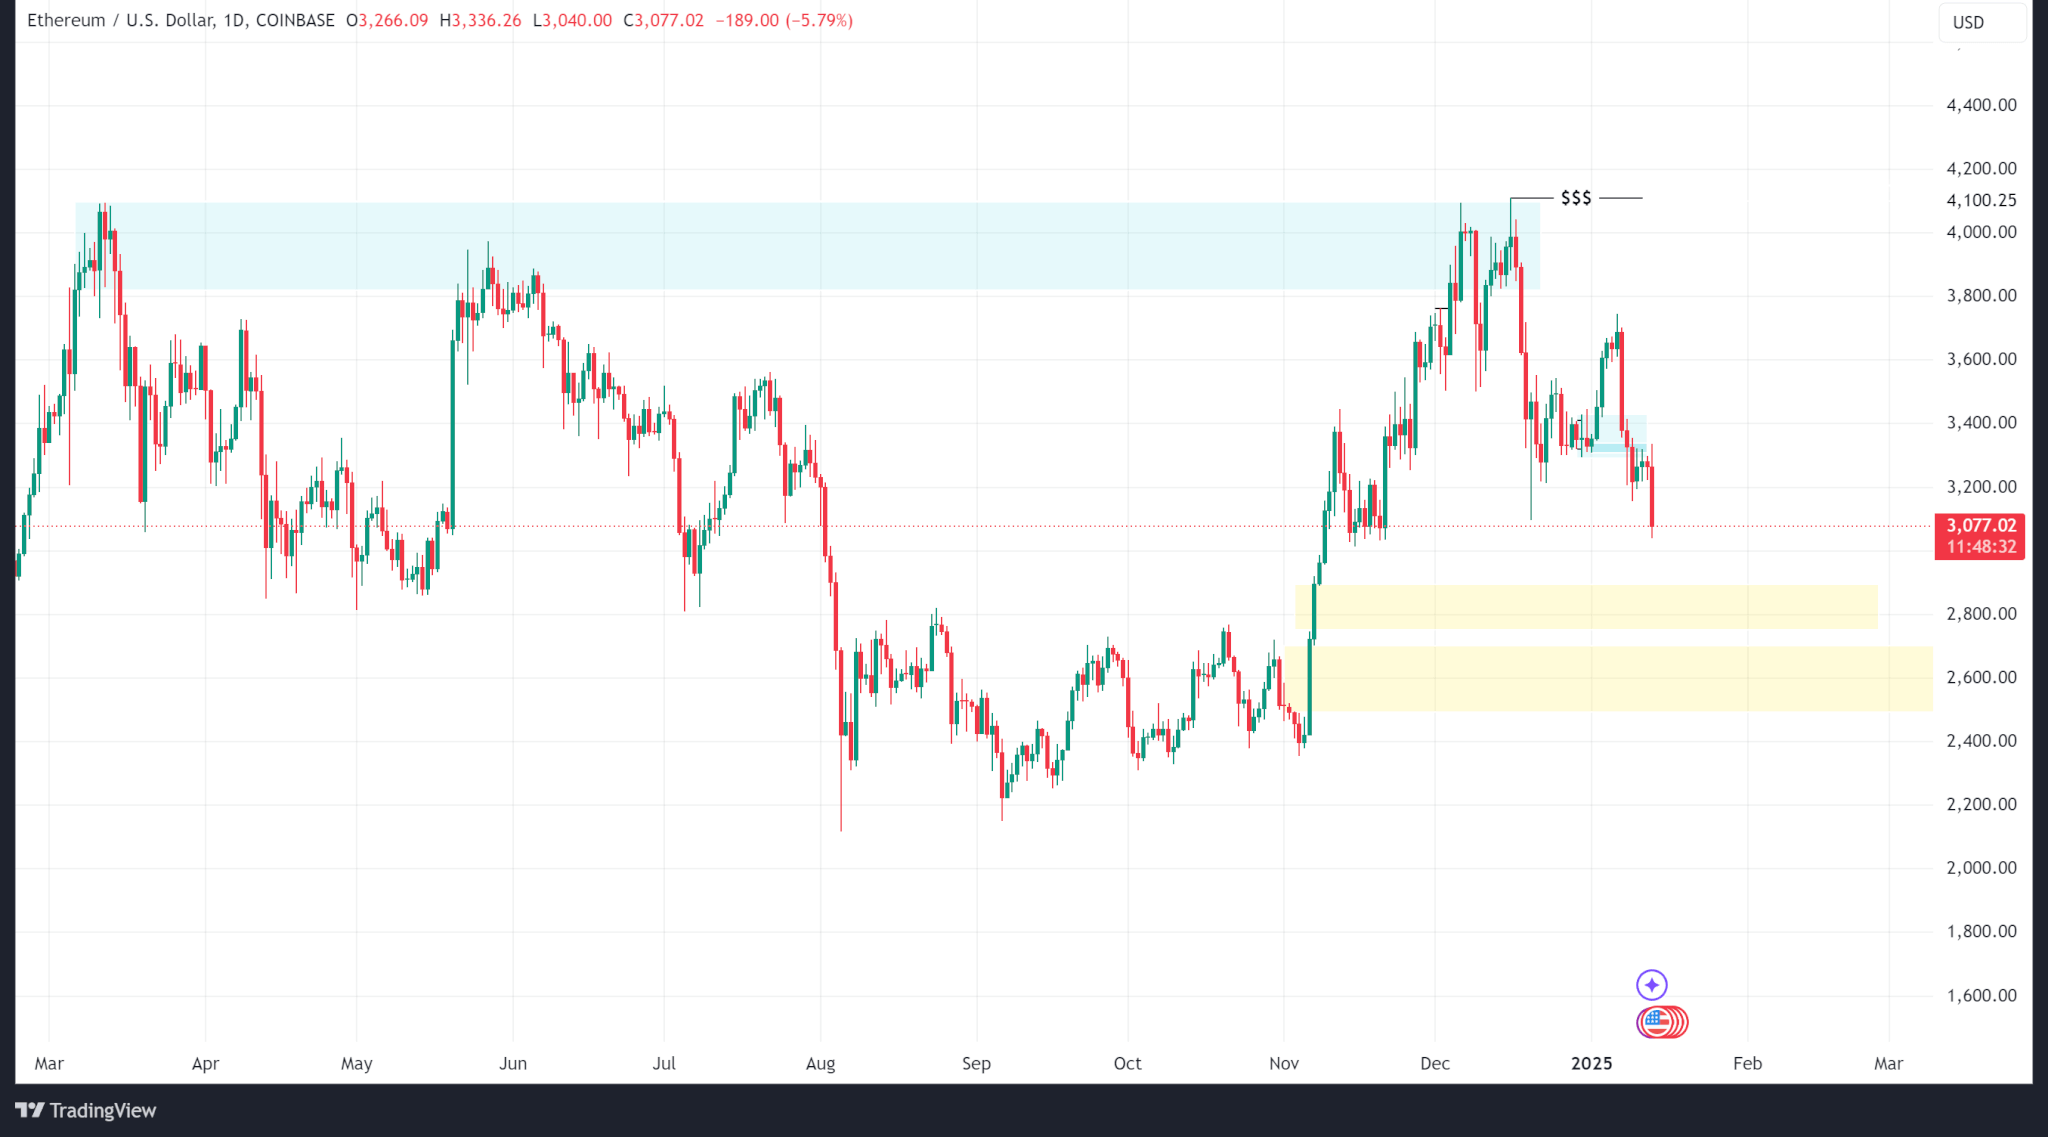
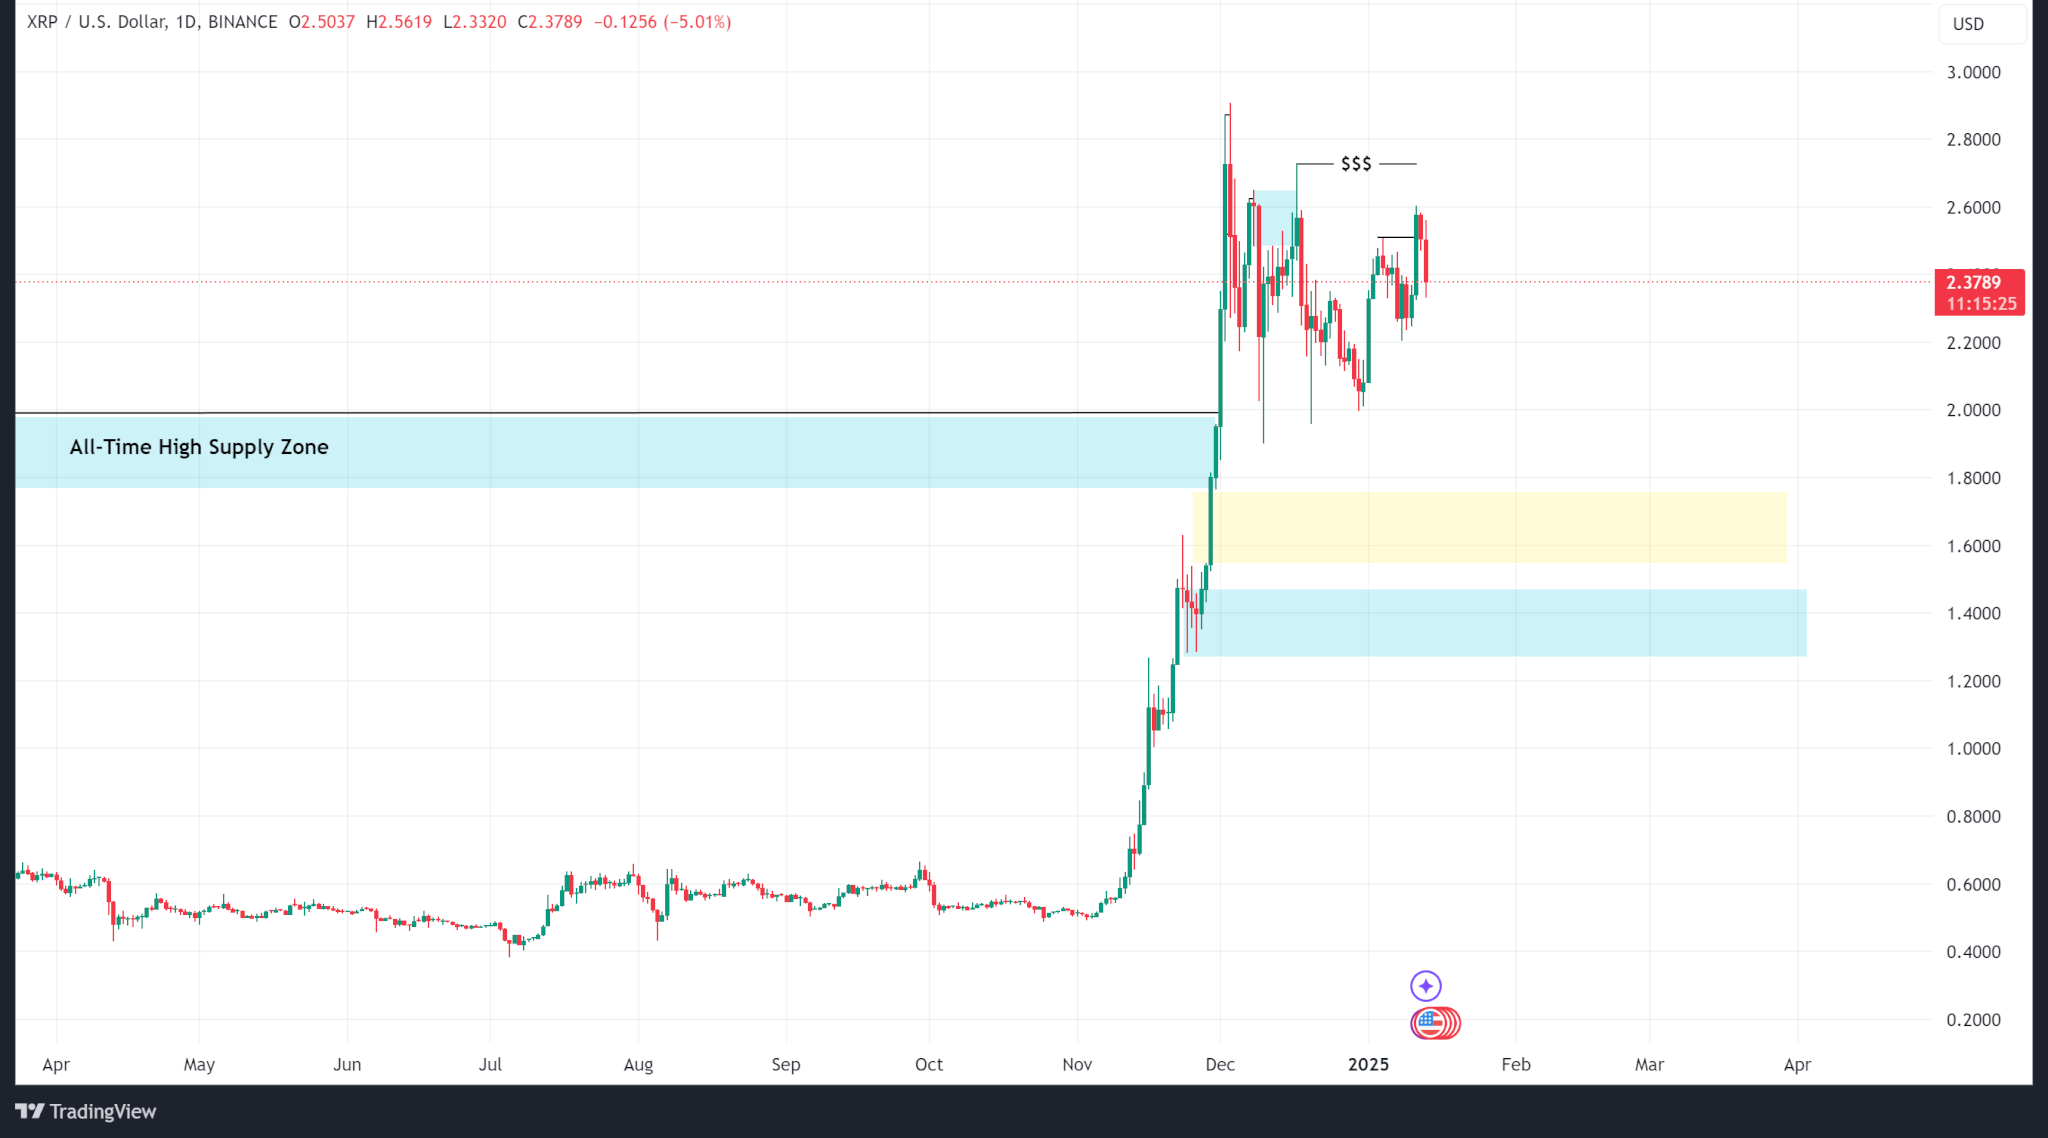
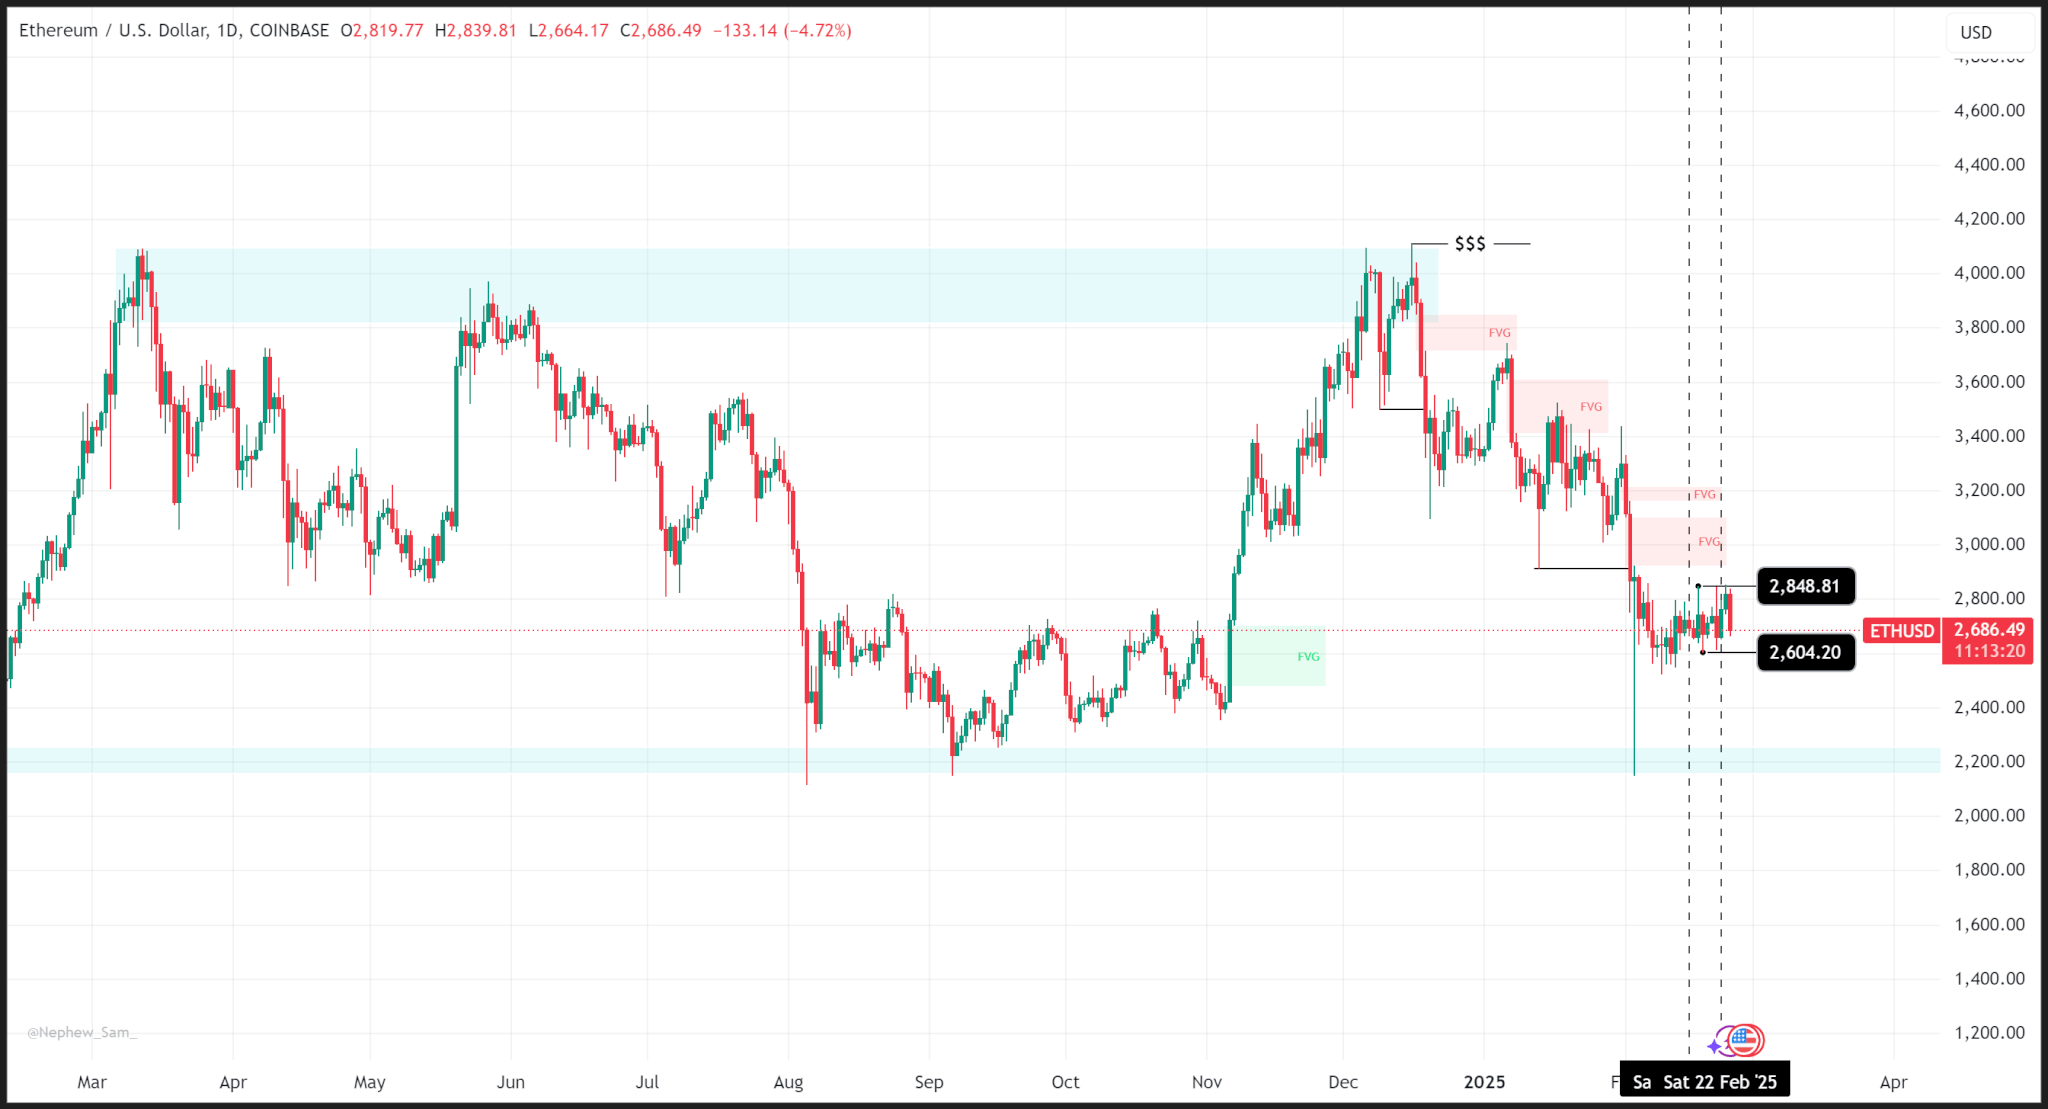
Zooming out, we see a bleaker picture as ETH has been trending lower since December 09 after failing to break above its March 2024 high.
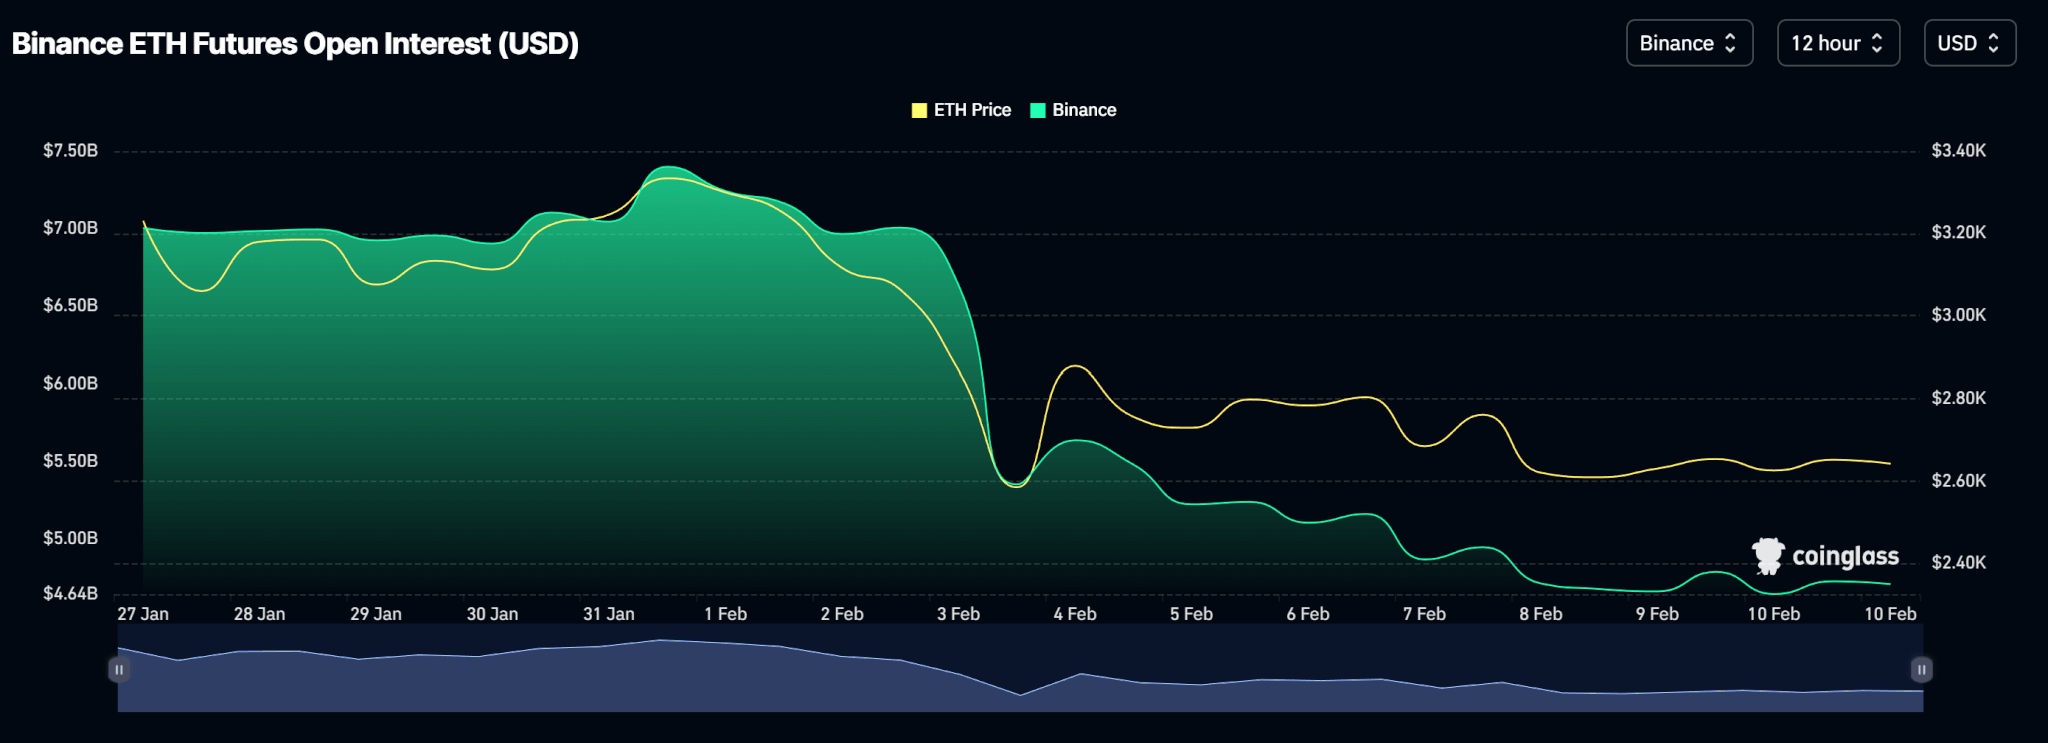
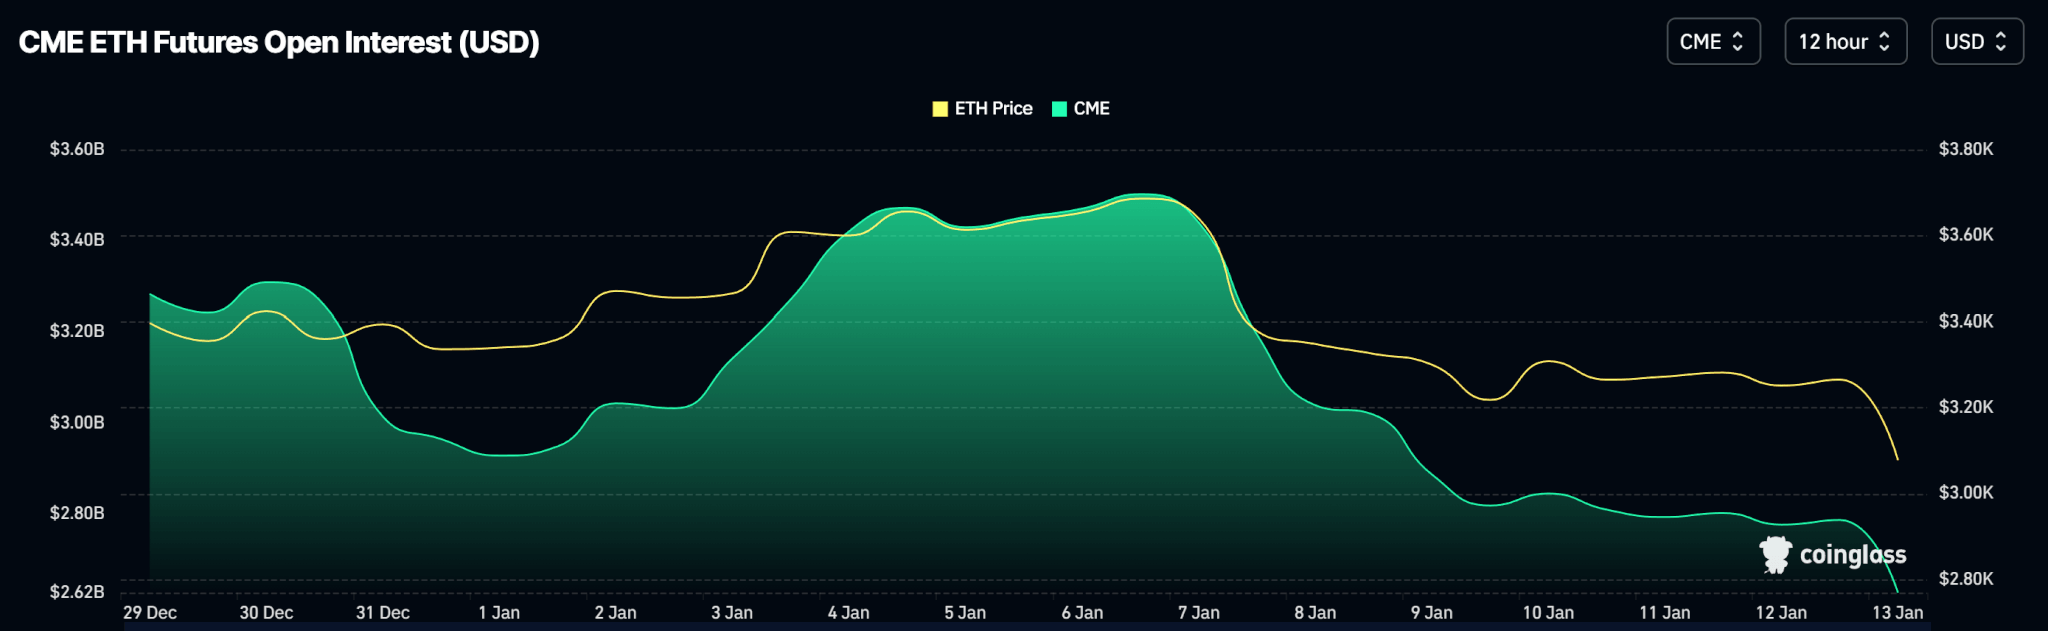
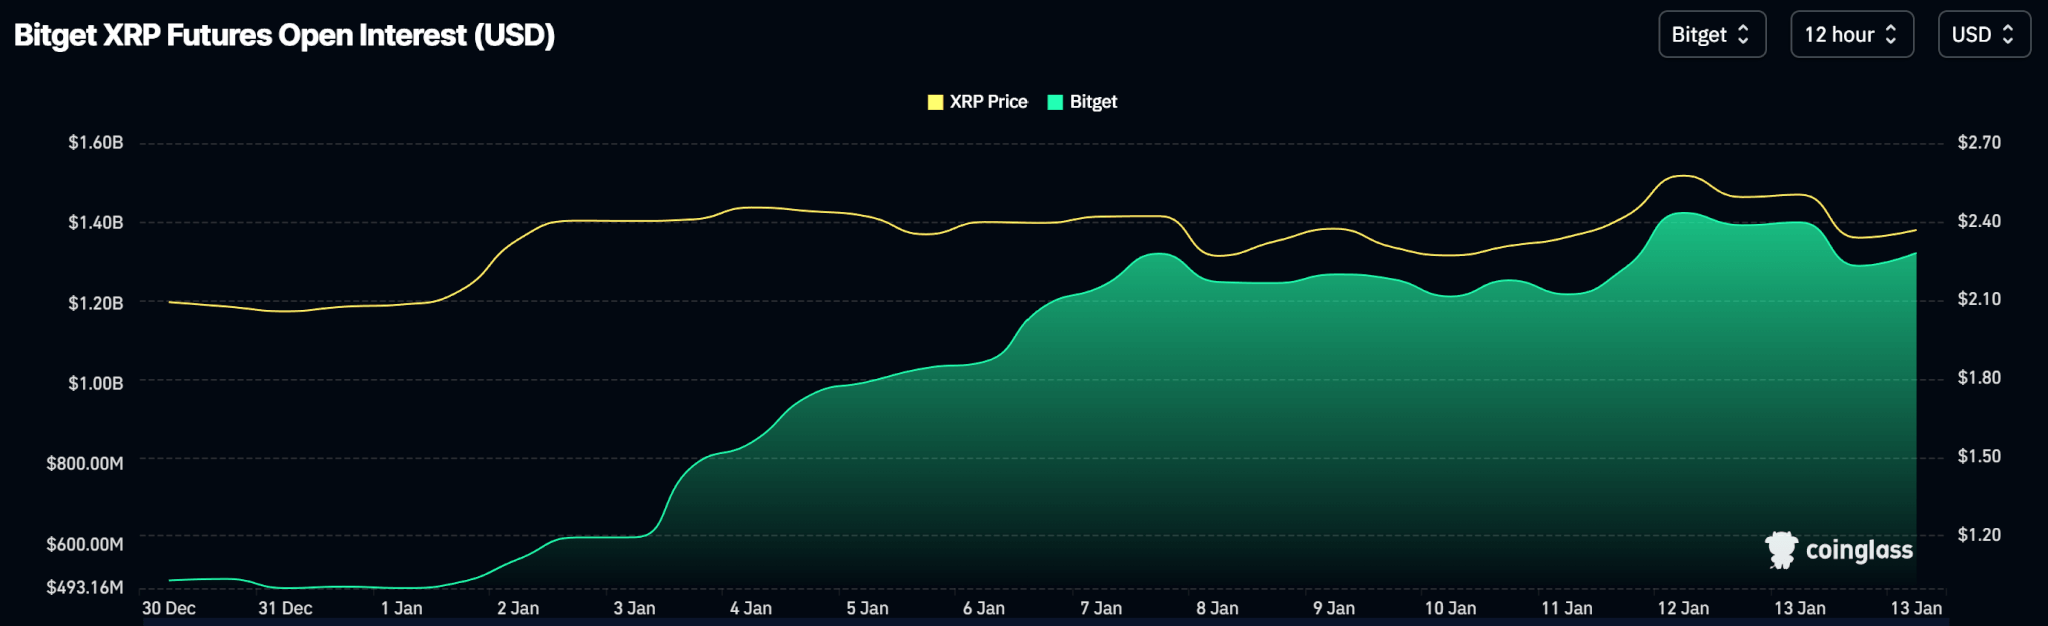
Open interest data shows a steady rise in contract volume throughout the week though price traded rangebound.
Outlook
We reckon the next major support zone for ETH is the $2,500 level which has proven to be a strong liquidity level in the past.
ETH trades at $2,384 as of publishing.
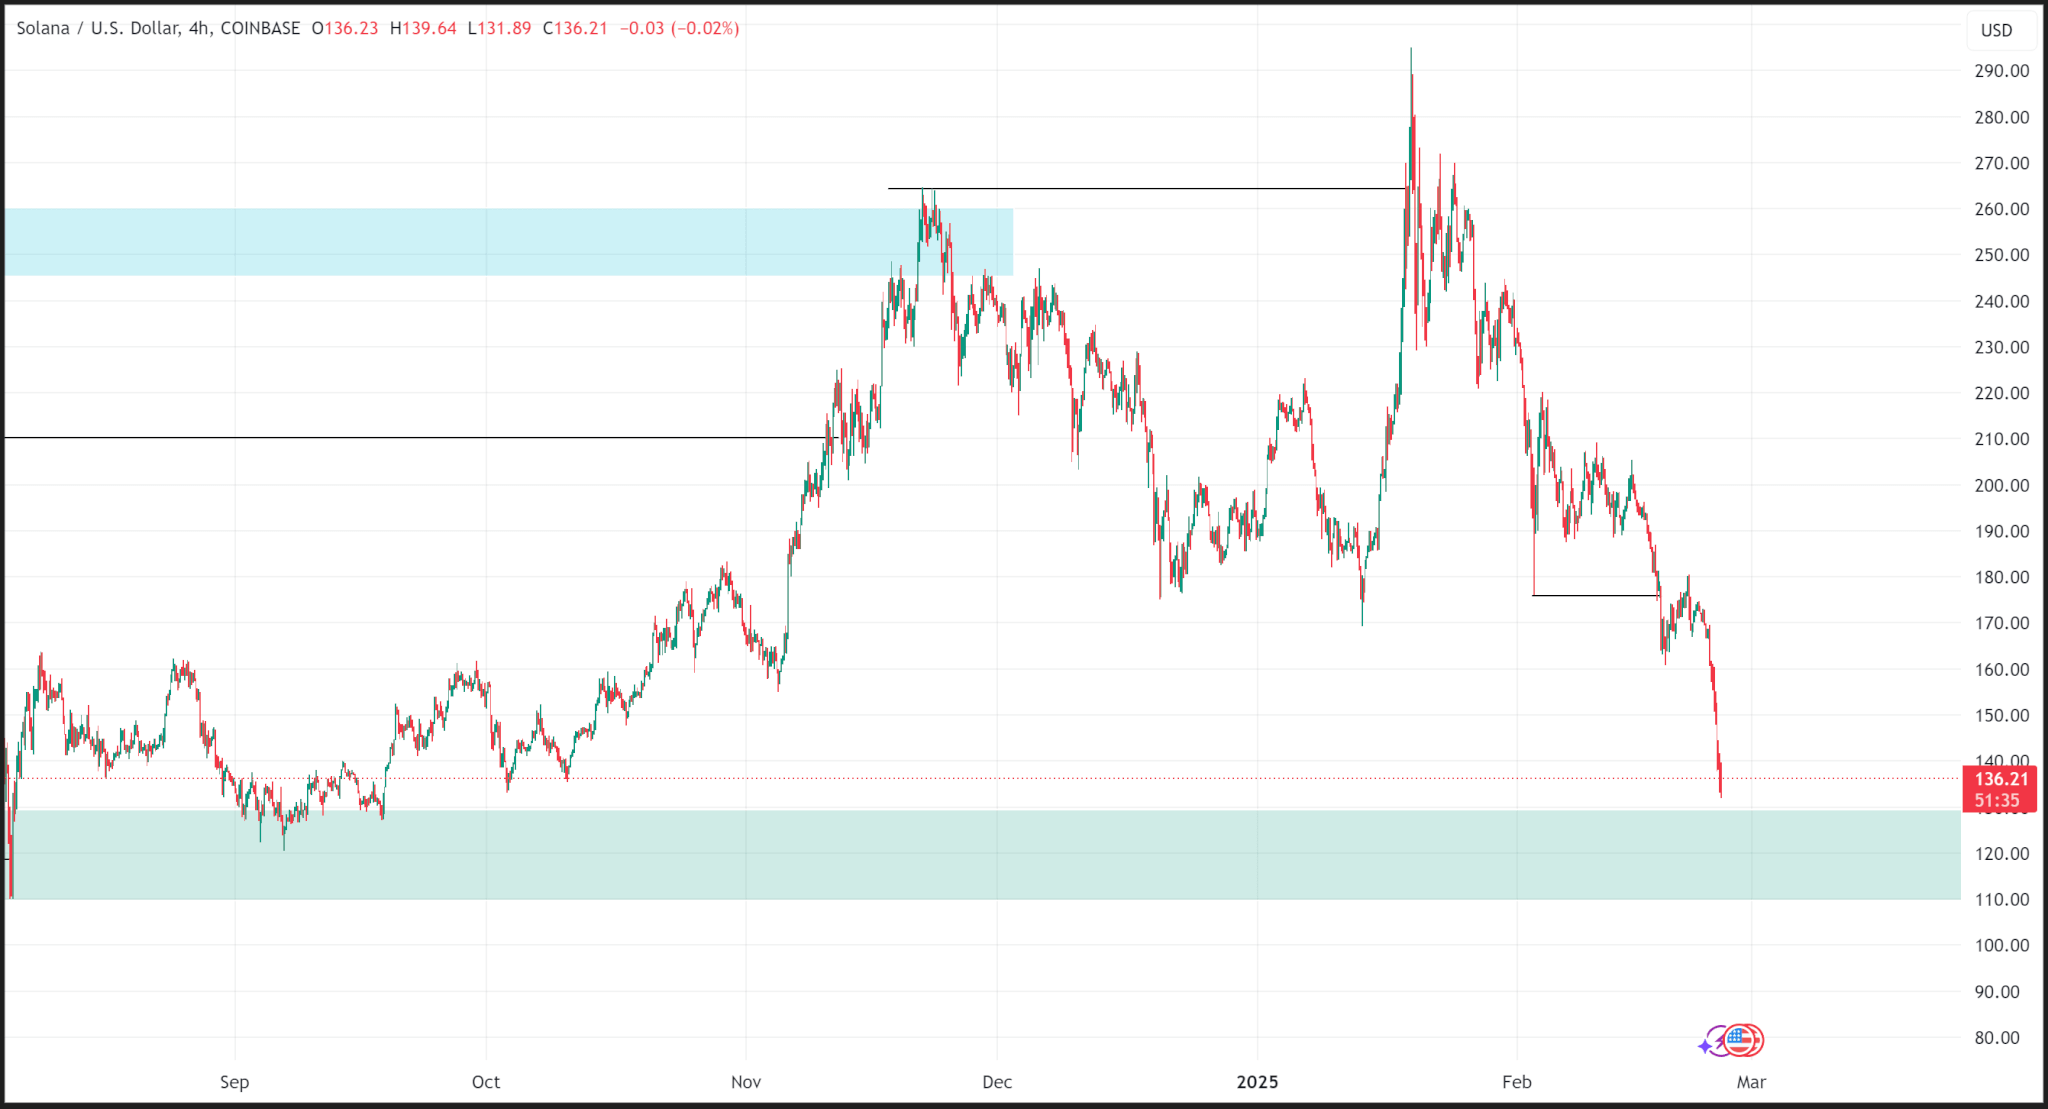
Solana
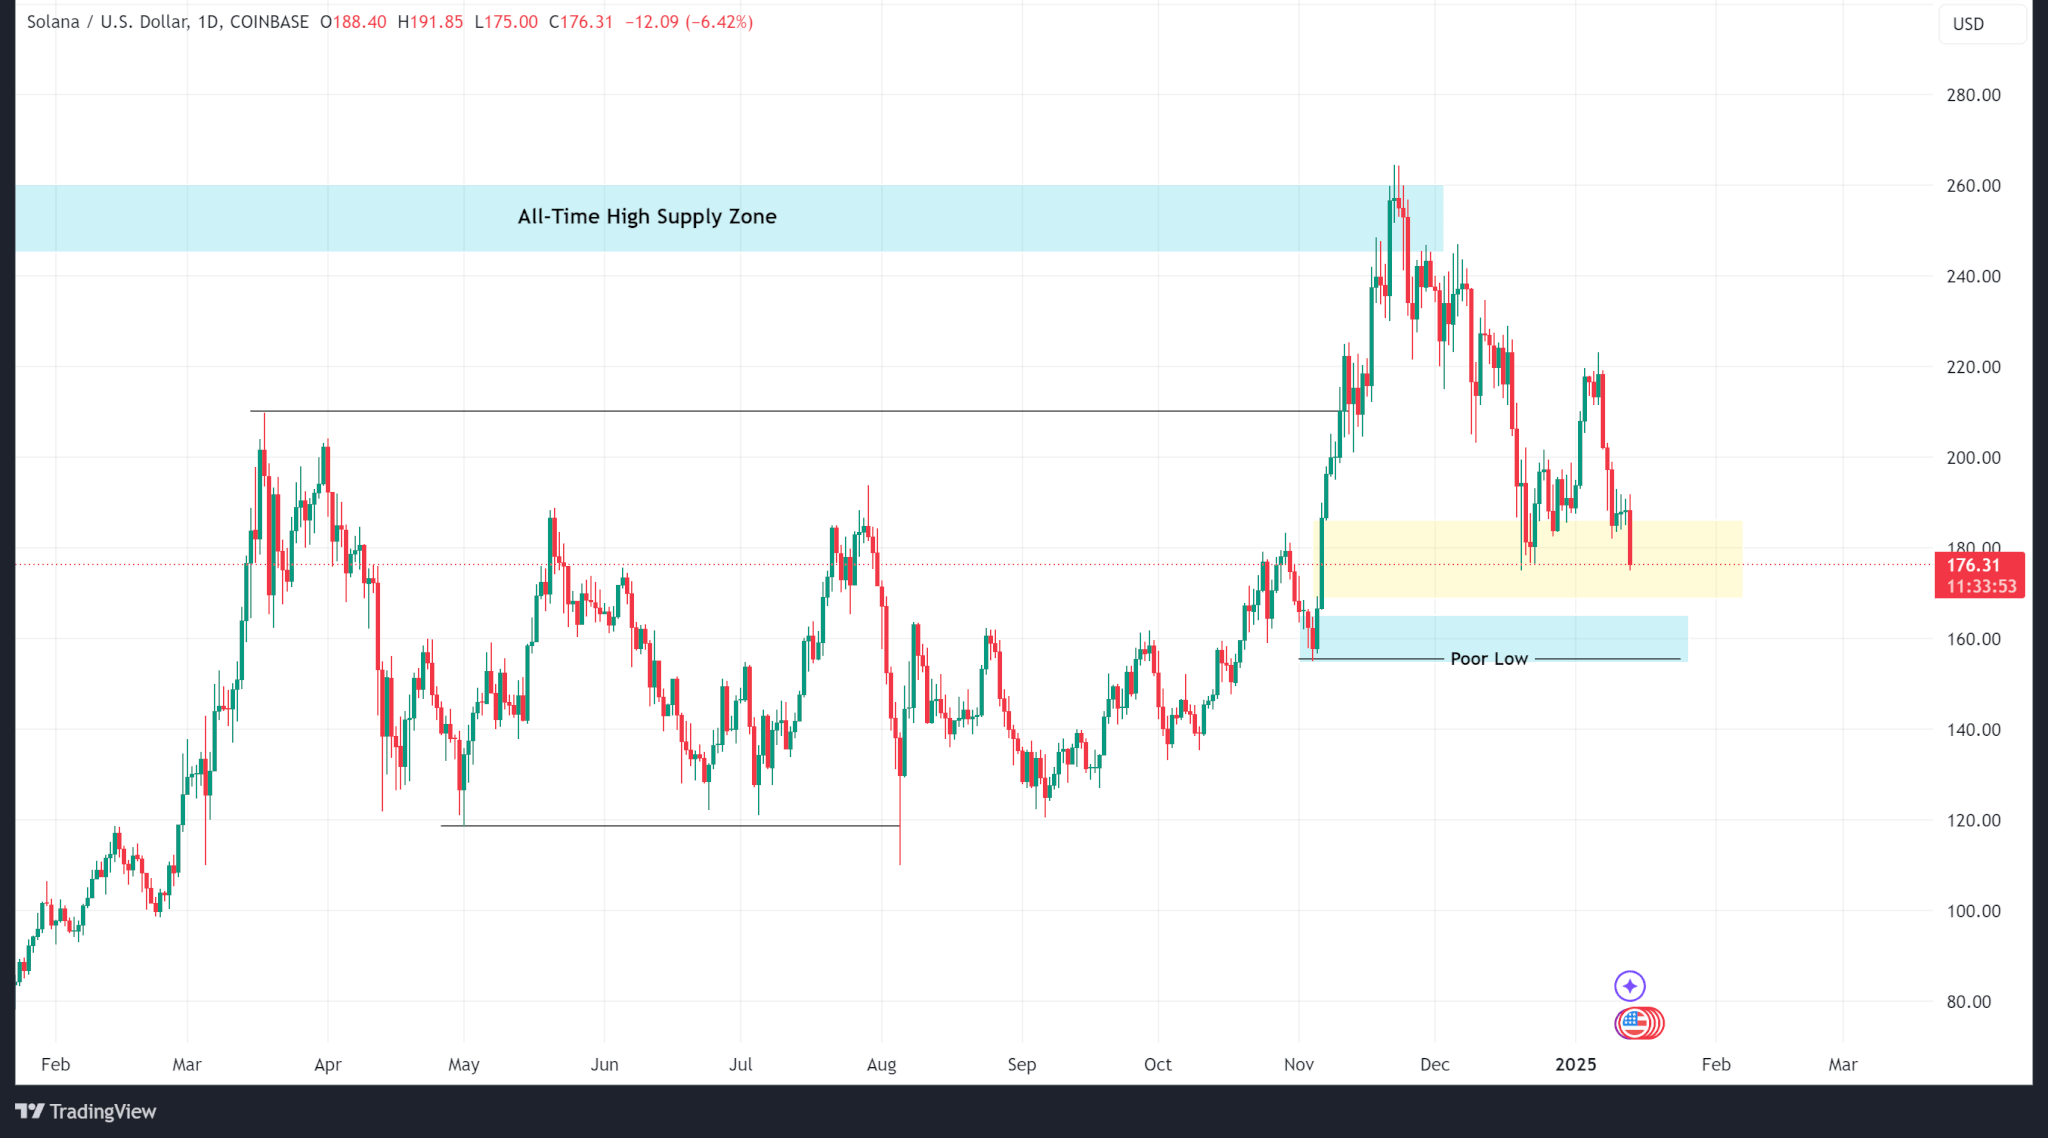
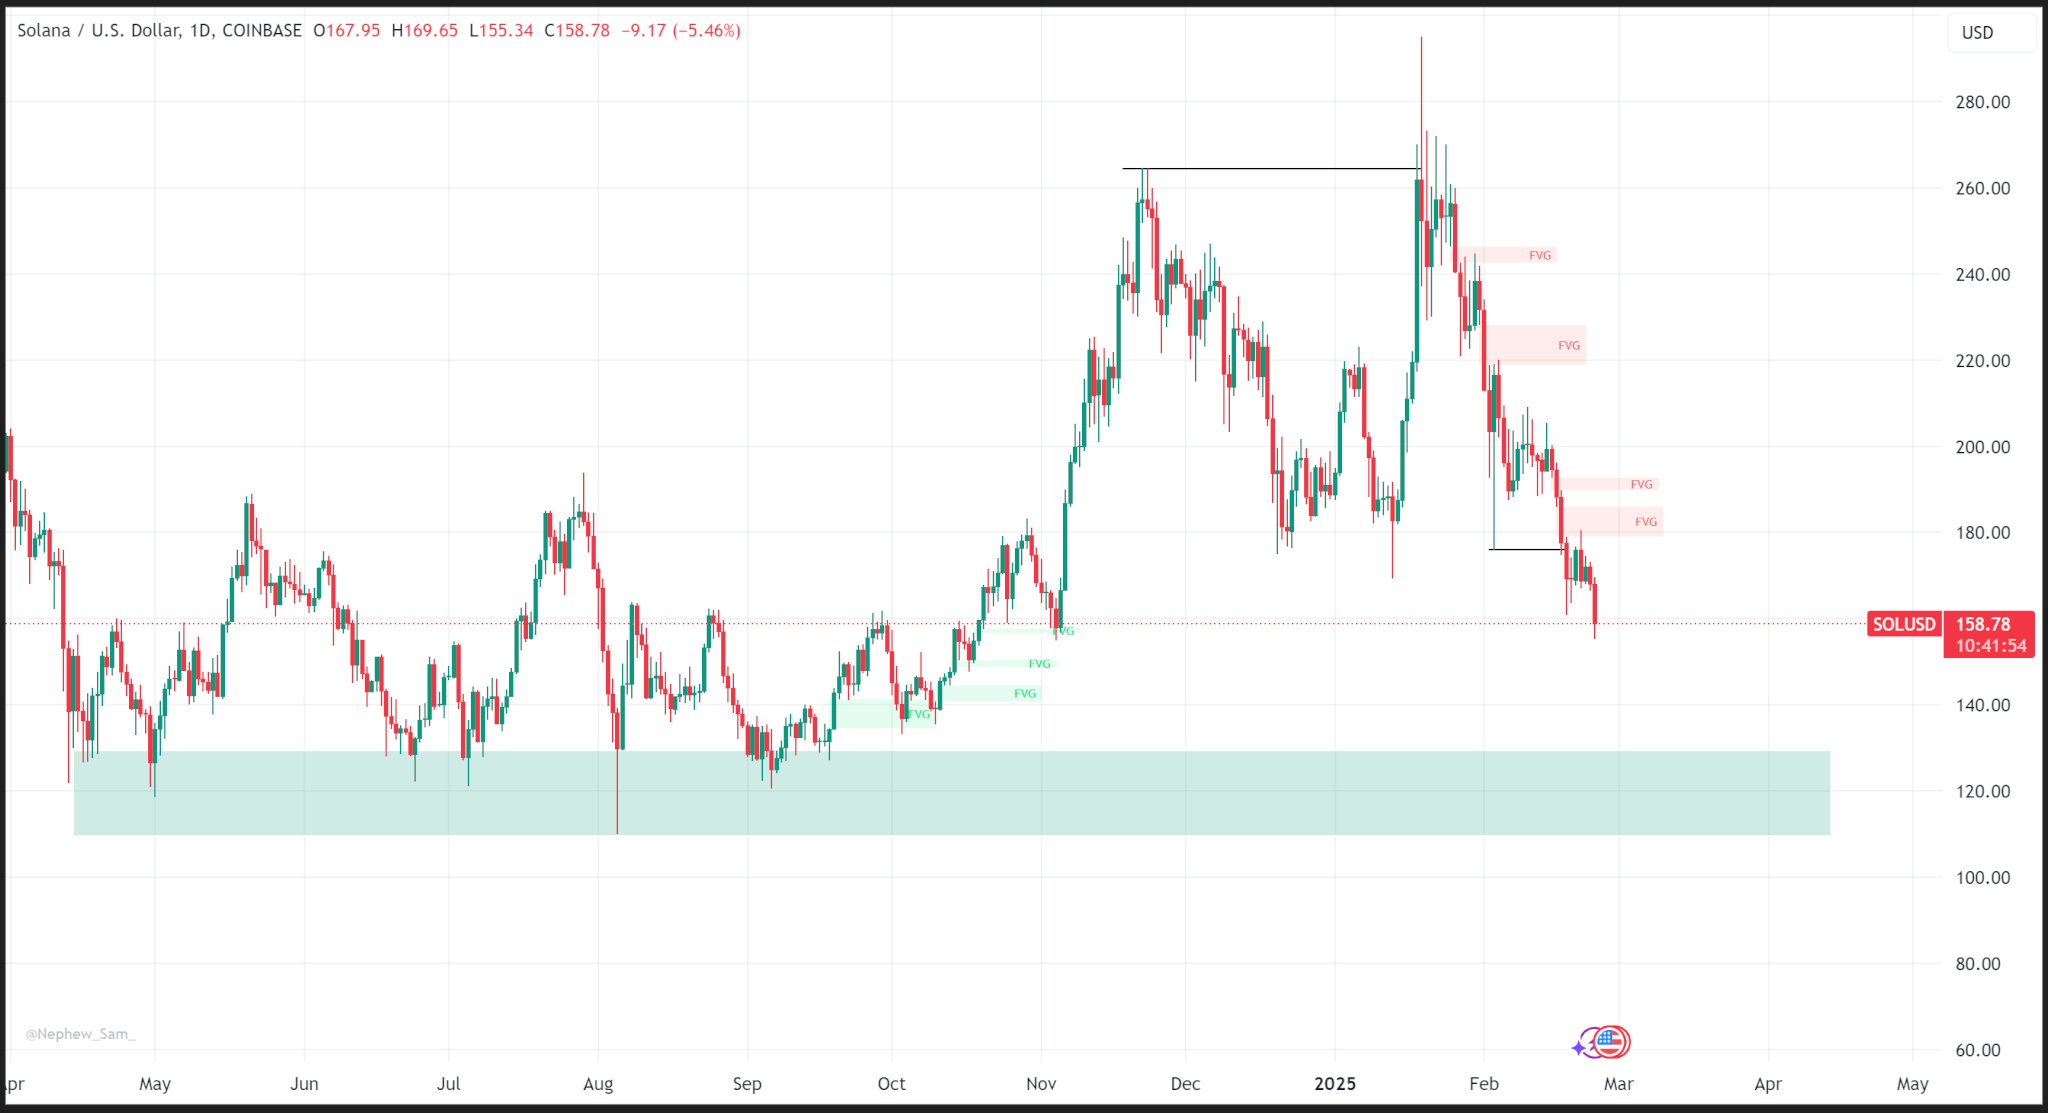
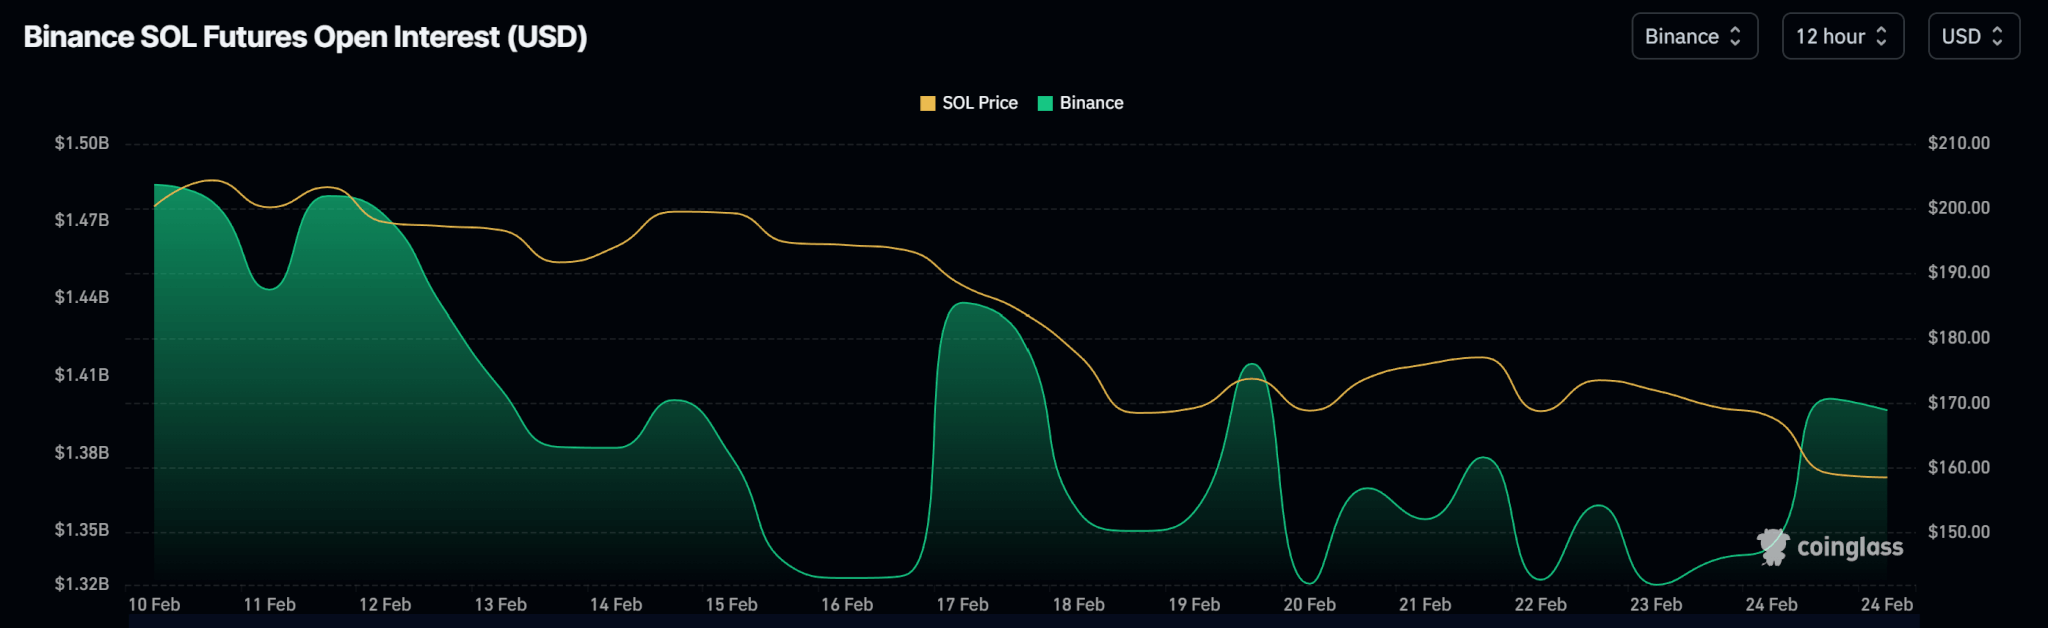
Like Ethereum, Solana’s price has been declining since it failed to swing higher and form new candles above the last all-time high on the daily time frame.
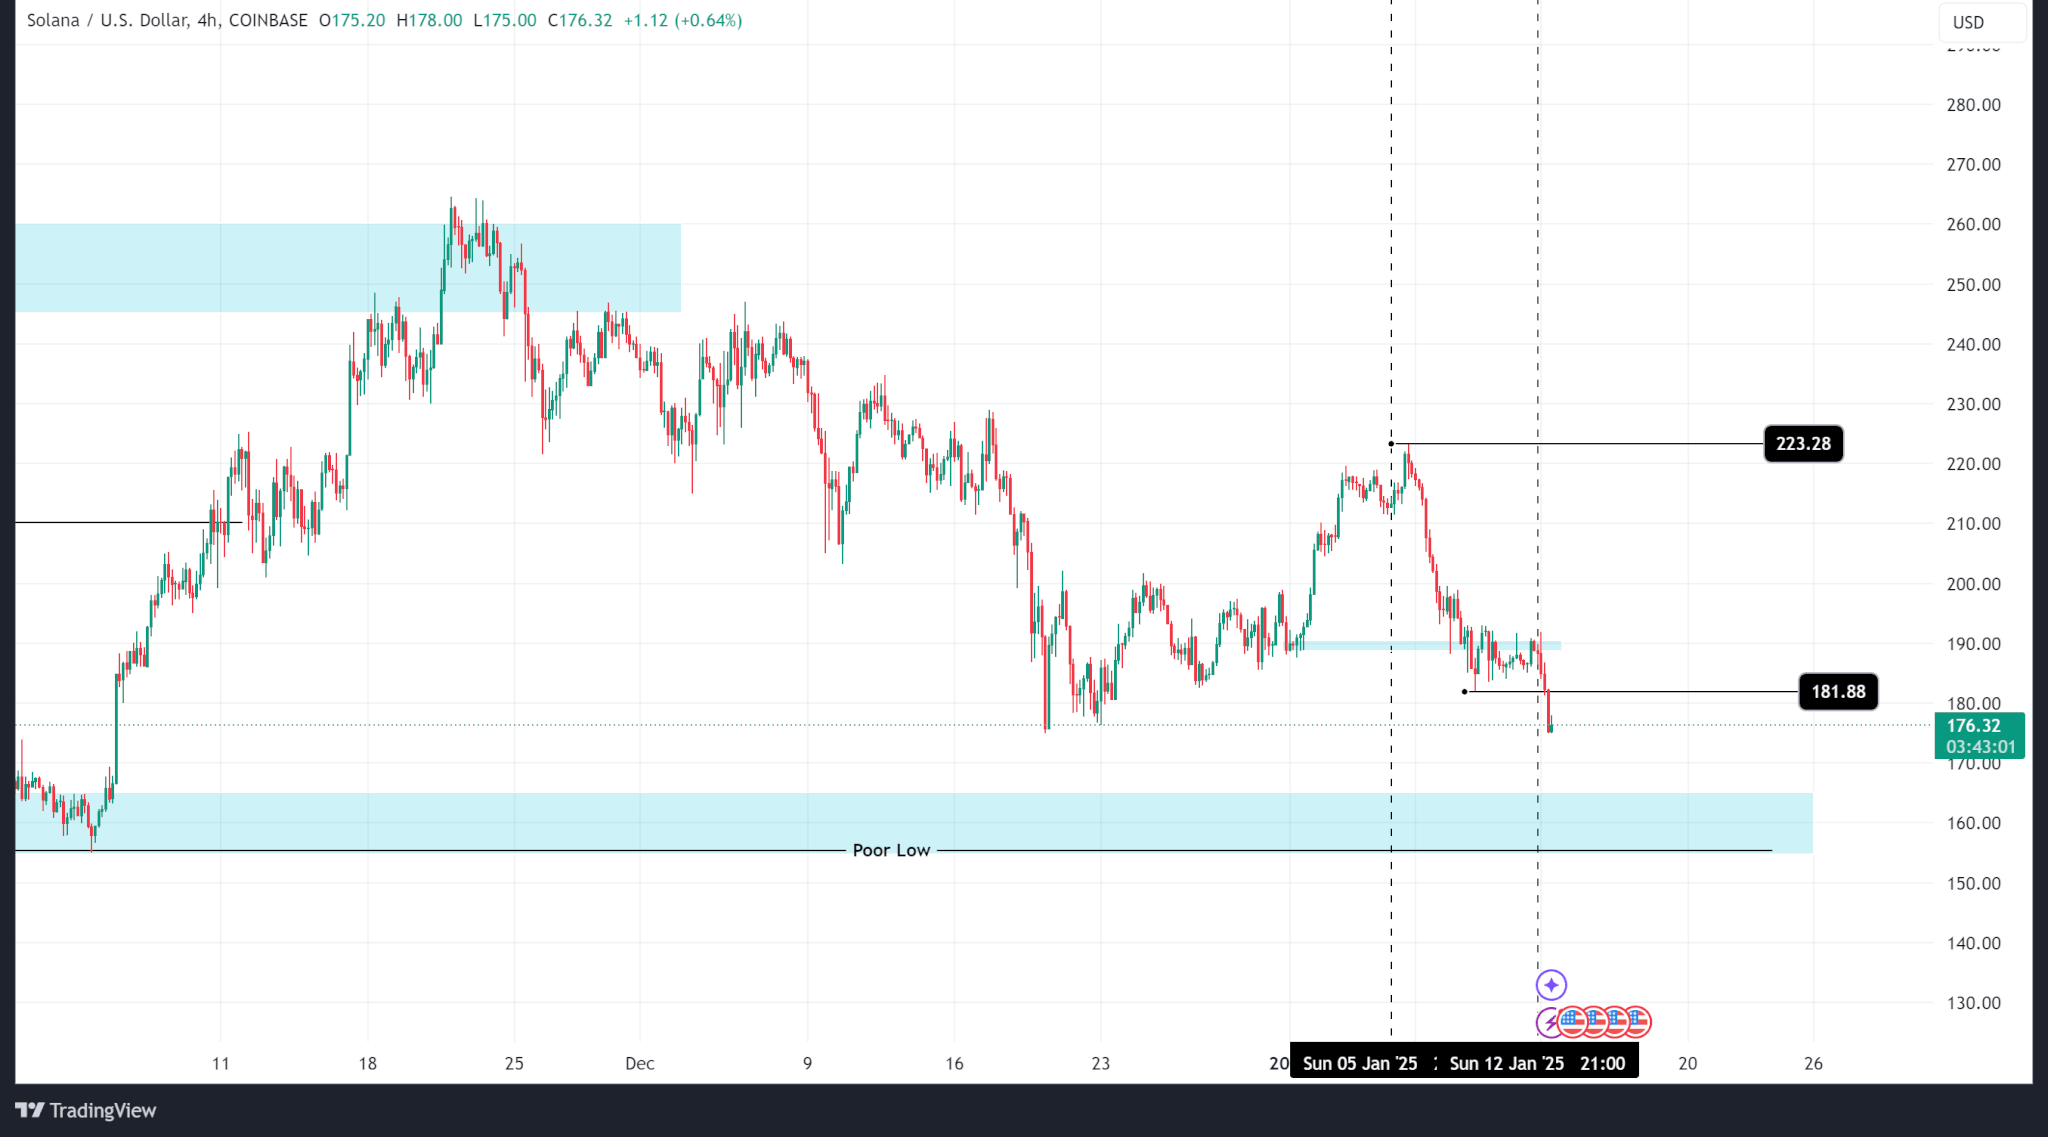
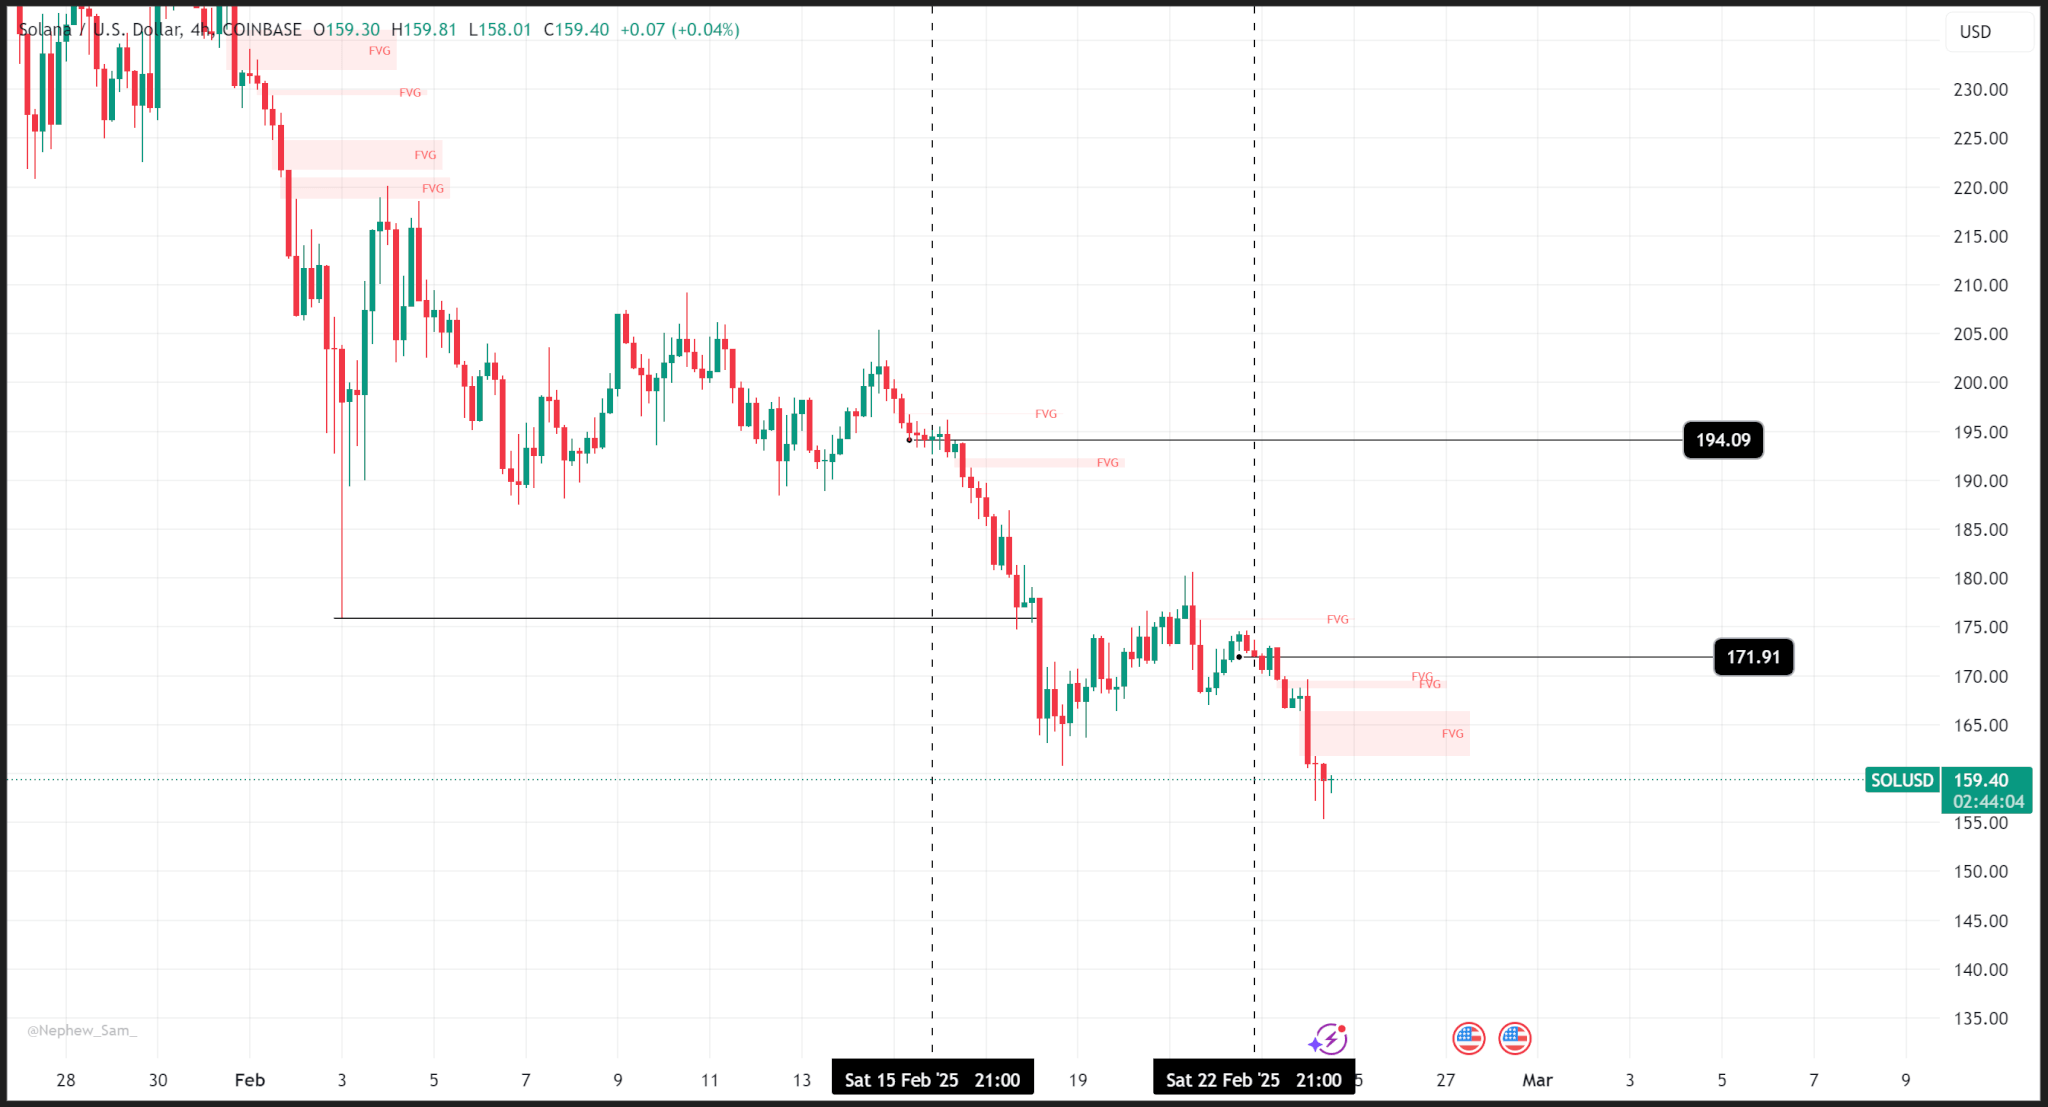
Unlike Ethereum, last week’s price action was bearish as the price fell from a weekly open around $194 to a close around $171.
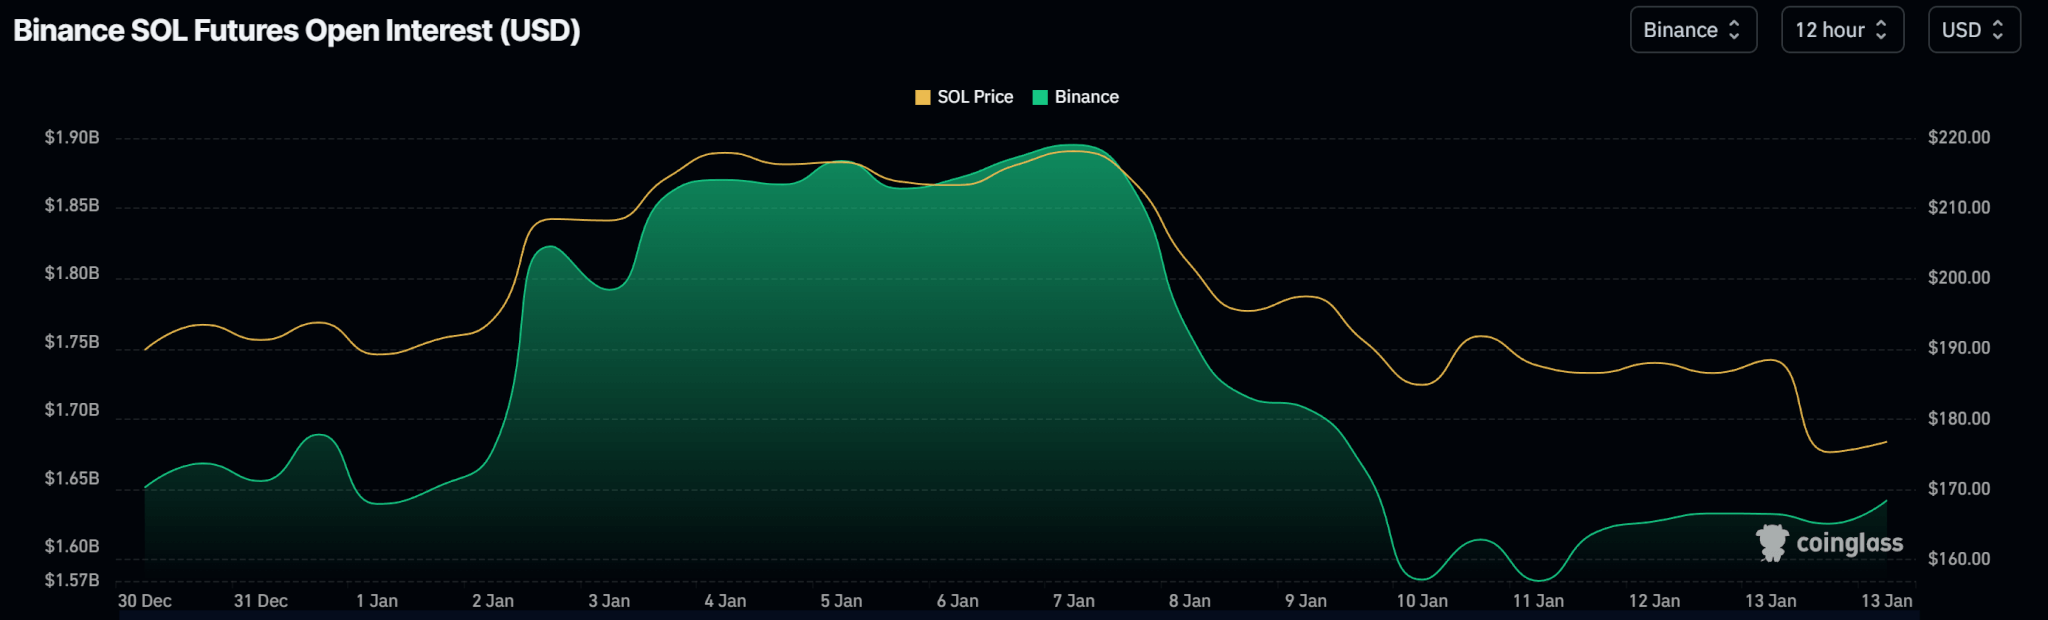
Open interest charts show topsy-turvy movement in open contract volumes as the price falls.
Outlook
The next major support zone for Solana is at the $129 level. However, we may see smaller rallies as price trends lower overall.