Tag: Price
-

Bitcoin price recovery at risk amid new Credit Suisse crisis

-
Bitcoin and other financial assets now have a Credit Suisse problem.
-
Credit Suisse credit default swaps signal that the company could collapse.
-
Credit Suisse stock price plunged by 20% and reached a record low.
Bitcoin price came under intense pressure on Wednesday as the banking sector came under a significant strain. BTC pulled back from the year-to-date high of $26,548, to a low of $24,526. It has retreated by ~7.8% from its highest point this week.
Credit Suisse crisis deepens
Bitcoin price has been in a strong bullish trend in the past few days as investors reacted to the ongoing performance in the banking sector. After falling to a low of $19,500 last week, the coin made a spectacular recovery as it jumped to a high of $26,548.
This rally happened after America’s regulators decided to bailout key banks like Silicon Valley Bank (SVB) and Signature Bank. They decided to provide a backstop for their depositors, many of whom were companies in the crypto industry, as we wrote here.
The most important part of the bailout was the fact that it saved USD Coin, the second-biggest stablecoin in the world. Circle, the parent company of USDC, had over $3.3 billion deposited in the company. If it had failed, the ripple effect on the crypto industry would have been dire.
Now, it seems like we have another bank crisis. Credit Suisse stock price plunged by more than 20% after the company lost confidence of another key investor. Earlier this month, the company’s biggest shareholder, Harris Associates, decided to sell its entire stake.
And on Wednesday, Saudi National Bank said that it will not provide more finance to the company. Therefore, there are significant risks that the company will fall. Indeed, its credit default swaps have risen, signaling that investors expect the bank to fall.
A collapse of Credit Suisse would have some positives for Bitcoin prices. For one, it will lead to a pause in interest rate hikes by the Fed and other central banks.
Bitcoin price forecast
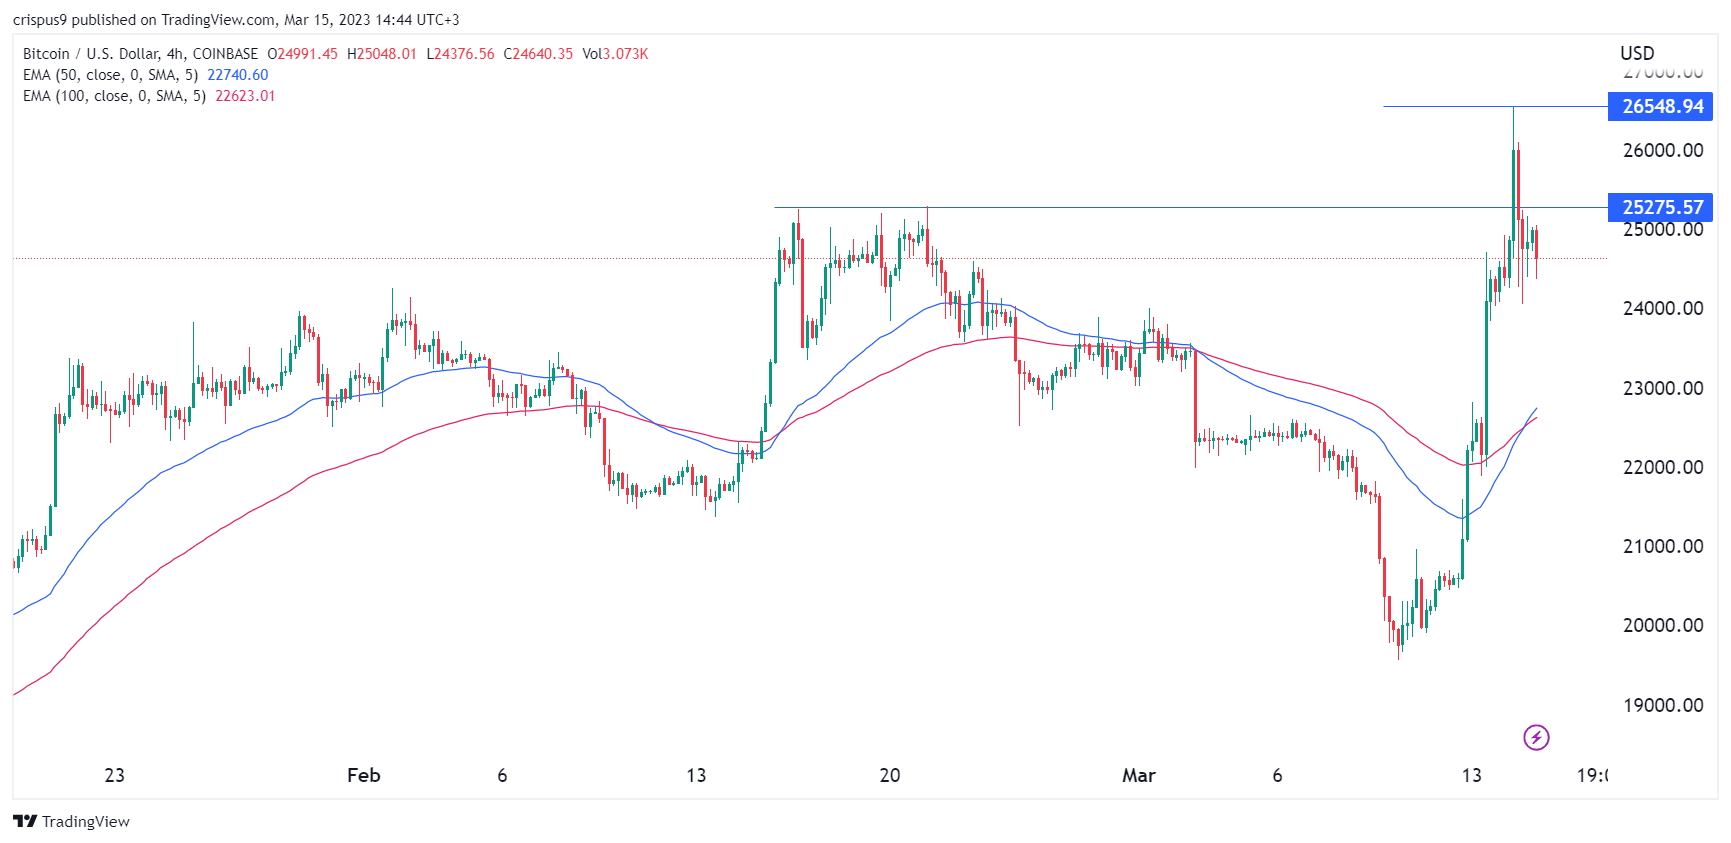
The BTC/USD price soared to a high of 26,548 on Tuesday and then pulled back to a low of 24,102. As it dropped, BTC moved below the key support level at 25,275, the highest point in February. On a positive note, the pair’s 50-day and 100-day moving averages have formed a bullish crossover. The coin has also formed what looks like a small head and shoulders pattern.
Therefore, I suspect that it will continue falling in the next key support at $23,000. A move above the key resistance point at 25,275 will invalidate the bearish view.
How to buy Bitcoin
eToro
eToro offers a wide range of cryptos, such as Bitcoin, XRP and others, alongside crypto/fiat and crypto/crypto pairs. eToro users can connect with, learn from, and copy or get copied by other users.
Public
Public is an investing platform that allows you to invest stocks, ETFs, crypto, and alternative assets like fine art and collectibles—all in one place.
-
-

Bitcoin price surges to $26K as bulls react to CPI data

- Bitcoin price hit highs of $26,553 on Coinbase, with 16% upside in 24 hours.
- US inflation data showed CPI rose 6% in the past 12 months in February.
- On-chain data suggests BTC price could rally to $30,000 in the short term.
Bitcoin rose sharply on Tuesday, breaking past $26,000 as the crypto market reacted positively to the latest Consumer Price Index (CPI) data by the US Department of Labor.
Bitcoin breaks $26k amid market reaction to CPI data
According to data from TradingView, the price of Bitcoin spiked 16% to highs of $26,553 on the cryptocurrency Coinbase.
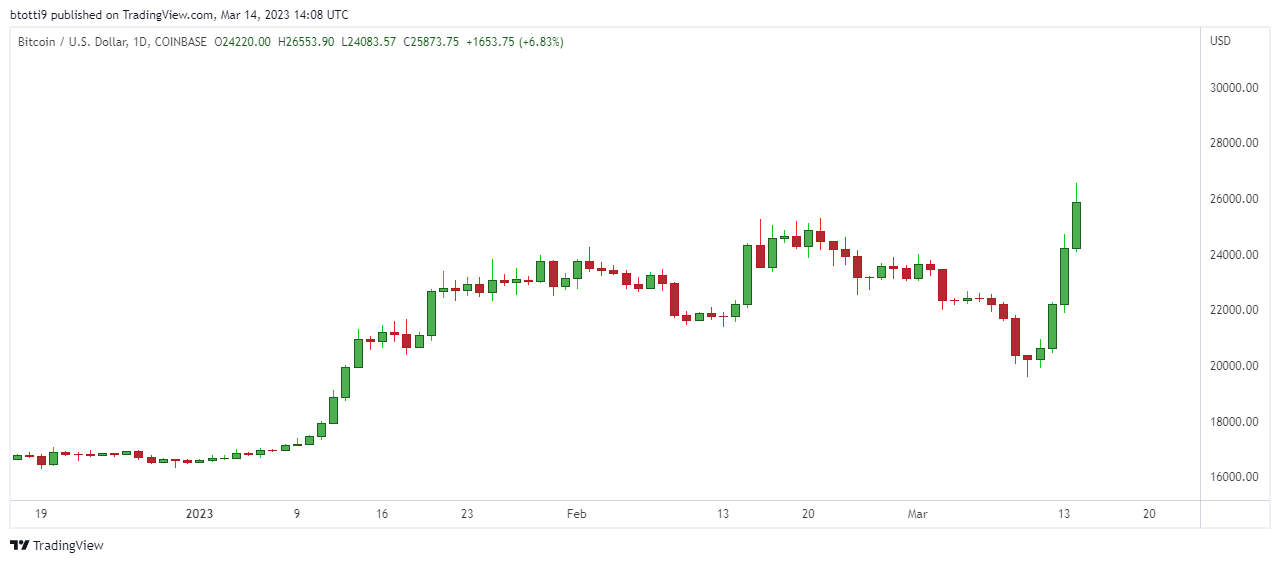 Bitcoin price rallied above $26,000 on Tuesday. Chart courtesy of TradingView
As noted yesterday, BTC price soared from lows of $20,000 to break above $24,000 – the bullish sentiment buoyed by the US government’s actions in the wake of Silicon Valley Bank’s collapse.
On-chain data shared by market research platform IntoTheBlock shows Bitcoin faces minimal selling pressure to around $30,000.
On-chain ownership indicators for Bitcoin are pointing to very little potential new selling pressure until we get closer to $30k $BTC.https://t.co/9Mt8pOZD34 pic.twitter.com/DoAAxdX7lF
— IntoTheBlock (@intotheblock) March 14, 2023
The aggregate market data from CoinGecko showed the total crypto market cap has surged by more than 14% as major altcoins like Ethereum and BNB hit highs of $1,750 and $315 respectively.
Per the US Department of Labor, CPI rose 0.4% in February and 6% over the last year to align with market expectations. Notably, the data showed US inflation had increased at its slowest pace since September 2021. The core CPI, which strikes off the more volatile food and energy items, increased by 5.5% to also fall within expectations.
Stocks also opened higher on Tuesday, with the S&P 500 up 1.5% as investors turned attention to the Federal Reserve and its interest rates path. Market analyst Carl Quantanilla points out this scenario.
#CPI “isn’t the best-case scenario, but there are enough dovish pieces that when coupled with what’s happening with banks should give Powell cover to dramatically shift the policy message on 3/22. It’s still hard to say whether they do 0 or 25bp ..” @knowledge_vital
— Carl Quintanilla (@carlquintanilla) March 14, 2023
The Dow Jones Industrial Average had added 320 points, or 1%, while the Nasdaq Composite was up 1.7% at 9:50 am ET.
-

Bitcoin price breaks below $20K amid crypto selloff

- Bitcoin price fell below $20,000 for the first time since November 2022.
- The top crypto asset by market cap dumped amid broader selloff for cryptocurrencies, largely fueled by negative news.
- Among other news, the New York Attorney General has sued KuCoin over offering of unregistered securities, with Ethereum named as one of the securities.
Bitcoin price has dropped nearly 10% in the past 24 hours amid negative cryptocurrency news that could yet catalyse further losses.
As the Bitcoin price chart below shows, the value of the leading cryptocurrency by market fell to lows of $19,569 on cryptocurrency exchange Bitstamp.
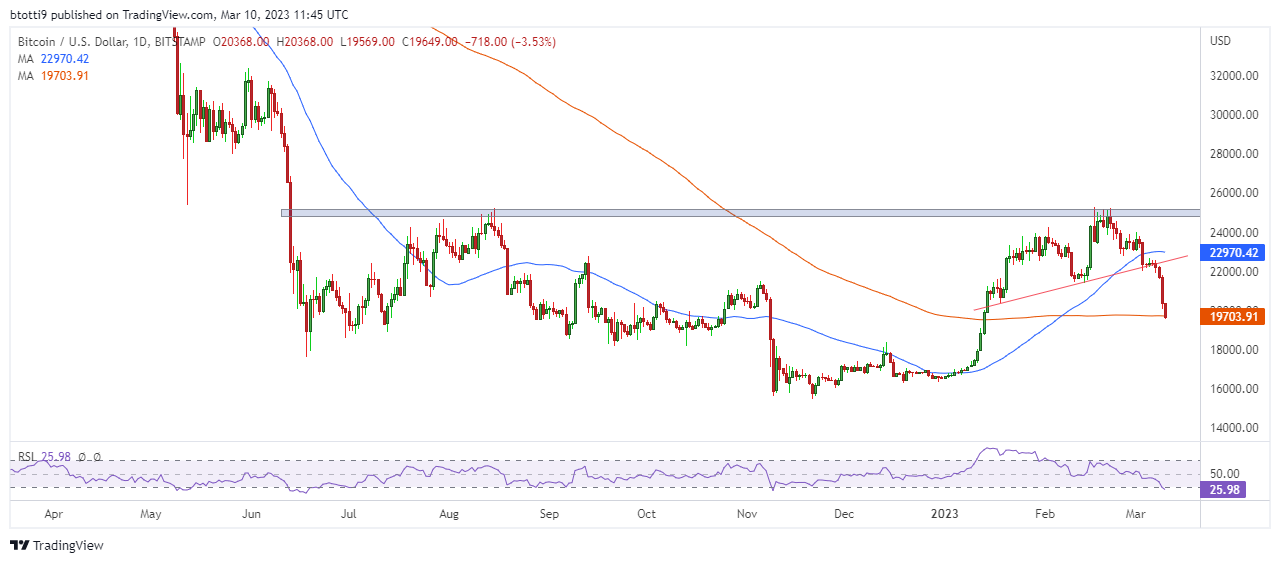 Bitcoin price fell below $20,000 to hit $19,569 on Bitstamp. Source: TradingView
This after a selloff that began late Thursday extended into Friday morning, with the dump pushing BTC below the psychological support zone of $20,000 for the first time since November 2022 during the FTX dump.
Why Bitcoin and crypto crashed today
As CoinJournal reported early Friday, today’s selling pressure for cryptocurrencies comes after the New York Attorney General sued the crypto exchange Kucoin alleging it sold unregistered securities. The negative news was compounded by the fact that the lawsuit identified Ethereum as one of the securities.
The market’s reaction saw Ethereum price plunge to lows of $1,375 and was down 9.8% at the time of writing.
Overall selloff pressure also follows news that crypto bank Silvergate was winding down. The company’s shares plummeted nearly 50% in the aftermath, with fears of even more damage amid a Silicon Valley “bank run.”
Another headline news likely to have fueled fresh downside for crypto was reports that the US was targeting a new tax on Bitcoin mining. Huobi Token’s flash crash and a security breach on Hedera also added to the broader market bloodbath.
Crypto analyst Miles Deutscher highlighted this confluence of negative triggers, noting that stocks and cryptocurrencies have shed over $2 trillion in market cap over the past 24 hours.
In the last 24 hours:
• Stocks + crypto shed $2T in value
• New York Attorney labels $ETH a security
• KuCoin hit with lawsuit
• Silicon Valley bank crash
• Huobi flash crash
• Biden proposes tax on $BTC mining
• Voyager liquidating assetsJust another day in crypto..
— Miles Deutscher (@milesdeutscher) March 10, 2023
-

Bullish Bitcoin Price Indicates Crypto Market Recovery
With Bitcoin’s price making a resurgence, investors are gearing up for a bull market in 2023. Crypto signal providers are seeing renewed interest thanks to their ability to save investors time and money by pinpointing the best entries. Many savvy traders continue to recommend AltSignals as the go-to platform.
Thanks to its sterling reputation, AltSignals’ recently announced ASI token presale is expected to be huge. In this article, you’ll find out why AltSignals is so highly regarded and why its ASI token could elevate the online trading experience for investors all across the globe.
Bitcoin Price Revitalized, Prompting Investors To Check Out AltSignals
It seems like a risk-on mood is back in the markets. With the Fed expected to slow down or reverse interest rate hikes this year, investors have been loading up on crypto before the next bull cycle begins.
Since the start of 2023, Bitcoin’s price has risen almost 47% from around $16,500 to a high of approximately $24,250 in early February. This rapid ascension in Bitcoin’s price has accompanied a surge in interest in online trading, leading many investors to start looking for the best crypto signal providers to boost their profits. One name that has regularly cropped up is AltSignals.
What Is AltSignals?
AltSignals is a leading name in the crypto signals industry, established in 2017. It uses a team of market experts and professional traders to combine technical and fundamental analysis with its in-house algorithm, AltAlgo™. As a result, AltSignals has earned a reputation as one of the most reliable and profitable signal providers out there.
This reputation is quickly validated when looking over their stats. Over 52,000 traders rely on the 3,700 trade calls it has produced since its launch, with the platform holding a 4.9/5 rating on Trustpilot after receiving nearly 500 positive reviews. The actual trading results speak for themselves: AltSignals has returned over 10,000% in 19 out of 32 months on record.
AltSignals’ ASI token is projected to attract a new wave of attention to the AltSignals platform. This is due to the excellent benefits ASI will offer holders that will help them make the most out of their online trading journey.
How Is ASI Expected To Change the Online Trading Game?
ASI is an Ethereum-based token that will act as the fuel for the AltSignals ecosystem. Its primary use case will be to access and receive signals from the upcoming ActualizeAI algorithm. This algorithm will boost AltSignals’ accuracy further thanks to a comprehensive AI stack, which includes machine learning, predictive modelling, and sentiment analysis. For ASI holders, they’ll be the first in line to experience the power of this new algorithm.
Holding ASI will also grant exclusive entry into the ActualizeAI Club, where users can play an active role in giving feedback and helping to test the ActualizeAI algorithm in return for early access to the latest upgrades and earning ASI tokens. In the process, they’ll work directly with the AltSignals team to improve their products and optimize the signals produced.
ASI will become the platform’s governance token, allowing users to vote on new upgrades, partnerships, and more. They’ll also be able to set the token’s buyback and burn rate, which will help to restrict the supply of ASI over several years and potentially lead to price appreciation.
The Long-Term Outlook for ASI
The ASI token is predicted to see exceptionally high demand, with many projecting that the ASI presale will sell out rapidly. Traders are expected to flock to the token when they find out it grants access to the ActualizeAI algorithm and Club.
This group alone could easily send ASI skyrocketing as traders rush to become part of an elite group dedicated to building one of the greatest trading algorithms the world has ever seen. This spirit of collaboration and mutual support will set AltSignals apart from other signal providers and is set to be a major contributing factor in the success of the ASI token.
Consequently, several analysts predict that ASI will climb well beyond its final presale price of $0.02274, with some forecasting that $0.50 is easily achievable by the end of 2023. If $0.50 is reached, investors could be up almost 2,100% in just under a year – far beyond what any Bitcoin price prediction could hope to attain.
Should You Invest in ASI?
As Bitcoin’s price continues to grow and the bull market heats up, AltSignals will likely see a massive surge in interest. Thanks to the ActualizeAI algorithm and the platform’s proven reputation, its ASI token will likely be one of the lucky few that return life-changing gains in 2023.
The beta sale price of $0.012 seems exceptionally undervalued, so expect this first phase to sell out quickly. If you’re thinking of getting involved, be sure to visit their presale website.
You can participate in the AltSignals presale here.
-
Bitcoin price prediction: BTC outlook after Silvergate and Tether news
- Bitcoin price outlook after this week’s Silvergate and Tether news.
- BTC is hovering around $22,400 with key resistance near $23k amid a potential technical breakout to YTD highs.
- The $20k zone is a critical and psychological level for bulls.
Bitcoin price remains constrained below $22,500 after posting a sharp decline on Friday following a combination of broader market weakness and negative crypto-related news.
However, with price above $22,000, the technical outlook suggests bulls might still have a chance to push for new year-to-date highs in March or April.
Bitcoin price prediction: BTC declined amid Silvergate Bank and Tether news
On Wednesday, crypto-friendly bank Silvergate (SI) revealed it was a little deeper in trouble with a SEC filing that it would delay its financial report. The crypto bank then announced a halt to its payments network the Silvergate Exchange Network (SEN), triggering further uncertainty around its operations following the previously revealed $1 billion loss.
Indeed, selling pressure for BTC increased as major crypto firms including Coinbase and Paxos announced a switch from Silvergate to alternative banking partners.
But the price of bitcoin went on to touch lows of $22,000 as more negative news emerged – the Wall Street Journal published an article related to Tether, the company that issues the world’s largest stablecoin USDT. Allegedly, Tether and Bitfinex used “falsified documents” to acquire banks accounts amid questions over the stablecoin’s reserves.
Crypto trader and investor Scott Melker heighted the WSJ’s report in a Twitter thread on Friday.
The allegations in the report could have significant implications for Tether and the wider crypto market. If Tether’s dollar reserves are not what they have been claimed to be, it could lead to a collapse in the value of the cryptocurrency.
— The Wolf Of All Streets (@scottmelker) March 3, 2023
Bitcoin price outlook: What next for BTC/USD?
The RSI on the 4-hour chart remains largely flattened near the lower band as price action consists mainly of doji prints. While Bitcoin is holding above a support base formed in early January, there’s indecision as signaled by the doji candlesticks.
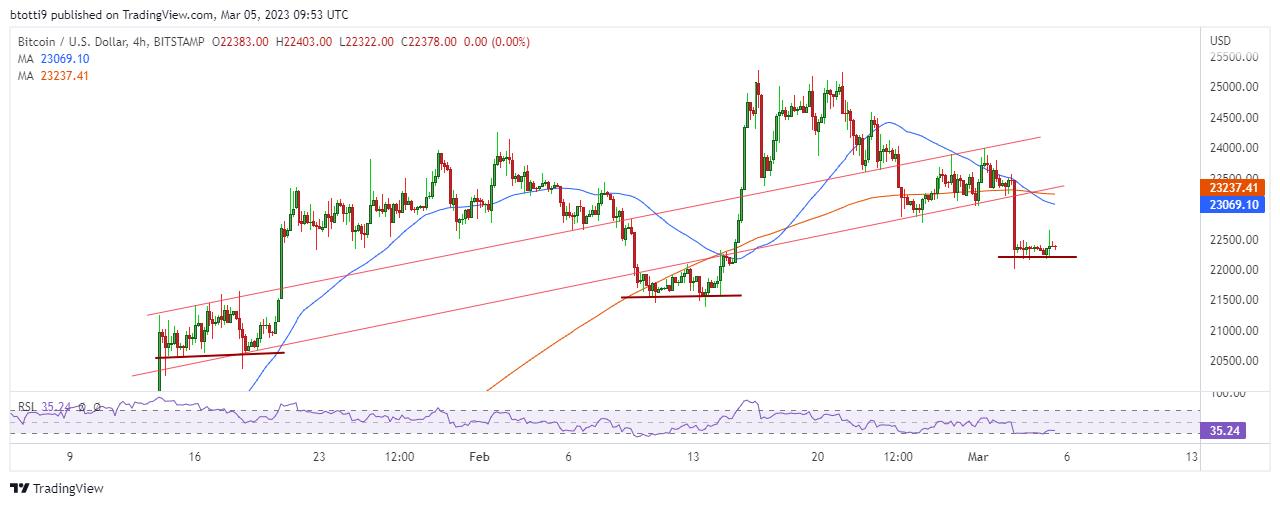
Bitcoin price movement on the 4-hour chart. Source: TradingView
If bears take charge further, BTC/USD will likely retest the aforementioned support line and potentially break past $22k to another key level near $21,600. Below that we could see a retest of the vastly important $20k level.
On the upside, the immediate hurdle is the $22.5k zone, with robust supply areas expected at the price levels currently signaled by the 50 and 200 moving averages.
The outlook on the daily chart shows the RSI sloping to suggest bears might have an upper hand.
However, there’s potential formation of an inverse head & shoulders pattern. The neckline of this likely inverse H&S pattern could be in the $25k zone. In any case, the immediate key price levels to watch as signaled by the 50-day and 200-day moving averages near $22,900 on the upside and $19,712 on the downside.
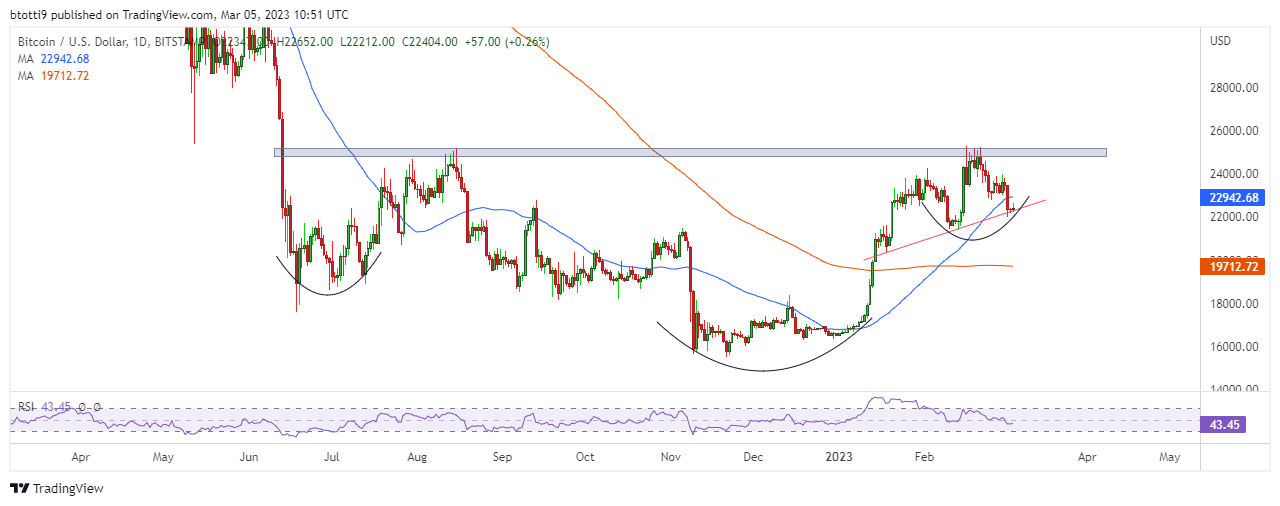 Bitcoin price prediction levels on daily chart.Source: TradingView
The post Bitcoin price prediction: BTC outlook after Silvergate and Tether news appeared first on CoinJournal.
-

STX price shoots up 31%
- Stacks blockchain was designed to bring smart contracts and dApps to Bitcoin.
- Stacks is providing a way to transfer assets to and from Bitcoin using smart contracts.
- Its releases today advance its aim of making Bitcoin a more programmable smart contract hub.
The price of STX, the native token of the Stacks blockchain, has risen by more than 143% over the past week besides today’s surge of 31.73% at press time. The reason for today’s Stacks price surge is mainly because of two major whitepaper releases by the Stacks blockchain as it continues with its goal of making the Bitcoin blockchain a more programmable smart contract hub.
Stacks’ is a Layer-1 blockchain solution that aims works on bringing smart contracts and decentralized applications (dApps) functionality to the Bitcoin blockchain. Bitcoin by design is a proof-of-work (PoW) blockchain with no in-built smart contracts capabilities.
The two Stacks whitepapers
The first whitepaper release is titled “sBTC whitepaper” while the second whitepaper release is titled “stacks whitepaper.”
The sBTC whitepaper introduces a newly proposed asset referred to as sBTC that will act as a trustless two-way Bitcoin peg to allow for the swift transfer of assets to and from the Bitcoin blockchain. In essence, the sBTC will allow Bitcoin to become a more secure Web3 hub by enabling trustless writing to Bitcoin and the movement of Bitcoin in and out of Bitcoin layers. The transactions will be secured using 100% of Bitcoin hash power.
The sBTC complements Stacks 2.0 which introduced “read” access to the Bitcoin protocol.
The stacks whitepaper (Nakamoto Release) adds important capabilities to the Stacks protocol to enhance its power as a Bitcoin layer. The whitepaper introduces a number of changes that are to be made to the Stacks protocol in order to enable the trustless functionality of the newly proposed sBTC asset.
While the release of the two whitepapers is a major milestone for Stacks, it is also a major boost for the Bitcoin economy. sBTC will introduce a new era of Bitcoin applications, which will in turn unlock $300B+ within the Bitcoin ecosystem in latent capital for Web3 and also accelerate the growth of the Bitcoin economy.
-

Bitcoin price rose despite $25 million in product outflows
- Bitcoin products saw $25 million in outflows last week, according to asset manager CoinShares.
- There was $3.7 million in short Bitcoin as investor sentiment flipped negative on recent regulatory concerns.
- But crypto prices still recorded huge moves, with BTC hitting a six-month high above $25,000.
Bitcoin price hit its highest price level in six months last week, with the flagship cryptocurrency testing bears’ resolve above the $25,300 zone.
However, digital asset management firm CoinShares says despite reaching a new year-to-date high, the flagship cryptocurrency still bore the brunt of the negative sentiment that pierced the market as US regulators upped their crackdown on multiple industry sectors.
Digital assets see $32 million in outflows
As CoinShares Head of Research James Butterfill points out in a weekly funds flow report released on Monday, Bitcoin recorded the largest share of outflows seen in the digital assets investment products last week.
Per the researcher, total crypto funds outflows totaled $32 million this past week, the largest single week outflows since December last year. But almost $25 million of the outflows were in Bitcoin products, with negative sentiment seeing short Bitcoin investment products account for $3.7 million in inflows.
Infact, as US Securities and Exchange Commission (SEC) increased its crackdown on stablecoins and staking services among other sectors of the crypto industry, crypto outflows hit $62 million. The market did record significant outflows as Bitcoin led the market in holding prices above key levels.
According to Butterfill, the mid-week flip in sentiment (with Bitcoin price soaring more than 10%) helped digital assets products register $30 million in inflows. This in turn helped push the total assets under management in exchange-traded products (ETPs) to its highest level since last August. Butterfill noted:
“The negative sentiment amongst ETP investors was not expressed in the broader market with Bitcoin prices rising by 10% over the week, this price appreciation pushed total assets under management (AuM) to US$30bn, their highest level since August 2022. We believe this is due to ETP investors being less optimistic on recent regulatory pressures in the US relative to the broader market.”
Crypto assets saw mixed flows
While Bitcoin recorded over 78% of the outflows, Ethereum products saw $7.2 million in outflows last week. Other top altcoins with large withdrawals included Cosmos ($1.6 million), Polygon ($0.8 million), and Avalanche ($0.5 million).
Yet, investment products for Aave, Binance, Fantom, XRP, and Decentraland saw inflows of between $0.36 million and $0.26 million, CoinShares highlighted in its report.
Elsewhere, while crypto assets experienced a second consecutive week of outflows, blockchain equities had a more positive outlook from investors, with $9.6 million in inflows last week. Blockchain equities have now had six consecutive weeks of inflows.