Tag: Price
-

Long-term Bitcoin holders at all-time high, but price not cooperating
Key Takeaways
- Two-thirds of the Bitcoin supply has not moved in over a year
- Metrics for percent of supply unmoved in 2+, 3+ and 5+ years also at all-time highs
- The average hold period for Bitcoin on-chain is 3.8 years
- Despite thesis that dwindling supply will boost price, this has not proved the case thus far
The capped supply of Bitcoin has always offered an intriguing layer to analysis of the enigmatic asset.
Simply put, there are not many assets worldwide that offer an inelastic supply. Truthers argue that this cap will inevitably squeeze the price upwards through the simple economic theory of supply and demand. That is, assuming the demand continues to grow, of course.
Here, we look at this supply, and how many of the total supply of 21 million bitcoins (of which 19.3 million are currently in circulation) have not moved in quite some time.
Percentage of Bitcoin supply unmoved in over a year at all-time high
If one takes the 1+ year mark as a benchmark for long-term holders, that means a growing amount of Bitcoin supply is held by what constitutes long-term investors.
Two-thirds of the Bitcoin supply has not moved in over a year, an all-time high. That means no purchases or sales.
In expanding the timeframe out, we can look at what portion of this 67% has been held for even greater amounts of time. On the below chart, I have plotted the portion of supply that has been stagnant for 1+ years, 2+ years, 3+ years and 5+ years.
The results are interesting. Nearly half the supply – 49.3% – has not moved in over 2 years. Pushing out to 3+ years, the number is 39%. And 28.1% of the supply has not moved in 5+ years. The marks are all all-time highs.
So, diamond hands? Well, sort of. The numbers are certainly large, but there are other variables at play. Most notably lost coins, for which it is impossible to know how many there are. Satoshi Nakamoto is estimated to own over one million coins, which is circa. 5% of the supply alone.
Long-term holders growing despite market carnage
Nonetheless, to see such stout numbers following the year that crypto has had is notable. The average hold time of Bitcoin on-chain right now is 3.8 years.
This comes less than a year after the collapse of LUNA (May-22) which sparked a meltdown crisis that ultimately bankrupted hedge fund Three Arrows Capital and sent a wave of contagion across the industry.
Things shook further when this contagion claimed crypto lender Celsius in June. The fallen crypto lender disclosed two months before, at the Bitcoin 2022 conference, that it held 150,000 Bitcoin, which would constitute 0.8% of the supply.
Unfortunately for investors, court filings by Kirkland & Ellis indicate that the firm has lost roughly 62,000 Bitcoin, and right now it is unclear how many they really held, nor how many the bankrupt firm now holds.
Then there was the staggering collapse of FTX in November.
But despite this, long-term holders do continue to grow, at least if on-chain metrics are to be trusted.
Dwindling supply not supporting price
But as for the thesis that a dwindling supply will push price up, it has not worked to date. Bitcoin has collapsed while these metrics have all jumped to all-time highs.
What happens in the long-term remains to be seen. The advocates aren’t wrong when they reference simple supply and demand. This will undoubtedly help the price, and if long-term holders continue to hold, the liquidity drying up further can only squeeze the price upward.
On the other hand, every sale needs a bid order, and these have not been coming in quickly enough over the last two years. As I have written about repeatedly, Bitcoin continues to follow the macro cycle, trading like an extreme-risk asset making a mockery of those who claim it is any sort of inflation hedge. Look no further than its reaction to recent inflation readings and Federal Reserve meetings on interest rate policy for evidence of this.
Undoubtedly the most important week for BTC this year. Not only are investors Fed-watching but they’re praying for expansionary policy & inflationary pressure⬆️
BTC & S&P500 correlation at all-time highs. Fed indirectly controlling BTC price
There’s an irony in there somewhere
— Dan Ashmore (@DanniiAshmore) February 1, 2023
Supply drying up is a good thing. But until Bitcoin sheds its high-risk image, it will continue to trade like a levered bet on the Nasdaq. Every asset needs a bid, people, and in times of uncertainty, the market has shown that Bitcoin is the last thing that investors want to hold.
Time will tell if this all changes.
-

Jasmy price technical analysis as rebound accelerates

The Jasmy Coin price rose on Monday, continuing a bullish trend that started in December when it dropped to a low of $0.0028. It jumped to a high of $0.0074, the highest point since September 18. It has jumped by over 152% from its lowest point in December, as we wrote here.
JASMY/USD daily chart analysis
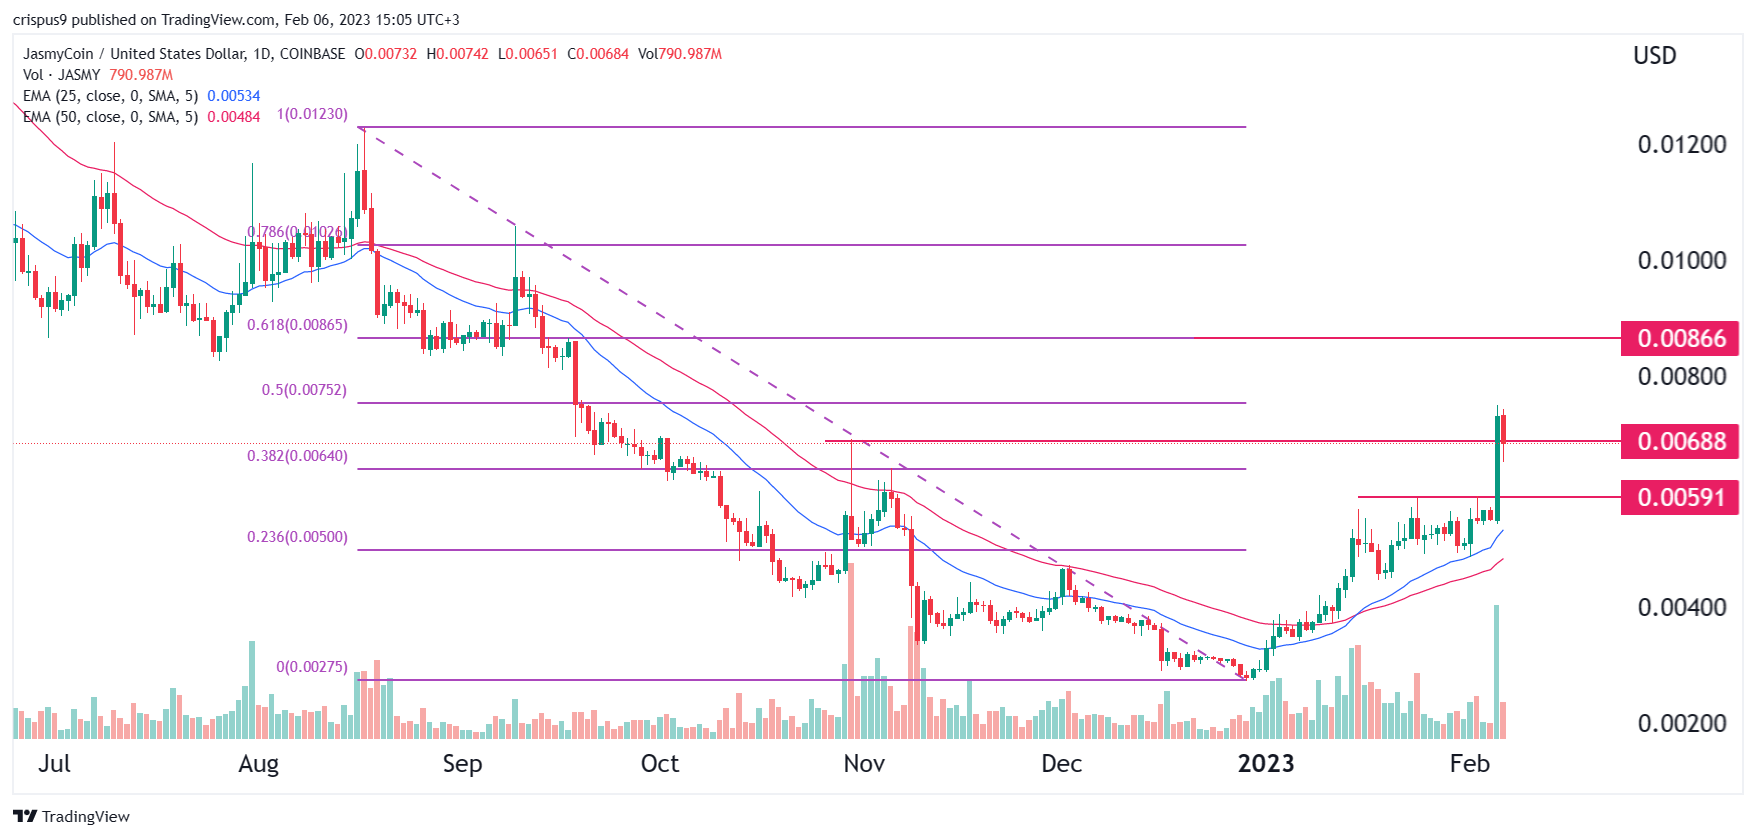
The daily chart shows that the JASMY coin price has been in a strong bullish trend in the past few weeks. This recovery has been accompanied by elevated volume levels. At the same time, the coin has managed to move above the important resistance level at $0.0060, the highest point on January 24.
Jasmy also jumped to the 50% Fibonacci Retracement level. Also, it jumped above the crucial resistance point at $0.0068 (October 30 high). It has also jumped above the 50-day moving average and the Ichimoku cloud indicator. Jasmy, which is known as Japan’s Bitcoin, has also formed an inverted head and shoulders pattern, which is a bullish sign.
Therefore, it seems like Jasmy has the momentum it needs to continue rising in the coming days. If this happens, the next key resistance level to watch will be at $0.0086, the 61.8% Fibonacci Retracement point. This price is about 27% above the current level.
On the flip side, a drop below the important support level at $0.0060 will invalidate the bullish view. If this happens, it will signal that there are still sellers left in the market who will be keen to push it to the next key support level at $0.0050.
Jasmy price 4H chart analysis
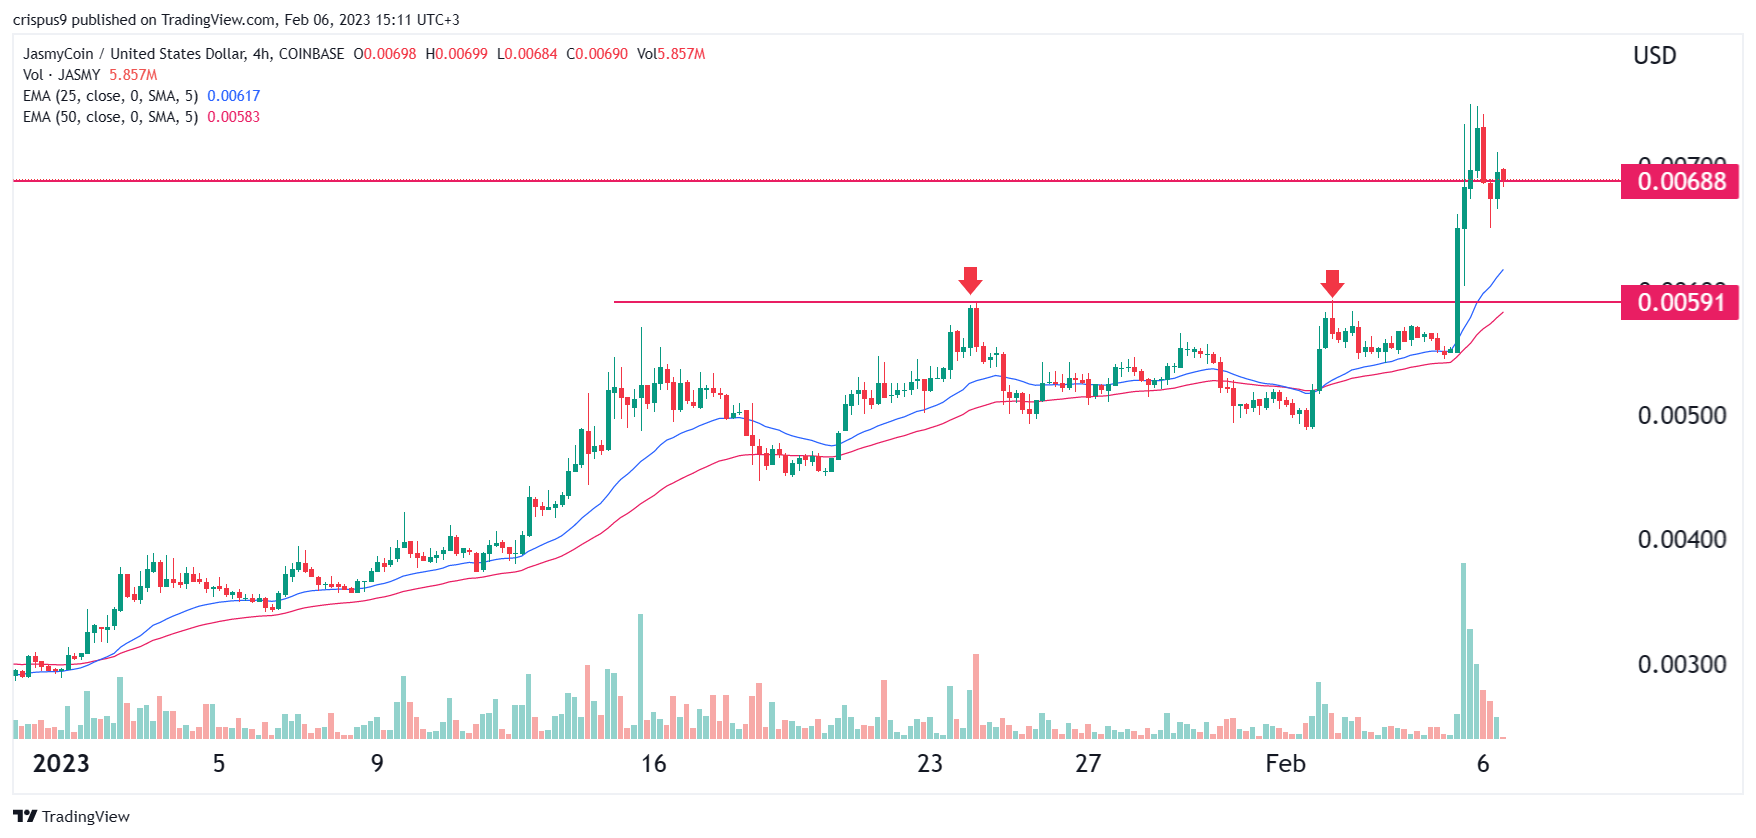
On the 4H chart, we see that the Jasmy Coin price has made a spectacular comeback in the past feww weeks. As it rose, the token crossed the key resistance level at $0.0060, where it struggled to move above on January 24 and February 2. The coin is also above the 25-day and 50-day EMAs.
At the same time, a closer look shows that volume bars have started to drop. Therefore, this could be a sign that the bullish trend is fading, which could see it retreat in the coming days. But on a positive side, the coin has formed a small hammer pattern, which is a bullish sign.
A reversal will be confirmed if JasmyCoin price plunges below the lower side of the hammer at $0.0065.
-

Analyst shares NOIA price outlook after 168% gain

- NOIA is the native token of Syntropy, a distributed routing protocol for the Internet.
- The token’s price surged 168% from its December lows and one analyst says bulls are likely to aim for more.
- Sentiment is bullish for Syntropy ahead of its public network launch.
Cryptocurrencies are looking to end January on a winning note, with most digital assets rocking huge gains in a month that saw Bitcoin break above $23,000.
On 31 July, the total crypto market capitalization was above $1 trillion, helped by Bitcoin’s market cap rising to $446 billion to account for a market dominance of 40.9%. A similar upside trend has been observed across altcoins, led by Ethereum’s breakout from lows of $1,200 at the beginning of the month.
Analyst says NOIA could do another 2x
Perhaps notable is the bullish sentiment for Syntropy that has been increasing since the team updated the token’s circulating supply schedule and as the platform edges closer to its public launch.
Less than a week until our important launch 👀
With the public network launch and revised @SyntropyStack website, we will reveal a completely new Syntropy Knowledge Hub designed for novice and experienced individuals to learn everything about #Syntropy and $NOIA in one place. pic.twitter.com/AfGS5jrfIP
— Syntropy (@Syntropynet) January 31, 2023
While tokens like Aptos and dYdX continue to outperform, crypto analyst Rekt Capital is pointing to one other coin that could benefit from the recent bull run.
According to the crypto trader, Syntropy (NOIA) is likely to do a 2x if it holds a crucial price level on the monthly close. In a tweet early Tuesday, the highly respected analyst noted that NOIA’s 168% rally from its lows in December has the Syntropy token at a crucial area.
“NOIA enjoyed a +168% rally from December’s lows & is now approaching a crucial area. If NOIA is able to turn the green box top (~$0.068) into support on Monthly Close, Syntropy could be well-positioned for another 2x rally,” he suggested.
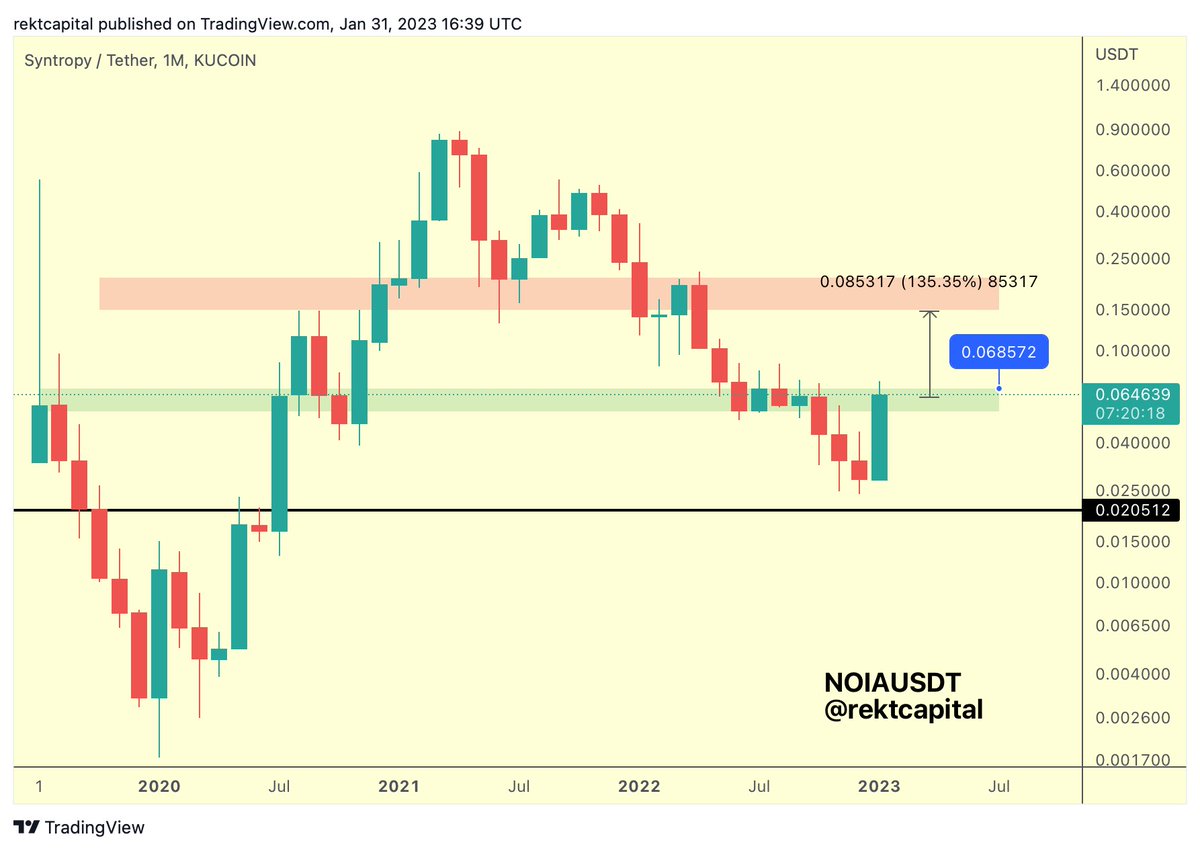 Syntropy (NOIA) price prediction chart. Source: Rekt Capital on Twitter.If bulls hold the highlighted price zone ($0.068), Rekt Capital sees a 135% or more rally towards $0.15. That could open up the NOIA price for a potential retest of its all-time high price near $0.20. However, a negative flip could see bears push for $0.030 or even target $0.020.
The Syntropy token was changing hands around $0.065 early afternoon on Tuesday, up 2.3% in the past 24 hours and 32% higher this past week.
-

Bitcoin price prediction ahead of Fed decision, NFP data

-
Bitcoin price declined slightly on Monday after nearing the resistance at $24,000.
-
Macro factors will be the key drivers for Bitcoin and other asset prices.
-
Consumer confidence, Fed decision, and NFP data will be in focus.
Bitcoin price pulled back slightly on Monday as investors started focusing on the key economic data from the US and the upcoming Fed decision. The BTC price was trading at $23,125, which was a few points below this year’s high of near $24,000.
Fed decision and NFP data
Macro data and events will be the key things that will drive the price of Bitcoin – and other assets this week. On Tuesday, the Conference Board will publish January’s consumer confidence data. This is an important figure that is watched closely by investors and policymakers because of the vital role that consumer spending plays in the economy. Economists expect that confidence continued rising in January as inflation eased.
The US consumer confidence data will be followed by the first FOMC decision of the year. With inflation easing and stocks and crypto prices rising, analysts believe that the Fed will deliver the second consecutive 0.50% hike. It will be extremely hawkish in a bid to reduce the enthusiasm among investors and traders.
In theory, an extremely hawkish tone will be bearish for the price of Bitcoin. Historically, crypto prices tend to rally in periods of easy money policies. However, in reality, there is a possibility that Bitcoin will rise even if the Fed sounds hawkish. That’s because investors may not believe the tone of the FOMC officials.
The Fed will likely guide to two more 0.50% rate hikes followed by a pause on interest rates as it seeks to lower inflation.
Finally, Bitcoin price will react to the latest non-farm payrolls (NFP) scheduled for Friday this week. These numbers will be important because they will guide the Fed in making its future decisions. Strong jobs numbers mean that the bank will continue sounding more hawkish in the coming meetings.
Bitcoin price prediction
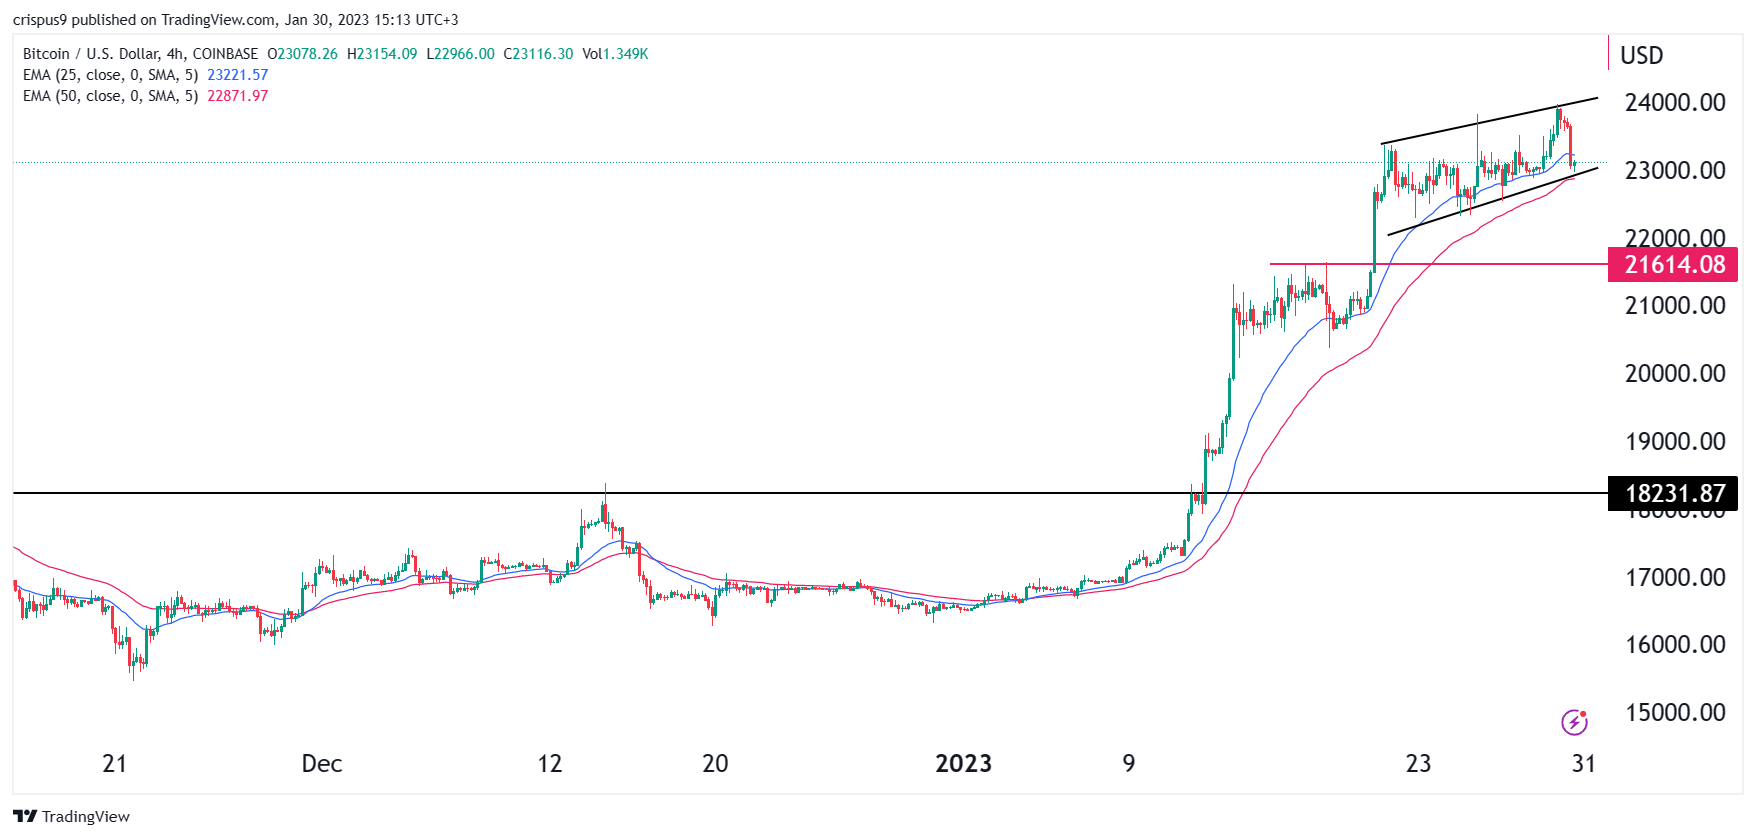
The BTC price has been in a strong bullish trend in the past few weeks. It has formed an ascending channel shown in black. The coin has moved above all moving averages. Further, it has moved above the important support at $21,615, the highest point on January 18.
Therefore, there is a possibility that Bitcoin will pull back slightly ahead of the Fed decision and then rebound after the decision. As such, the coin could retest the support at $22,000 and then rise to $25,000.
-
-

Bitcoin price outlook after BTC break above $23k

- Bitcoin’s rally from December lows after the FTX collapse surprised many investors, Glassnode says in its weekly report.
- Bitcoin could see further upside but a fresh buy signal is likely at prices around $28.3k.
- Selling pressure above $23.3k is more likely given short-term holders and miner push for exit liquidity.
Bitcoin price remains poised near $23,000 after a breakout pushed the leading cryptocurrency’s value above the psychological $20k level.
As highlighted ove the weekend, Bitcoin’s surge to prices above $23,000 did surprise many people, and while optimism is high among bulls, a potential liquidity exit from profit booking is likely. Particularly, this could be the outlook given how brutal the 2022 bear market was for short term holders and miners.
On-chain data platform Glassnode has highlighted this possibility.
The recent market rally has pushed #Bitcoin prices above $23k, surprising many investors.
However, with higher prices comes an increased motivation for network participants to take exit liquidity, especially after the prolonged bear of 2022
Read here 👇https://t.co/D5QY9n5dp7
— glassnode (@glassnode) January 23, 2023
Glassnode’s outlook after latest BTC price action
According to on-chain data firm Glassnode, Bitcoin looks “almost out of the woods,” but the price action to levels in the $21k to $23k region also reclaimed several on-chain pricing models.
A look at the Investor Price (currently at $17.4k) and Delta Price ($11.4k), signifies a similar price action at the bear market bottom of 2018-2019. Investor Price is the average price at which investors acquired all the spent and miner distributed coins, while Delta Price is derived from Realized Cap minus Bitcoin’s all-time Average Cap to get a technical pricing model.
At the base of this outlook is the price discovery phase, which during that 2018 bear market bottom lasted 78 days. The current market is at a similar level, with BTC above the Realized Price of $19.7k.
“This suggests an equivalency in durational pain across the darkest phase of both bear markets,” Glassnode wrote in its weekly market report.
Still on the Investor Price/Delta Price metrics, the on-chain platform points to a measure called compression, which takes into account the spot price to determine the intensity of the market’s undervaluation. The metric also correlates with the scale of change in an asset’s Realized Cap or capital inflow volume, with a threshold zone of 0.15-0.2.
Given the current BTC price and compression value, Glassnode estimates a bullish confirmation signal could be triggered if Bitcoin bulls reclaim $28.3k.
More optimism for bulls
Also helping the bull case is the Supply in Profit measure, which spiked 12% in the last two weeks to rise from 55% to 67%. The spike in percent of coins in profit is “the sharpest” of all prior bear markets, suggesting a lot more coins changed hands below the $23.3k level.
Key to bulls’ case is also the fact that Bitcoin price at current levels is above all the three cost basis of long-term holder, short-term holder and BTC Realized Price. This is the first time spot price has pierced the three Realized Prices and sustained momentum above the levels would be positive.
The recent surge in #Bitcoin price action has resulted in an initial breakout above all three cost-basis for the first time since the 2018/19 bear market and the March 2020 Covid crisis.
A sustained duration above these key psychological levels would be considered constructive. pic.twitter.com/kyzuwSPenv
— glassnode (@glassnode) January 24, 2023
A bull trap case
While Glassnode points to potential bull case scenarios, its report also highlights probable cases of fresh sell-off pressure.
According to the on-chain data report, one of these is the “substantial spike in profitability,” which the platform says raises the possibility of selling pressure triggered by short-term holders.
Miners are also likely to be motivated by the price action and might look to liquidate some of their holdings, adding to a potential retreat for BTC price.
-

Bitcoin’s “hedge” narrative is dead, as speculative price action continues
Key Takeaways
- Crypto has risen to start the year off the back of expectations that interest rates may be cut sooner than anticipated
- This contrasts with the view that crypto is uncorrelated, proving it false
- Assessing the price action of crypto through the pandemic and subsequent rate-raising cycle shows an extremely risky asset class that moves in line with other speculative asset classes
Over the last couple of months, markets have turned green off the back of inflation data softening around the globe. Crypto hasn’t been left off the invite list, with digital assets surging to their strongest rally in 9 months.
If there was ever any doubt (and by now, there really shouldn’t be), this proves once and for all that any narrative around crypto being an uncorrelated asset is dead.
Pandemic bull run
To quickly recap on the last few years in cryptoland, the asset class initially moved violently upward as central banks worldwide pursued ultra-low interest rate policy.
As economies ground to a halt for the ultimate black swan, the COVID-19 pandemic, nations faced a highly uncertain outlook in Q1 of 2020. With lockdowns sweeping the world, central banks were forced to do what they could to stimulate these abruptly-shut societies.
Out came stimulus packages of an unprecedented scale.
With all this stimulus and generationally cheap money, risk assets went bananas. The biggest leader of all was cryptocurrency. Some argued that the assets were rising as a result of the inevitable inflation that would result from all this expansionary monetary policy, as crypto was a hedge against the fiat system. The argument wouldn’t hold.
The transition to a new interest rate paradigm
The year 2022 did indeed bring a spike in inflation, and this time central banks were forced to do the opposite – aggressively hike rates as the cost of living spiralled relentlessly.
This has reined in risk assets, as per the playbook. Liquidity is sucked out of the system, suppressing demand. Investors now have alternate vehicles in which to park their wealth and earn a yield, with government-guaranteed T-bills now offering reasonable alternatives, as opposed to the zero rates previously (or negative in some nations).
But cryptocurrency followed the rest of the world’s risk assets down. Not only that, but the scale of the meltdown in the sector was unlike anything we have seen in a major asset class in a long time. Bitcoin shaved over three-quarters of its market cap, and it came out favourably compared to altcoins, many of which were decimated.
And now, the last couple of months have brought more optimistic readings regarding inflation. The numbers are still scary, but just a little bit of positivity has crept in that the worst may have passed. Of course, there is still a war ongoing in Europe and now fear has elevated that a recession may be imminent (if not here already), but hey – let’s celebrate whatever wins we can.
The stock market has cautiously crept upwards, as the market moves to the expectation that high interest rates will cease sooner than previously expected.
The only thing is, crypto has also risen. Not only that, but it has printed gains which blow the moves in equity markets out of the water.
Which, you know, kind of suggests that this may not be an inflation hedge at all. As inflation comes back down and the likelihood of lower rates and another expansionary period grows, crypto rises. Go figure.
Correlation vs stock market remains high
The proof is in the pudding. It is pretty clear by simply looking at the price chart of S&P 500 vs Bitcoin that the correlation here is stark – with the key lurking variable being interest rates.
Quite literally, crypto is the opposite of an uncorrelated asset – it has moved in lockstep with the stock market for the last few years.
Interestingly, there have been periods of decoupling, however. Unfortunately, they have come amid crypto-specific crashes. To show this, I plotted the Bitcoin/S&P 500 correlation against the Bitcoin price over the last couple of years.
The correlation has been high, aside from a few noticeable periods – all occurring when the Bitcoin price plummeted. The most recent example was November 2022, when crypto wobbled amid the FTX crash.
There really is no debate here. Crypto is a highly correlated, extreme-risk asset. The only question is whether it can shed this moniker in the long term. But any thought contesting that it is not currently wildly speculative is wide of the mark.
-

Solana price has spiked 137% YTD as cryptocurrencies soar

- Solana is currently changing hands at $23.26, about 137% up year-to-date.
- The coin’s price plummeted after FTX fell in November, ending the year below $10.
- SOL price has soared amid positive sentiment, broader market rally and meme coin-driven interest.
Solana traded below $10.00 on the first day of 2023, having plummeted more than 73% in a massive dump following the collapse of the FTX cryptocurrency exchange.
As was the case, Solana is a blockchain project with ties to disgraced crypto figure Sam Bankman-Fried – the founder of FTX and Alameda Research. After both companies filed for bankruptcy and Bankman-Fried found himself in custody, the native Solana token SOL took a nosedive.
Solana’s SOL soars 137% year-to-date
Having ended 2022 at around $9.66, SOL price has seen impressive bullish action over the past two weeks. The token’s price has rebounded strongly to currently trade more than 62% in the past week, according to crypto market data aggregator CoinGecko.
For its YTD price, SOL is up more than 137%, trading at $23.26 across major exchanges on Monday, 16 January, 2023.
A turnaround for SOL comes on the back of positive sentiment from across the crypto, including last month’s optimistic outlook for the Solana ecosystem from Ethereum founder Vitalik Buterin.
A rebound in decentralised finance (DeFi) and meme coin craze-related activity is also leading to more buy Solana market action. Another factor driving SOL price in recent days has been the broader enthusiasm in the market after what was typically a suffocating run at the backend of last year.
On 12 January, crypto markets platform Messari highlighted that Solana was far from “dead.” According to the firm, on-chain data showed both transaction volumes and active accounts on the Solana blockchain had surged to levels last seen before the FTX collapse.
Is @solana dead? Its fundamentals might say otherwise.
Transaction volumes and active accounts both spiked back to pre-FTX levels.
While tweets and meme coins may have been the cause for recent activity, it is difficult to pinpoint the FTX collapse by looking at these metrics. pic.twitter.com/hL05ixfLVw
— Messari (@MessariCrypto) January 12, 2023
As CoinJournal previously covered, some of the uptick in activity followed the launch of meme coin Bonk (BONK), with significant spike in interest in Solana after the cryptocurrency’s airdrop to the community.