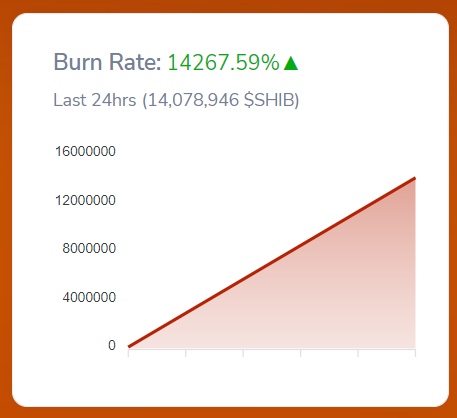
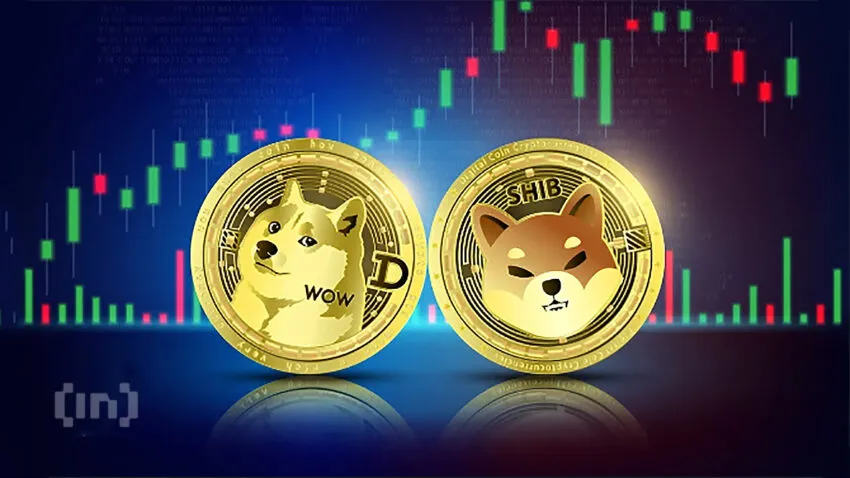
Shiba Inu (SHIB) recently experienced a sharp increase in burn rate with very few tokens burned. The SHIB Burn tracker shows that over the previous 24 hours, the burn rate of the Shiba Inu increased by 14,267.59%. The increase occurs even though there haven’t been many tokens burned.
Around 14.07 million tokens were transferred to dead wallets in the last 24 hours, according to SHIB Burn. According to SHIB Burn data, the greatest burn transaction on the previous day was about 9.8 million SHIB. Additionally, the day before, only 97,991 tokens were burned.
Shiba Inu Burn Rate Skyrockets Over 14,000% as Price Recovers 4
However, the burn rate has cooled down and is currently standing at 1934.01%. 14,896,832 SHIB has been burned in the last 24 hours as per the updated data.
Shiba Inu Burn Rate Skyrockets Over 14,000% as Price Recovers 5
Shiba Inu price spikes in the last 24 hours
Shiba Inu has gained traction along with the most recent market rebound. According to statistics from CoinMarketCap, SHIB is currently trading at $0.00001157, up 10.8% over the previous day. The market value of SHIB has also surpassed $6 billion for the first time in the previous 17 days.
Shiba Inu which was standing at 14th ranking among other cryptos in terms of global market cap lost it to TRX recently and was standing at 15 till yesterday. However, the recent price spike has pushed it to the 13th rank on the basis of the global market cap.
Whale activity has recently increased in Shiba Inu at a never-before-seen rate. Instead of buying billions of SHIB, whales were purchasing trillions. The whales have also been trading privately and shifting, selling, and buying back SHIB.
These routine actions are now regularly carried out by some unnamed whales. A whale anonymously transferred 3.3 trillion SHIB to another wallet, according to data from Whale Alert.
3,367,037,381,943 SHIB have been dumped by an anonymous wallet, according to Whale Alert statistics. The unknown is the precise nature of the transfer. It’s unclear if the transfer represents a genuine sell-off or merely a typical movement of the token between the whale’s wallets.
The global crypto market cap has finally regained $1 trillion as all the major coins are trading in the green.
New Delhi: Crypto market continued to gain on Thursday despite muted earnings from the tech sector. Bitcoin marched towards $21,000 levels, whereas the total market cap of crypto space topped the $1 trillion mark again.
Most major altcoins were in the green, with a stellar buying interest in the popular meme coins. All eyes were set on the US Fed’s monetary policy meeting, scheduled next week.
Barring the polygon and the US dollar-pegged Tether, all other top crypto tokens were trading higher. Dogecoin zoomed 15 %, Shiba Inu was up by over 6% and Ethereum jumped 4%
The global cryptocurrency market cap hit the $1 trillion mark, after rising up to 3% in the last 24 hours. However, the total trading volume jumped as much as 13% to $102.4 billion.
Expert take Extending the Buoyancy, the global market cap touched $1 trillion after almost a month. The top two cryptos – Bitcoin and Ethereum- also saw some renewed interest, said Prashant Kumar, CEO and Founder, weTrade.
“Positive momentum around the appointment of UK prime minister Rishi Sunak, global markets along with a hope of a reduced interest rate hike in the US Federal Reserve market next week all played a role,” he added.
Tech View by Giottus Crypto Platform Ethereum (ETH) has turned bullish on the lower time frames. Much of this move can be attributed to the broader market sentiment turning positive after Bitcoin broke through a year-long resistance. ETH has taken this opportunity to rise more than 30% from its recent bottom.
ETH still needs more confirmations on the higher time frame charts to establish an uptrend. While it has been trading well above its 50-day moving average of $1,380, it will need to clear resistance at $1,700 (its .618 fibonacci retracement between August and now) to continue moving up. Slightly above this at $1,800, it will be able to register a higher high and signal a clear market structure change. Those looking to open long positions may want to therefore adopt a wait and watch approach.
ETMarkets.com
For those with a bullish bias looking to enter, support at $1,500 and $1,440 can offer good opportunities to engage in some buys on dips, the experts suggested. With its daily RSI hitting 70, a minor correction can be reasonably expected in the coming days, or at the very least – some sideways consolidation, they added.
Global Updates Google reported its softest advertising growth in nine years, with company management taking note of softer crypto ad spending as contributing to the weak numbers.
The decentralized autonomous organization (DAO) behind crypto exchange SushiSwap has approved a legal structuring by an overwhelming majority.
The flagship crypto fund for venture-capital firm Andreessen Horowitz’s, which is also known as a16z, has cratered by more than 40 per cent in the first half of this year, the Wall Street Journal reported, citing people familiar with the matter.
The UK National Police Chiefs’ Council (NPCC) has stationed crypto tactical advisers in police departments nationwide to help investigate and seize digital assets tied to crime.
Wahid Pessarlay
Shiba Inu’s burn rate massively recovers in the past 24 hours
Shiba Inu (SHIB) just saw a massive burn rate spike while not many tokens were burned. According to the SHIB Burn tracker, Shiba Inu’s burn rate rose by 14,267.59% in the past 24 hours.
Source: SHIB BURN
The spike comes while the number of the burned tokens is still not massive. According to SHIB Burn, around $14.07 million tokens — worth roughly $155 at the time of writing — were sent to dead wallets in the past 24 hours.
The largest burn transaction in the past day, per SHIB Burn data, is roughly 9.8 million SHIB. Furthermore, only 97,991 tokens were burned the day before.
With the latest market recovery, Shiba Inu has also gained momentum. At the time of writing, SHIB is trading at $0.000011, up by 7% in the past 24 hours, according to data provided by CoinMarketCap.
Ads
SHIB’s market cap has also touched the $6 billion mark for the first time in 17 days.
The price action comes as the Luxembourg-based cryptocurrency exchange Bitstamp listed the second largest memecoin — top 14 cryptocurrency — for customers in the U.S., as U.Today reported.
Shiba Inu team has also brought a new concept art, called “Dunes,” to its SHIB Metaverse, U.Today reported on Tuesday.
On the other hand, a massive Shiba Inu whale, holding 3.3 trillion SHIB tokens — worth roughly $37 million at the time of writing — is on the move. The whale transferred the funds from one anonymous wallet to another.
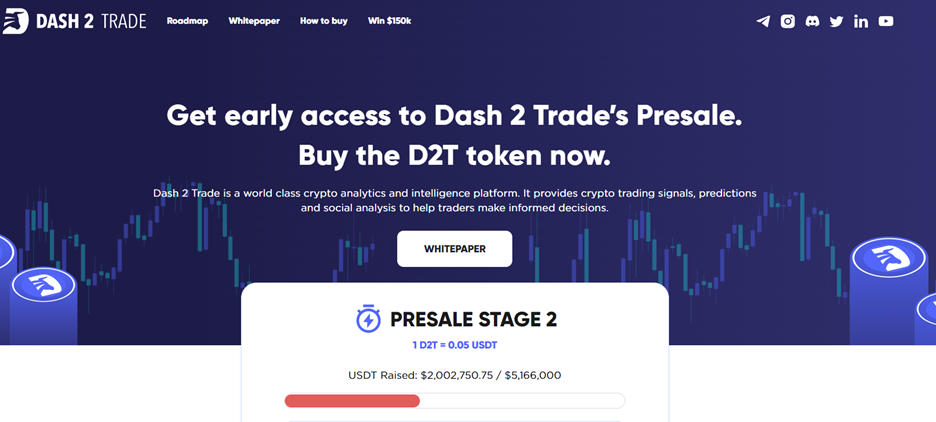
Shiba Inu is one of the most famous meme coins in the crypto space but while it has struggled to make any gains in 2022, crypto analytics platform Dash 2 Trade is expected to make significant gains – and secured almost $2 million in just three days after its presale went live.
Amid an ongoing bear market and SHIB unable to maintain any momentum, smart investors are turning to new crypto presale projects to maximize their returns.
SHIB Price Prediction: More Pain Ahead
Shiba Inu enjoyed exponential growth in 2021 but has struggled throughout 2022, where it is currently trading 70% down from January and a massive 87% down from its all-time high.
While the project has added utility, including gaming projects and a layer 2 solution, the announcements have done little to affect price.
With unfavorable macroeconomic conditions and Bitcoin forecast to drop even further, SHIB is predicted to bleed even more.
Just like early SHIB investors saw the most gains, investors in presale projects have continued to make strong returns in 2022.
Dash 2 Trade Presale Secures Nearly $2 Million in Three Days
The Dash 2 Trade presale went live on October 20 with 35 million tokens available for $0.0467 each.
Investors rushed to buy into the project with the phase 1 cap of $1.7 million reached in just three days given its low entry point and high returns potential as one of the best ICOs of 2022.
The crypto signals project, which will send out trading alerts and track various metrics to help users maximize their earning potential, has nine stages of presale.
By the final stage, the native D2T token will be on sale for $0.0662 – an increase of 39% over phase 1.
Dash 2 Trade 10x Potential
Dash 2 Trade has the potential to 10x by the end of the year given its low starting price and small max supply and is one of the best cryptos to buy now.
For D2T to 10x it would only need to trade at $0.472 – with a market cap of under $500 million.
With just a 1 billion max supply – and 700 million tokens available in the presale – it will also only take a $1 billion market cap to reach $1 each.
That would represent a massive 21x from the first phase and, given the potential of its protocol, is very achievable.
For SHIB to do 10x from its current price it would need a market cap of $50 billion – currently bigger than every coin except Bitcoin, Ethereum, and USDT.
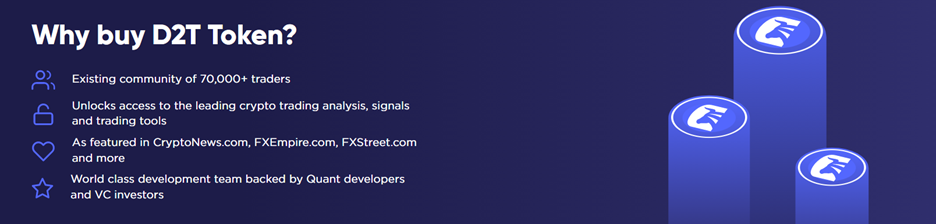
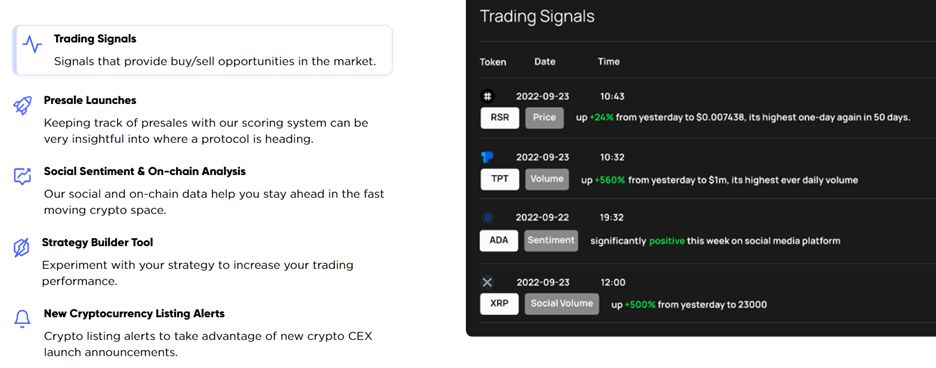
Dash 2 Trade is a new crypto intelligence platform that aims to help users make better-informed decisions on their holdings and maximize returns.
It will do that in a number of ways, tracking various metrics to send out trading signals when good buy or sell opportunities appear, and spotting trends by analyzing on-chain data and social sentiment.
Users can also access a variety of trading and social trading tools, back-testing them in real-time and discussing strategies to optimize approaches without risking capital.
The dashboard will also include a new and bespoke tracker for crypto presales, using a variety of insights to ensure confidence.
Who is Behind Dash 2 Trade?
Crypto presales can come with risk attached but Dash 2 Trade is extremely low-risk.
The team is doxxed and KYC-verified by CoinSniper – they are the same group behind Learn2Trade, a beginners’ trading platform with more than 70,000 global users.
The token’s contract is rug-proof having been audited by SolidProof.
How Does Dash 2 Trade Work?
Dash 2 Trade works with a monthly subscription, with users picking one of three price tiers to access different features.
The tiers are Free (zero fees), Starter (400 D2T per month), and Premium (1,000 D2T per month).
While the Free tier has access to limited insights and intelligence, Premium level users are granted use of all metrics, and tools, as well as bonus features such as trading competitions.
Shiba Inu (SHIB/USD) has added another zero after the decimal point for its current price. As of press time, the cryptocurrency was exchanging hands at $0.00000996, losing 3% in the week. A brief technical outlook shows the meme token is back to its June and July lows. There are positive things, however, to note.
As the Shiba community ponders when the SHIB Metaverse will come to fruition, the developers are keeping hopes alive. The team has unveiled a new concept art for its virtual reality world, dubbed Dunes.
Of course, it’s not the first time the developers have released concept art. The previous ones included the WAGNI Temple, the Rocket Pond, and Canyon. The Shiba Inu community may be less excited about the concept art, going by the lack of enthusiasm around SHIB’s price. However, it at least shows the work in progress for Shiba Inu’s virtual reality world.
Meanwhile, the SHIB burn rate is also on the rise. In the last 24 hours, over 45 million tokens were burned. That represented a 1,860% spike in burn for the meme cryptocurrency. The burning mechanism aims to tame falling SHIB prices. However, investors are hearing none of it. Some are even questioning whether SHIB will survive till the end of 2023. How can that be?
The community is concerned that despite the introduced burn mechanism, SHIB continues to decline. The lack of real utility of the token has been blamed for limited network activity and growth.
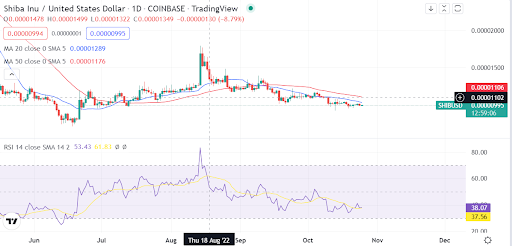
SHIB continues to slide below moving averages
Source – TradingView
The technical outlook is bleak for SHIB. Despite sitting at support, sellers are active at the current price. An RSI reading of 38 suggests that there are more sellers, and we are yet to get to the oversold zone. The price momentum is weak as moving averages continue to offer resistance above.
What next for SHIB?
The technical indicators and price momentum pits SHIB back to the June lows of $0.0000072.
However, with the extremely low valuations, more utility for the meme token could allow SHIB to surprise markets. That’s what SHIB is known for – making parabolic moves at the slightest of positive news. Consequently, whereas there is a risk for SHIB, it also carries an unprofaned opportunity.
Where to buy SHIB
eToro
eToro offers a wide range of cryptos, such as Bitcoin, XRP and others, alongside crypto/fiat and crypto/crypto pairs. eToro users can connect with, learn from, and copy or get copied by other users.
Bitstamp is a leading cryptocurrency exchange which offers trading in fiat currencies or popular cryptocurrencies.
Bitstamp is a fully regulated company which offers users an intuitive interface, a high degree of security for your digital assets, excellent customer support and multiple withdrawal methods.
Bitcoin’s price is experiencing its lowest level of volatility since 2012 and bullish traders defended the $19k level for the 41st consecutive day on Monday. Despite holding $19k, when traders settled-up at 12:00 AM UTC, BTC’s price was -$239.8 for the day.
We’re starting our price analyses today with the BTC/USD 1W chart below from ft-73. BTC’s price is trading between the 0 fibonacci level [$17,664.04] and the 0.382 fib level [$37,230.34], at the time of writing.
Bullish traders need to do more than just stall bearish momentum and they firstly need to regain BTC’s 2017 ATH [$19,891] with a second target of eclipsing the asset’s 200WMA [$23,719].
Above those targets are the typical fib level aims of 0.382, 0.5 [$43,296.39], 0.618 [$49,362.44], 0.786 [$57,998.85] and the 1 fib level [$69,000] on the BITSTAMP chart.
From the perspective of bearish traders, they’re looking to again send BTC’s price below the 0 fib level which will mark a fresh 2022 and 12-month low for the asset.
BTC/USD 1W chart: the price is trading between the 0 fibonacci level [$17,664.04] and the 0.382 fib level [$37,230.34]
Traders can see just how low the volatility is on the chart below from Babenski.
Chart with volatility index
The Fear and Greed Index is 20 Extreme Fear and is -2 from Monday’s reading of 22 Extreme Fear.
The Fear and Greed Index is 20 Extreme Fear
Bitcoin’s Moving Averages: 5-Day [$19,231.25], 20-Day [$19,438.56], 50-Day [$20,069.44], 100-Day [$21,267.31], 200-Day [$29,911.07], Year to Date [$30,612.38].
BTC’s 24 hour price range is $19,157-$19,601.2 and its 7 day price range is $18,788.33-$19,660.63. Bitcoin’s 52 week price range is $17,611-$69,044.
The price of Bitcoin on this date last year was $63,100.
The average price of BTC for the last 30 days is $19,335.8 and its -0.2% over the same stretch.
Bitcoin’s price [-1.23%] closed its daily candle on Monday worth $19,331.4 and in red figures for the first time in four days.
Ethereum Analysis
Ether’s price was also sent lower on Monday and ETH finished the day -$20.31.
The ETH/USD 1D chart by EdgarTigranyan is the second chart we’re focusing on this Tuesday. ETH’s price is trading between the 100.00% fib level [$1,217.87] and 78.60% [$1,341.25], at the time of writing.
If bullish traders can regain the 78.60% fib level their targets are as follows, 65.00% [$1,419.67] 61.80% [$1,438.12], 50.00% [$1,506.15], 38.20% [$1,574.18], 23.60% [$1,658.36], and a full retracement at 0.00% [$1,794.43].
Bearish Ether traders are conversely trying to continue ETH’s downtrend that began during the week leading up to The Merge. The targets to the downside for bears are the 100.00% fibonacci level followed by the 161.80% fib level [$861.56].
ETH/USD 1D chart: the price is trading between the 100.00% fib level [$1,217.87] and 78.60% [$1,341.25]
Ether’s Moving Averages: 5-Day [$1,308.50], 20-Day [$1,321.38], 50-Day [$1,475.22], 100-Day [$1,444.33], 200-Day [$2,077.12], Year to Date [$2,145.14].
ETH’s 24 hour price range is $1,324.17-$1,370.6 and its 7 day price range is $1,264.48-$1,370.6. Ether’s 52 week price range is $883.62-$4,878.
The price of ETH on this date in 2021 was $4,220.35.
The average price of ETH for the last 30 days is $1,316.22 and its +1.73% over the same interval.
Ether’s price [-1.49%] closed its daily candle on Monday worth $1,343.88 and in red digits also for the first time in four daily candle closes.
Shiba Inu Analysis
Shiba Inu’s price followed the macro market cap low on Monday and when SHIB’s daily candle was printed it was -$0.0000024.
The final chart we’re looking at today is the SHIB/USDT 4HR chart below from abanefsobulls. Shib’s price is trading between the 0.236 fib level [$0.000009884] and 0.382 [$0.00001021], at the time of writing.
The overhead targets for bullish SHIB traders are 0.382, 0.5 [$0.00001051], and 0.618 [$0.00001081].
Bearish SHIB traders that are still short the asset want to push SHIB’s price below the 0.236 fibonacci level followed by a target of a full retracement back at 0 [$0.00000924].
SHIB/USDT 4HR chart: the price is trading between the 0.236 fib level [$0.000009884] and 0.382 [$0.00001021]
Shib’s 24 hour price range is $0.00000984-0.00001019 and its 7 day price range is $0.00000974 / $0.00001045. Shiba Inu’s 52 week price range is $0.00000716-$0.0000884.
Shib’s price on this date last year was $0.00003599.
The average price of SHIB over the last 30 days is $0.00001068 and its -8.2% over the same duration.
Shiba Inu’s price [-2.36%] closed its daily session on Monday worth $0.00000992 and in red digits for the second time over the last three days.


 Source – TradingView