Tag: prices

  • Strategy boosts Bitcoin holdings to $73B amid record-high prices

    Strategy boosts Bitcoin holdings to $73B amid record-high prices

    Bitcoin

    • Strategy bought 4,225 Bitcoin for $472 million, bringing its total holdings to $73 billion.
    • The company raised funds through preferred shares and plans to report a multi-billion-dollar profit next month.
    • Strategy’s stock is up over 3,300% since 2020 as Bitcoin strategy drives its $121 billion market cap.

    Michael Saylor’s Bitcoin-focused company, Strategy (formerly MicroStrategy Inc.), has further expanded its already massive cryptocurrency holdings with a recent purchase of 4,225 Bitcoin tokens.

    According to a regulatory filing with the U.S. Securities and Exchange Commission (SEC) on Monday, the company spent $472 million during the seven days ending July 13, acquiring the tokens at an average price of $111,827 each.

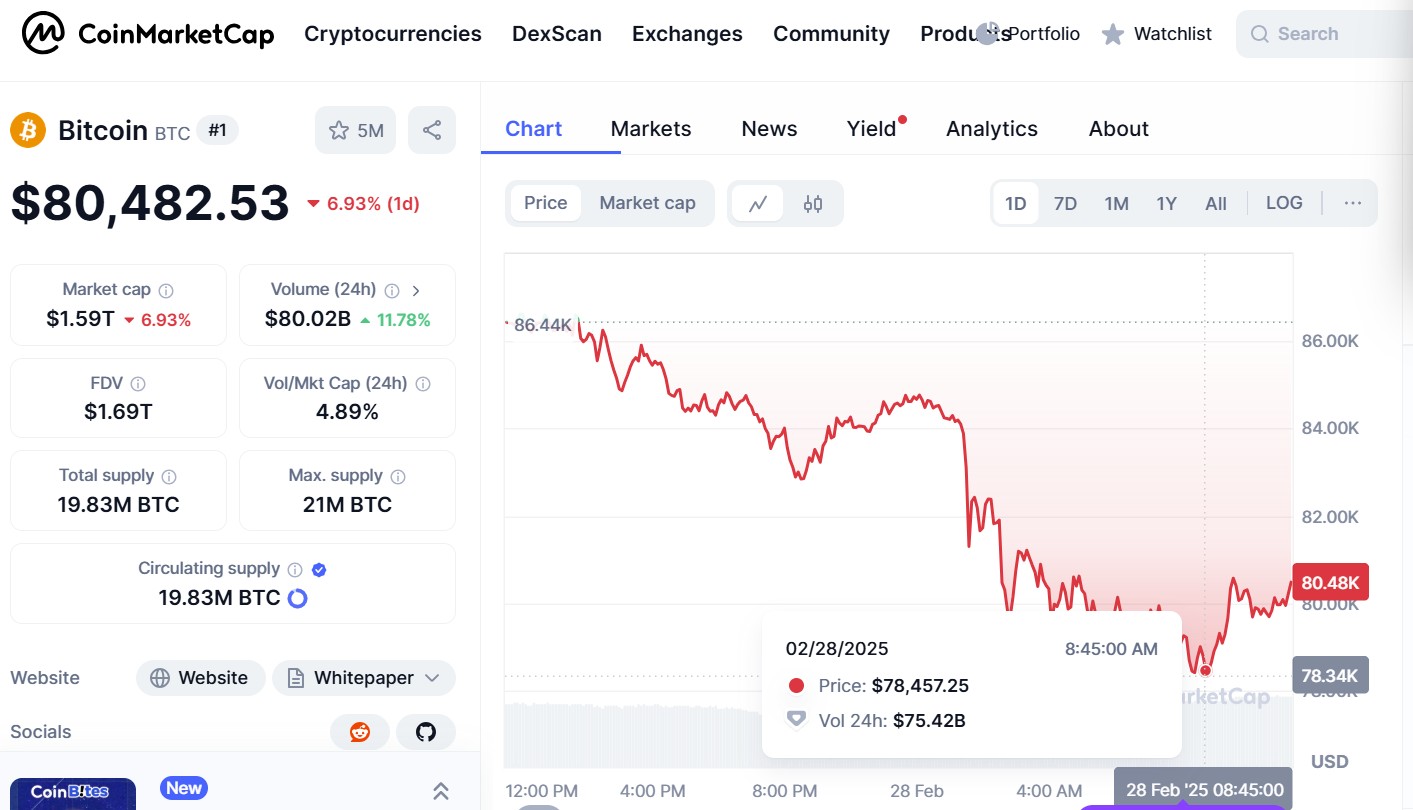
    This purchase comes as Bitcoin trades near all-time highs, recently hitting $123,000 before slightly retreating to $120,483 as of writing this.

    With this latest acquisition, Strategy now holds Bitcoin valued at approximately $73 billion, representing about 2.8% of the total 21 million Bitcoin that will ever exist.

    The company remains the largest corporate holder of Bitcoin globally.

    The purchase was funded through proceeds from the sale of preferred shares via Strategy’s at-the-market (ATM) program.

    The firm raised the full $472 million last week through three offerings of these stock-like products, which are tradable indefinitely and offer dividend payouts.

    The use of preferred equity instead of common stock marks a strategic shift in how Strategy finances its growing Bitcoin portfolio.

    Strategy eyes profit amid accounting changes and crypto surge

    Strategy is poised to report a multi-billion-dollar profit in its upcoming earnings release, benefiting from both the strong rebound in Bitcoin prices and changes to accounting standards that now more accurately reflect the value of its digital asset holdings.

    The company has spent $7.24 billion on Bitcoin in the current quarter across 13 separate transactions, according to Bloomberg.

    This aggressive accumulation aligns with the Strategy’s long-standing approach of using Bitcoin as a hedge against inflation, a strategy first initiated in mid-2020.

    Since then, the company’s stock has surged over 3,300%, significantly outperforming traditional equity benchmarks.

    During the same period, Bitcoin has risen by more than 1,000%, while the S&P 500 has gained approximately 115%.

    The potential for substantial quarterly earnings also reflects the increasing institutional acceptance of Bitcoin as a store of value.

    For Strategy, this bolsters its positioning as both a technology company and a de facto Bitcoin investment vehicle.

    Market cap climbs as Bitcoin strategy evolves

    Strategy’s market capitalization now exceeds $121 billion, a figure largely driven by investor enthusiasm over its bold Bitcoin-centric approach.

    The company’s commitment to consistently increasing its exposure to the cryptocurrency market has transformed its profile on Wall Street and among digital asset advocates.

    The firm’s decision to rely more heavily on preferred share offerings suggests a deliberate shift to reduce dilution for common shareholders while continuing to pursue large-scale Bitcoin acquisitions.

    The nature of these instruments—tradable forever and dividend-paying—may also appeal to a broader base of investors looking for exposure to crypto-linked equities with income potential.

    With Bitcoin prices hovering near record highs and regulatory scrutiny of digital assets ongoing, Strategy’s actions will continue to be closely watched by both crypto investors and traditional market participants.

    As the company prepares to release its quarterly results next month, all eyes will be on whether its aggressive bet continues to pay off.

    Source link

  • Bitcoin falls to $103K, options skew hits 3-month low as mideast tensions drive oil prices higher

    Bitcoin falls to $103K, options skew hits 3-month low as mideast tensions drive oil prices higher

    Bitcoin falls to $103K, options skew hits 3-month low as mideast tensions drive oil prices higher

    A sharp escalation in Middle East tensions sent shockwaves through global financial markets in the early Asian trading hours, triggering a significant spike in oil prices and prompting a flight to safety.

    Bitcoin (BTC) was not immune to the turmoil, experiencing a notable price drop as traders scrambled for downside protection, evidenced by a dramatic crash in short-term options skew.

    The seven-day skew for Bitcoin options, a key metric that measures the relative cost of bullish calls versus bearish puts listed on Deribit, plummeted to -3.84%.

    This marked its lowest point since April 16, according to data from Amberdata.

    In practical terms, this means put options, which offer traders protection against price declines, became the most expensive relative to call options in three months.

    The surge in demand for these protective puts also dragged the 30-day and 60-day skews into negative territory, signaling a broader shift towards caution among market participants.

    Traders typically purchase put options either to hedge existing long positions in the spot or futures markets or to directly profit from an anticipated fall in prices.

    The clear preference for puts indicates a growing unease about Bitcoin’s near-term trajectory amidst the heightened geopolitical uncertainty.

    Bitcoin’s price reflected this nervousness, falling to its 50-day simple moving average (SMA) at $103,150, extending its 24-hour losses to 4.59%, according to CoinDesk data.

    This decline represented a significant retreat from earlier in the week when prices had briefly topped the $110,000 mark.

    Market bulls are now likely hoping that the 50-day SMA will provide a crucial support level, as a sustained break below it could attract further selling pressure, a pattern observed when this support level failed back in February.

    Oil surges as geopolitical cauldron boils over

    The catalyst for this market turbulence was a dramatic escalation in the Middle East.

    The per-barrel price of WTI crude oil surged by over 6% to $74.30, reaching its highest level since February 3 and extending its weekly gain to an impressive 13%, according to data from TradingView.

    This sharp upward movement in oil prices reportedly followed news of Israeli airstrikes on Iran, which supposedly drew retaliatory missile action from Tehran, though details remained fluid.

    Inflationary shadows and Fed policy under scrutiny

    Sudden and significant spikes in oil prices tend to have a global inflationary impact, and this latest surge is no exception.

    Concerns are now mounting that this could inject fresh inflationary pressures into economies worldwide, at a time when President Donald Trump’s ongoing trade war already threatens to disrupt economic stability and fuel inflation, particularly in net-importer countries.

    This confluence of factors could significantly dent market expectations for Federal Reserve rate cuts.

    If inflation re-accelerates, the Fed may be less inclined to ease monetary policy, potentially adding to downside volatility in both stocks and cryptocurrencies.

    As of writing, futures tied to the S&P 500 were trading 1.5% lower on the day, reflecting the broader risk-off sentiment.

    Traditional markets reel from geopolitical shock

    The reaction in traditional markets was swift and pronounced. US stock index futures were down approximately 1.5% across the board following the news from the Middle East.

    European market futures mirrored this decline, also trading down by roughly the same margin.

    In a classic flight to safety, bond prices moved higher as investors sought refuge from the volatility.

    Gold, another traditional safe-haven asset, also saw increased demand, adding about 0.75% in the past hour to trade at $3,428 per ounce.

    Crude oil, as previously noted, had soared by an even more dramatic 9% to $74 per barrel in the immediate aftermath of the reports.

    The 10-year Treasury yield dipped two basis points to 4.32%, indicating increased demand for US government debt.

    Currency markets also reflected the shifting risk landscape, with the US dollar gaining against the euro and the British pound, but losing ground against traditional safe-haven currencies like the Japanese yen and the Swiss franc.

    Source link

  • Crypto prices fall despite Trump’s Bitcoin reserve plan

    Crypto prices fall despite Trump’s Bitcoin reserve plan

    Bitcoin dips to $86k

    • Bitcoin was trading at around $88,000, dropping 1.50% in the last 24 hours
    • Ethereum, XRP, Solana, and Cardano have also seen prices dip following news of the Digital Asset Stockpile
    • TD Cowan analysts consider it a “compromise” and that the reserve is a positive move from the White House

    Crypto prices remained unchanged on Friday after US President Donald Trump signed an executive order establishing a Strategic Bitcoin Reserve.

    Data from CoinMarketCap shows Bitcoin is trading around the $88,000 mark, dropping over 1.50% in the last 24 hours.

    Bitcoin price chart. Source: CoinMarketCap

    Ethereum, XRP, Solana, and Cardano have also remained relatively flat following the news. Solana saw the biggest drop, 5% over 24 hours, and is currently trading at $142. Earlier this month, Trump revealed that these would be the coins included in the crypto reserve.

    Notably, these coins weren’t mentioned in Trump’s executive order detailing a Strategic Bitcoin Reserve and a Digital Asset Stockpile, which he signed on March 6.

    A “compromise”

    In a post on X, White House artificial intelligence (AI) and crypto czar David Sacks said:

    “The Reserve will be capitalized with Bitcoin owned by the federal government that was forfeited as part of criminal or civil asset forfeiture proceedings. This means it will not cost taxpayers a dime.”

    Sacks also indicated that the executive order authorized the Secretaries of Treasury and Commerce “to develop budget-neutral strategies for acquiring additional Bitcoin, provided that those strategies have no incremental costs on American taxpayers.”

    In response, Michael Saylor, chair and CEO of Strategy, said: “I have a few budget-neutral strategies for acquiring additional Bitcoin.”

    With the news of the Strategic Bitcoin Reserve not pushing prices higher, TD Cowen analysts said they considered this a positive move from the White House, adding:

    “We view this as a compromise. The government is not spending taxpayer dollars to acquire new digital assets. It is simply not selling the ones that it seizes.”


    Source link

  • Unity Wallet COO: three factors are affecting crypto market prices

    Unity Wallet COO: three factors are affecting crypto market prices

    • The Bybit hack has increased fears over centralized exchange security vulnerabilities
    • US President Donald Trump’s trade tariffs are increasing market uncertainty
    • Trump’s crypto promises may have started as being great, but they could end up proving catastrophic

    Three things are contributing to the drop in crypto prices, which has seen Bitcoin fall 7.50% over 24 hours to $78,000, according to Unity Wallet’s COO.

    BTC price at $78,000. Source: CoinMarketCap

    It’s a significant drop from Bitcoin’s all-time high, which reached $109,000 in January ahead of US President Donald Trump’s inauguration.

    According to James Toledano, it feels like optimism around the crypto market post-election created a bubble and that the “reality post-inauguration is now setting in – and hard,” he said to CoinJournal.

    In Toledano’s view, the Bybit hack at the crypto exchange last Friday—which resulted in the theft of nearly $1.5 billion worth of Ethereum—is one of the contributing factors affecting crypto prices.

    Undermining investor confidence, it has led to panic withdrawals and a market-wide selloff across the board. While Bybit’s CEO, Ben Zhou, quickly responded to the hack, the situation has increased “fears about centralized exchange security vulnerabilities—which only solidifies the case for self-custodial services,” Toledano continued.

    Dom Harz, co-founder of BOB (“Build on Bitcoin”), a hybrid Layer-2, said to CoinJournal the theft at Bybit is a “stark reminder of the industry’s fundamental issues,” adding:

    “We’ve been hypnotized by price spikes, memecoin frenzies, and media spectacles, forgetting that crypto was meant to be a new financial system—one built on decentralized protocols that make finance accessible to everyone. Bybit just gave us a $1.5 billion reminder that we are nowhere near that reality.”

    Trump’s tariffs

    The continued market selloff follows Trump’s trade tariff announcement earlier this week.

    During his election campaign, the US president made promises regarding crypto, stating that America will be the “crypto capital of the planet.”

    Since entering the White House, he has appointed pro-crypto individuals to reshape government agencies, namely Paul Akins as the incoming chair of the US Securities and Exchange Commission (SEC).

    Mark Uyeda is currently acting chair of the SEC.

    Trump also signed an executive order to establish a crypto working group to provide regulatory clarity. It’s also expected that the working group will look into the potential of a national crypto stockpile.

    Yet, despite these steps, Trump’s trade wars—which could soon hit the EU, the world’s largest trading bloc, with a 25% tariff—is increasing market uncertainty.

    According to Toledano, Trump’s tariffs are “harming the global economy” and that many in the crypto space feel let down by the US president.

    “The promise was great and the reality is potentially proving to be catastrophic,” he added. “It does make me wonder if Trump understands that financial verticals are interlinked and increasingly converging.”

    Biggest economic risk

    The third contributing factor affecting market prices—according to Toledano—are questions around the overall governance of the US.

    An article by Chatham House suggests that the biggest economic risk from Trump’s presidency is a loss of confidence in US governance. It reads that while Trump’s policies may seem mild in the short term, steps that undermine the US and its international allies could have lasting effects.

    “I rarely get spooked from the peaks and troughs that crypto presents but when I combine what’s happening with traditional equities volatility, I think there is cause for concern right now,” said Toledano.

    Source link

  • iDEGEN hits public shelves with momentum as crypto prices crash

    iDEGEN hits public shelves with momentum as crypto prices crash

    Bitcoin dump

    AI meme crypto market has grown to a market cap of $2.4 billion, and iDEGEN is set to take its rightful position on the table. After three months in the presale stage, it has hit the public shelves with the same viral momentum. 

    Its early adopters are set to continue reaping big from the project as the uncensored AI agent revolutionizes the crypto space. In addition to the 300,000% gains already locked in, its value may surge by at least 10X in coming months. This is despite the selling pressure current felt across the crypto majors.

    Ripple price chart pattern hints at further selling pressure in the short term

    After trading steadily above the support zone of $2.5000 in the past one week, Ripple price has plunged by about 16% since Monday. Similar to other crypto majors, the altcoin is under pressure as extreme fear grips the broader market. 

    A look at its daily chart points to the formation of a bearish death cross pattern as the short-term 25-day EMA crosses the 50-day EMA to the downside. In the near term, the range between $2.0000 and $2.3357 is worth watching. For a firm trend reversal, the bulls will need to gather enough momentum to rebreak the resistance at $2.5500.

    XRP Price
    XRP Price

    iDEGEN debuts on Raydium with the same viral momentum

    iDEGEN has hit the public shelves as promised; ending the three-month-long presale. It has debuted on Raydium, a Solana-based DEX and is set to also list on BitMart on 4th March.

    What started on a blank slate ready to learn from the crypto degens on X has grown into an ultra-popular AI crypto with the potential to compete with other AI meme coins like AI16Z, Hamster Kombat, and Fartcoin. 

    In three months, it has managed to raise $25 million. This has been made possible by its aggressive community, apt timing, and booming AI crypto market. If the presale is anything to go by, its viral momentum is set to yield growth of atleast 10X in the coming months. At its last stage price of $0.038, its early adopters are already enjoying returns of upto 300,000%. 

    Bitcoin spot ETF records streak of outflows as tariff jitters persist

    Bitcoin price

    Concerns over the impact that Trump’s trade policies will have on the US economy have triggered a shift in the market sentiment. Compared to last week’s neutral level of 49, the crypto fear & greed index is now at an extreme fear level of 10. 

    With the resultant plunge in Bitcoin price, Bitcoin spot ETFs have seen persistent outflows as its institutional demand falls. According to SoSoValue, Bitcoin spot ETFs recorded daily total outflows of $754.53 million on Wednesday. Notably, the trend has been on for 7 sessions in a row. 

    On its daily chart, the bearish death cross pattern points to continued selling pressure in the short term. At its current level, the bulls will be keen on defending the support at $81,600. A subsequent correction may have it rebound past $85,000 to find resistance at $90,000. 


    Source link

  • Weekly price analysis: prices range on uncertain economic outlook

    Weekly price analysis: prices range on uncertain economic outlook

    • Crypto prices traded within a range last week as crypto takes is relegated to the back burner in the wake of economic uncertainties
    • Exchange-traded fund (ETF) inflows were negative as Bitcoin ETFs logged net outflows of $62.9 million while Ethereum ETFs logged $8.9 million in outflows

    Bitcoin

    Bitcoin’s price action continued trading rangebound, with weekly highs and lows of $99,509 and $93,331, as uncertainty looms around inflation, US President Donald Trump’s policies, and geopolitical events.

    Zooming out, we see that price action has ranged at the daily support level for the last three weeks as current market conditions lack sufficient catalyst to push prices to new highs.

    BTC/USD chart by TradingView

    Open interest mimics price action as the week began with a reduction in the volume of open contracts which picked up on Wednesday, February 19, congruent with price action.

    CME BTC Futures Open Interest (USD) chart by Coinglass

    Outlook

    Bitcoin must remain above the daily support of $90,673 to remain in bullish territory. A close below this level on the daily time frame could trigger a fall to the $84,000 level.

    Meanwhile, market sentiment has cooled significantly over the last month and is in neutral territory.

    Bitcoin trades at $87,900 as of publishing.

    Ethereum

    Ethereum’s price action ranged last week logging a weekly high and low of $2,848 and $2,604 despite last week’s news of the Bybit hack.

    ETH/USD chart by TradingView

    Zooming out, we see a bleaker picture as ETH has been trending lower since December 09 after failing to break above its March 2024 high.

    ETH/USD chart by TradingView

    Open interest data shows a steady rise in contract volume throughout the week though price traded rangebound.

    Binance ETH Futures Open Interest (USD) chart by Coinglass

    Outlook

    We reckon the next major support zone for ETH is the $2,500 level which has proven to be a strong liquidity level in the past.

    ETH/USD chart by TradingView

    ETH trades at $2,384 as of publishing.

    Solana

    Like Ethereum, Solana’s price has been declining since it failed to swing higher and form new candles above the last all-time high on the daily time frame.

    SOL/USD chart by TradingView

    Unlike Ethereum, last week’s price action was bearish as the price fell from a weekly open around $194 to a close around $171.

    SOL/USD chart by TradingView

    Open interest charts show topsy-turvy movement in open contract volumes as the price falls.

    Binance SOL Futures Open Interest (USD) chart by Coinglass

    Outlook

    The next major support zone for Solana is at the $129 level. However, we may see smaller rallies as price trends lower overall.

    SOL/USD chart by TradingView

    Source link

  • Weekly price analysis: crypto prices reel from risk off sentiments

    Weekly price analysis: crypto prices reel from risk off sentiments

    • The crypto market trended lower last week as US tariffs rocked the market, causing investors to flee to safe-haven assets like Gold
    • Crypto prices, which recovered slightly on Monday and Tuesday, continued trending downward as uncertainty looms
    • Meanwhile, spot ETF inflows remained positive despite some days of outflows

    Bitcoin

    Bitcoin’s price trended lower over the last week following US President Donald Trump’s announcement of tariffs on Canada, Mexico, and China. Investors fled to safe-haven assets like gold while risky assets, like crypto, trended lower.

    However, the tariffs are a catalyst for faster price declines as price action shows that Bitcoin was already on a decline in its substructure after failing to swing higher than the $108,000 level three weeks ago.

    BTC/USD chart by TradingView

    BTC made two consecutive lower lows on the substructure over the last two weeks and traded into the daily demand zone early last week, logging a weekly low of $91,176.94.

    After buying from the demand zone, the price rose to an internal supply zone at $102,000, validated by the 50% Fibonacci level, and sold off that zone to end the week at $96,475.03.

    BTC/USD chart by TradingView

    On the CME, where Bitcoin Futures are traded the most, open interest fell last week as traders closed contracts due to uncertainty caused by Trump’s tariffs.

    Meanwhile, spot BTC ETFs logged a positive week as net flows printed $208.30 million despite two days of major outflows.

    Price Outlook

    Provided the price remains above the demand zone on the daily timeframe, then Bitcoin’s overall structure should remain bullish despite price declines on the substructure.

    However, a daily close below the demand zone, i.e., below the $90,000 level, may trigger a sell-off to support levels around $84,000 or lower.


    BTC trades at $97,624.73 as of publishing.

    Ethereum

    After failing to break above March 2024 highs, Ethereum’s price has been on a downtrend on its substructure since mid-December 2024.

    On the 4-hour time frame, the price logged consecutive lower lows with the most recent low of $2,148.00 reached early last week. Price has improved since then, closing last week at $2,632.16.

    Open interest on Binance, where Ethereum Futures are traded the most, shows a decline in the number of open contracts, which could be another catalyst for price declines.

    Meanwhile, spot ETH ETFs logged positive inflows on all days last week, aside from Friday when it logged no inflows (or outflows), totalling $420.20Mn for the week.

    Price Outlook

    The next probable zone for ETH’s price to fall is a major support zone around $2,200. With Trump planning to impose a 25% tariff on steel and Aluminum as well as a fresh round of retaliatory tariffs against trade partners, more uncertainty could push ETH’s price there soon.

    ETH trades at $2,640.05 as of publishing.

    Source link

  • Weekly price analysis: prices decline on risk-off sentiments

    Weekly price analysis: prices decline on risk-off sentiments

    • The crypto market trended lower last week, driven largely by risk-off sentiments on newly released Fed meeting notes and economic data
    • The Fed expressed caution around inflation, especially as President-elect Donald Trump’s policies will kick in after his inauguration on January 20
    • Meanwhile, spot crypto exchange-traded funds (ETFs) logged outflows from Wednesday, January 8

    Bitcoin

    Bitcoin’s price logged a negative week falling from a high of $102,733 to a low of $91,188 before eventually closing at $94,547.

    Technical analysis shows a break above the last lower high and a push back down into the H4 demand zone, which means that although the price took a bearish turn, it is still in overall bullish territory.

    BTC/USD Chart by TradingView

    Much of this bearish sentiment is driven by bleak economic expectations. The US Federal Reserve meeting minutes, released on January 8, showed that the reserve bank is cautious about inflation it expects will follow President-elect Donald Trump’s policies.

    As such, the likelihood of continued rate cuts has dwindled, with some analysts seeing an end to cuts early this year. The market’s reaction reflects this updated risk-off sentiment.

    Bitcoin’s open interest chart shows a decline in open contracts between Wednesday and now. Open interest hit a weekly high on Tuesday at $18.16 billion on the CME, fell to a low on Thursday ($16.55 billion), and mellowed out the rest of the week.

    CME BTC Futures Open Interest (USD) Chart by Coinglass

    Meanwhile, spot Bitcoin ETFs logged outflows after the release of the Fed’s meeting minutes on Wednesday. Outflows totalled $718.20 million while inflows totalled $1.03 billion.

    Outlook

    Bitcoin’s price currently hovers around the bottom of the demand zone. If it breaks below, its price could be pushed down to $85,100 where a fair value gap could act as support.

    BTC/USD Chart by TradingView

    BTC trades at $91,622 as of publishing.

    Ethereum

    Ethereum’s price also logged a negative week, falling from a high of $3,744 to a low of $3,157 before closing at $3,236. ETH price action tested March 2024’s high of $4,089  in early December 2024, but failed to break above and has been logging lower lows since.

    ETH/USD Chart by TradingView

    Open interest dropped from a January 7 high of $3.50 billion and continued to decline until it was $2.63 billion as of this publication.

    CME ETH Futures Open Interest (USD) Chart by Coinglass

    Meanwhile, Ethereum spot ETFs logged a weekly net outflow of $186.00 million following risk-off sentiments in the market.

    Outlook

    As Ethereum’s price continues to trend lower, the next technical level that could provide support is the fair value gap at the $2,893 price level.

    ETH trades at $3,071 as of publishing.

    Solana

    Solana’s price fell from a weekly high of $223 to a weekly low of $181 before eventually closing at $188, logging a total loss of 12.53%. SOL continues to trend lower after failing to close above its all-time high of $260.

    Open interest data shows a steep fall from $1.89Bn on Binance on Jan. 7 to $1.58Bn on Jan. 10. As of this publication, OI levels have improved to $1.63Bn.

    Outlook

    The next technical support zone is at the $164 price level. However, although the order block is a support, it is a poor low that could be taken out even if price reverses from that zone.

    SOL trades at $176 as of publishing.

    Ripple

    Ripple’s price fared better last week, closing higher at $2.55 from $2.38 at the start of the week as price continued to log higher highs. Zooming out, the price continues to range between $1.90 and $2.90 as the market cools.

    Open interest rose on Bitget, the exchange with the highest XRP derivative trading volume, over the last week, supporting upward price movement as positive news around Ripple’s case with the SEC boosted sentiments.

    Outlook

    Ripple’s price is buoyed by news around the SEC’s lawsuit against its parent company, a case which could be thrown out with the outgoing administration.

    However, technical analysis shows that XRP trades at a premium and a pullback is expected. The most likely levels are the fair value gap at $1.75 and the order block at $1.46.

    XRP trades at $2.37 as of publishing.

    Source link

  • Bitcoin, Ether prices up as stocks tank on new bank fears

    Bitcoin, Ether prices up as stocks tank on new bank fears

    • Bitcoin (BTC) and Ethereum (ETH) prices rose nearly 2% respectively as stocks plunged.
    • The S&P 500 was down 1.5% as two bank stocks plummeted.
    • BTC and ETH gains saw altcoins in the top 10 cryptocurrencies by market cap up.

    Bitcoin (BTC) price moved above $28,500 again on Tuesday, rising more than 2% in early morning trades during the US trading session. The upside was yet another attempt by Bitcoin bulls to establish a fresj footing in the key price range.

    Elsewhere, the price of Ethereum (ETH) rose above $1,860 to hit a new 24-hour high as crypto spot markets climbed. The Ether token was 1.9% up at the time of writing, gains that were being mirrored across the top 10 cryptocurrencies by market cap list.

    BTC and ETH have traded to year-to-date highs above $31,000 and $2,100 respectively.

    Stocks tank on bank fears

    US stocks opened lower on Tuesday as stock prices of another two US banks plunged amid the latest turmoil in the banking sector. The S&P 500 was down 1.5% while Nasdaq was shedding 1.3%.

    After share prices of First Republic Bank fell in the lead up to its takeover by JPMorgan, Tuesday saw prices of Pacwest (PACW) and Western Alliance (WAL) stocks bleed massively.

    At about 12:30 pm ET, the PACW and WAL share prices were down 26% and 20% respectively.

    The two bank stocks had plummeted more than 30% earlier as investor concerns around the turbulence within the US banking system resurfaced following the losses that followed the collapse of Silicon Valley Bank.

    Also on investors’ minds this week is the Fed’s meeting that kicked off on Tuesday. While the market has the anticipated 25bps interest rate hike baked in for after the FMC meeting, what the central bank says in relation to what next is seen as key.

    Economist Mohamed A. El-Erian, commented on the market outlook, stating via a tweet:

    The roller coaster continues with, this time around, a 20 bps drop in the yield on 2-year Treasuries.  With such a key market segment continuing to be in urgent need of stabilization, it remains to be seen if the Fed serves this function tomorrow or, instead, is again a source of volatility.”

    Barry Knapp of Ironsides Macroeconomics says the Fed’s approach to the inflation question is fraught and dubious. The central bank has to consider what the market is telling it. He shared his views in an interview with CNBC’s Squawk Box.


    Source link

  • Smartest man in the room has a warning about Bitcoin prices

    Smartest man in the room has a warning about Bitcoin prices

    • Morgan Stanley’s Mike Wilson is seen as one of the best analysts in Wall Street.

    • He warned that the S&P 500 is ripe for another 21% crash.

    • If this view is valid, we could see BTC prices crash as well.

    Bitcoin price dipped to about $24,000 as a somber mood engulfed the stocks and cryptocurrency industry. After rising to a high of $25,373 during the weekend, the BTC/USD price has struggled to retest it this week. And now, one of the best sell-side analysts in Wall Street, has issued a blistering warning about the market.

    Morgan Stanley’s Wilson warning

    In a note on Tuesday, Mike Wilson, the Chief Equity Strategist at Morgan Stanley, warned that the S&P 500 could crash by another 21%. If this happens, it means that the index could crash from the current $4,000 to about $3,140. 

    Wilson noted two main things that could push the S&P 500 index much lower in the near term. First, there is a reset of expectations about the Federal Reserve. The argument is that investors were expecting the Fed will start pivoting soon. 

    However, the reality is that recent data point to more hikes this year. Inflation remains stubbornly high while the unemployment rate has fallen to a multi-decade low of 3.4%.

    Second, corporate earnings have been a bit weak. Companies like Goldman Sachs and Home Depot published relatively weak financial results. According to FactSet, S&P 500 constituent companies have had a blended growth of -4.7% in the quarter, the worst since 2020. 

    Further, with the bond yield being highly inverted, there is a likelihood that the US will go through a major recession. Stocks tend to underperform in such a period. Mike Wilson is not the only analyst worried about stocks. In a widely-read report, Jeremy Grantham warned that the S&P 500 could crash to about $3,200.

    Implications for Bitcoin prices

    Mike Wilson did not mention Bitcoin prices in his note. He did not also mention cryptocurrencies in general. However, if his warning materializes, the fact is that it will have serious implications for BTC and other cryptocurrencies.

    In the past few months, Bitcoin and stocks have had a close correlation. A close look at the data shows that BTC and S&P 500 have a correlation coefficient of 0.91. A correlation of 1 or close to 1 is usually a sign that the two assets are closely correlated. 

    Therefore, if the S&P 500 crashes by 20%, there is a high possibility that Bitcoin price will drop further than that. As such, while it is too early to predict whether Mike Wilson will be right, it makes sense to start taking profits.

    Source link