- The surge in the altcoins comes amid a broader rally triggered by Bitcoin’s new milestone.
- The daily chart for SUI reveals a bull flag pattern, often considered a continuation signal for uptrends.
- After dipping below $0.14 earlier this year, the token has reversed its downtrend.
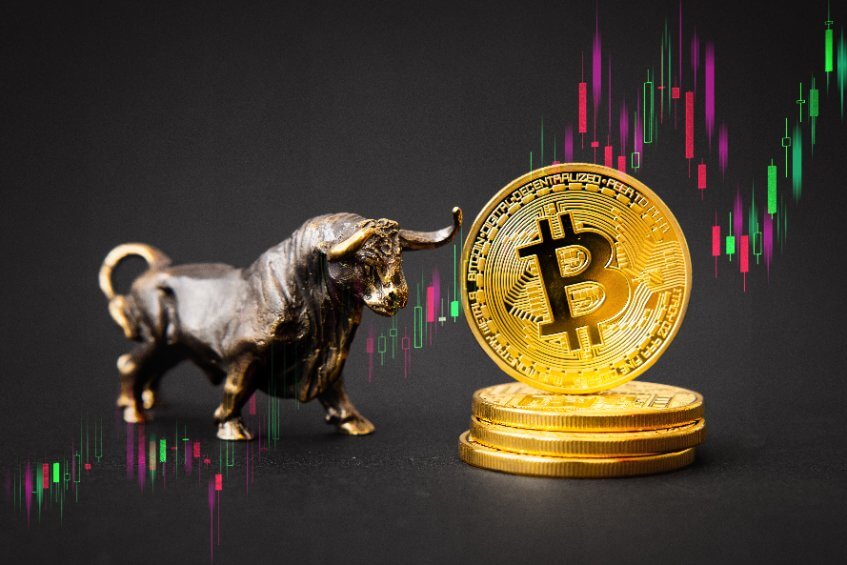
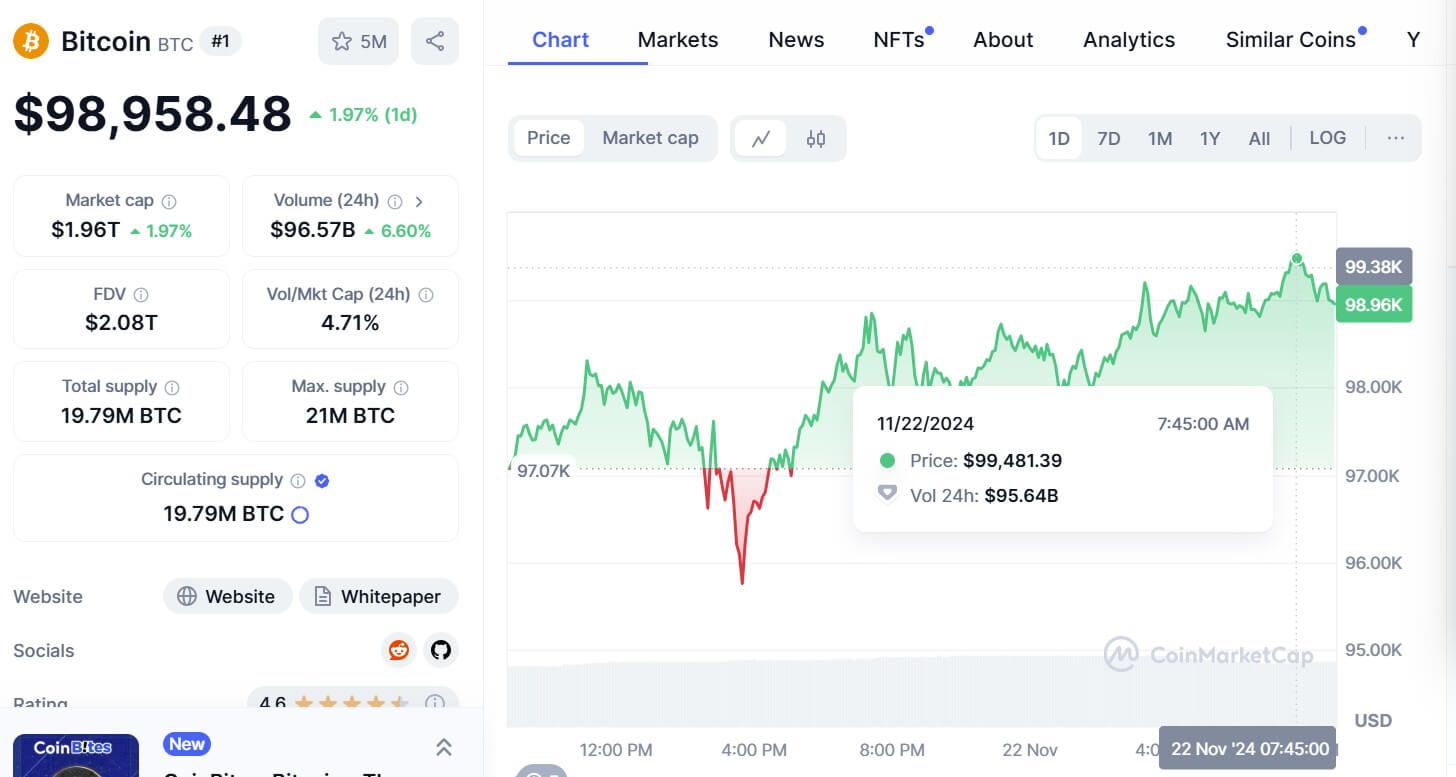
As Bitcoin pushed past $96,000 this week, it reignited interest across the altcoin market.
Among the tokens gaining significant traction are SUI and SEI, both of which are showing breakout signals following months of gradual upward movement.
With bulls regaining control and wider market sentiment turning optimistic, analysts are now closely watching these two tokens to see if they can test their respective highs in 2025.
Solana, another top-10 cryptocurrency by market cap, has also reclaimed levels above $150, contributing to renewed enthusiasm for smaller tokens like SUI and SEI.
The current price action suggests growing accumulation among traders as technical patterns hint at continued bullish momentum.
SUI’s $4 target comes into play
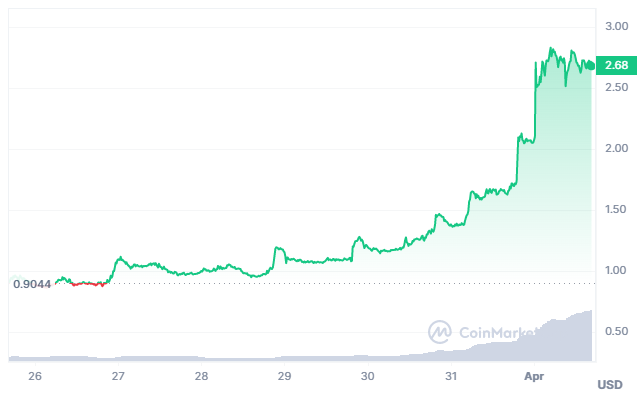
SUI, the native token of the Layer 1 blockchain developed by Mysten Labs, is showing signs of a breakout from its recent consolidation phase.
After rising 60% in a short span, the token managed to avoid a correction, instead consolidating within a narrow range for more than a week.
This range-bound behaviour has now culminated in a bullish breakout, supported by technical indicators.
The daily chart for SUI reveals a bull flag pattern, often considered a continuation signal for uptrends.
The price is now approaching resistance near the $4 level, which will be the next major test.

Source: CoinMarketCap
Meanwhile, the 50-day moving average has flipped positive, confirming a potential bullish reversal.
The MACD, though showing some decline in buying volume, remains above the zero line.
A golden cross—where the 50-day moving average crosses above the 200-day—could also occur in the near term, bolstering the bullish case.
Despite occasional dips in volume, SUI’s price action suggests investor confidence is still intact.
If this trend continues, the token could aim for a new all-time high closer to $7 in 2025, especially if Bitcoin remains above its current support levels.
SEI bulls eye $0.5 breakout
SEI has also emerged as a strong gainer in the current cycle.
After dipping below $0.14 earlier this year, the token has reversed its downtrend and is forming a pattern of higher highs and higher lows.
More notably, it has broken through the bearish Gaussian Channel on the chart—a move typically interpreted as the beginning of a longer-term uptrend.
Volume indicators, particularly the Chaikin Money Flow (CMF), show a clear uptick in capital inflows into SEI.
The CMF has moved above zero for the first time in weeks, signalling increased investor interest.
With resistance levels at $0.32, $0.40, and $0.44 coming into view, SEI appears poised for further gains.

Source: CoinMarketCap
A move past the $0.48–$0.50 zone, which marks a significant resistance area, could trigger a fresh leg up.
If momentum sustains and market conditions remain favourable, SEI may well be on track to approach the $1 mark by mid-2025.
This would represent a more than 7x gain from its previous lows, making it one of the standout performers of the cycle.
Technical indicators support further gains
Both tokens are showing confluence across several key indicators. SUI’s RSI remains in neutral territory, leaving room for more upside.
SEI, on the other hand, has just crossed into bullish territory, suggesting its rally may still be in its early phase.
Market watchers are now focusing on the next few days for confirmation of trend continuation.
While external factors such as macroeconomic sentiment, US regulatory decisions, and Bitcoin volatility will continue to influence prices, the charts for SUI and SEI provide a positive technical outlook in the short-to-medium term.