Tag: remains

  • Bitcoin remains under pressure as gold targets a new all-time high

    Bitcoin remains under pressure as gold targets a new all-time high

    Bitcoin remains under pressure as gold targets a new all-time high

    • Bitcoin’s rally attempt fails as it retreats to below 112,000 dollars.
    • Gold continues its quiet but powerful climb, nearing its all-time high.
    • In August, gold is up nearly 4 percent while Bitcoin has fallen over 5 percent.

    A hopeful rally in the cryptocurrency market was decisively crushed on Thursday, as steady selling pressure throughout the US trading session sent prices into a familiar retreat.

    The failed bounce underscores a growing sense of fatigue in the digital asset space and throws a stark and revealing light on the silent, powerful ascent of its analog rival: gold.

    After a brief flirtation with the 113,000 dollar level, Bitcoin (BTC) was beaten back, sinking to 111,800 late in the session for a loss of 0.7 percent over the past 24 hours.

    The selling was even more pronounced in other major tokens, with Ether (ETH) and XRP shedding a more sizable 2.1 percent and 1.4 percent, respectively.

    The one notable bright spot in a sea of red was Solana’s SOL, which managed to buck the trend with a respectable 3.1 percent gain.

    A silent ascent to the summit

    While the crypto market grapples with its own inertia, a different story is unfolding in the world of precious metals.

    Quietly, but with unshakable conviction, gold has been on the rise. The yellow metal added another 0.8 percent on Thursday, climbing to 3,477 dollars per ounce.

    This puts the safe-haven asset just a few dollars shy of the record high of 3,534 dollars it touched earlier this month.

    The performance in August paints an even more dramatic picture of this great divergence: while Bitcoin has slid 5.2 percent, gold has rallied by nearly 4 percent.

    The great disconnect

    This decoupling is the great mystery currently haunting the market.

    The very same macroeconomic tailwinds that are propelling gold higher—namely, the prospect of lower interest rates and a weaker US dollar—are conspicuously failing to ignite any significant bid for “digital gold.”

    The fundamental case for Bitcoin as an inflation hedge and a store of value is being put to a severe test, and for now, it is failing.

    A September showdown looms

    The stage is now set for a potentially volatile final four months of the year.

    The resumption of Federal Reserve rate cuts appears to be firmly on the table for September, a move that could be amplified by President Trump’s appointment of one or possibly two new, likely dovish, members to the Fed’s board.

    As these powerful forces converge, the market is watching to see if Bitcoin can finally catch the golden tailwind or if its strange and troubling disconnect is a sign of a deeper malaise.

    Source link

  • Ethereum price forecast: ETH bull case remains intact despite strategic profit-taking

    Ethereum price forecast: ETH bull case remains intact despite strategic profit-taking

    Ethereum Price

    • Ethereum price is at $3,640 amid some profit-taking deals.
    • Despite some whales selling, institutional interest remains high and demand is absorbing the dump.
    • Analysts say the ETH bull market remains intact.

    Ethereum has retreated slightly from its highs of $3,856 as it dips nearly 4% in the past 24 hours amid some profit-taking moves.

    But while the top altcoin changes hands at $3,640 at the time of writing, analysts maintain Ethereum is on a bullish course and that ETH still has room to explode.

    ETH sees strategic profit taking

    The $4,000 mark remains elusive for Ethereum in 2025, with the highs of $3,856 marking a key peak since the declines from $4,000 in December 2024.

    It means Ethereum price has lagged as Bitcoin climbed to multiple new highs.

    Selling pressure at current levels alludes to likely struggles in the short term, analysts at Glassnode have noted.

    The outlook is down to the Cost Basis Distribution Heatmap of Ethereum, which Glassnode analysts say shows buyers are cashing out gains.

    This strategic profit-taking is calculated towards securing profits after ETH posted strong upward moves these past weeks.

    Sellers have included whales. Lookonchain shared on X that one whale has sold 8,000 ETH for over $30 million.

    Ethereum price forecast: here’s why bull case remains intact

    Despite the profit-taking, Glassnode highlights a fascinating scenario with equilibrium emerging.

    Notably, data shows new demand is steadily absorbing the supply hitting the market, with selling pressure yet to overwhelm buyer interest.

    It’s a resilient market structure for ETH that suggests pullback action is likely to dissipate as bulls take control.

    While some whales sell, others have accumulated. Also, institutional holders like SharpLink Gaming have been aggressive.

    The company has acquired a massive chunk of ETH in recent weeks.

    Helping buyers is overall market sentiment that sees open interest in ETH futures soar to all-time highs. OI currently sits around $58 billion per Coinglass, which indicates interest is elevated.

    Ethereum is also sporting gains amid staking explosion, spot ETF inflows and regulatory developments. The ETH spot ETF inflows for Ethereum reached 588,000 ETH last week – higher than recent peak.

    Traders will eye potential corrections for buy opportunities, with consolidation in the near term allowing for a retest of key supply zone areas.

    On the flipside, sellers may be encouraged by weakening on-balance volume and extended cashing out.

    The $3,500 remains important and robust support may be around $3,000.

    Yet, the RSI on the daily chart is not overextended as it hovers just below the overbought territory.

    The MACD also still boasts a bullish case scenario. The $4,000 threshold is therefore one to watch.


    Source link

  • XRP price outlook: $2 remains key amid increased volume

    XRP price outlook: $2 remains key amid increased volume

    XRP Price Outlook

    • XRP trades above $2.00 and could eye a decisive break above $2.30.
    • An uptick to $2.50 could confirm bullish continuation.
    • However, a drop below $2.00 may signal deeper corrections.

    The price of XRP is holding near $2 as top cryptocurrencies trade at key support levels.

    Most altcoins mirror Bitcoin’s trajectory, which saw a sharp decline over the weekend, largely attributed to heightened geopolitical tensions stemming from US military strikes on Iran.

    Despite its downturn to lows of $1.94, XRP demonstrates resilience.

    Bitcoin has also bounced above $100k, with bullish sentiment among investors signalling strength despite the volatile broader market.

    XRP price above $2 as volume spikes

    XRP has shown notable strength, rebounding from a weekly low near $1.94 as trading volume surged by over $3 billion in the past 24 hours.

    This spike in volume, coupled with the price holding above the critical $2.00 psychological support level, indicates robust buying interest.

    According to market analysts, increased trading volume during a price recovery often reflects renewed investor confidence and potential for sustained upward momentum.

    The broader cryptocurrency market has faced downward pressure due to US strikes on Iran, which intensified fears of a wider conflict.

    Bitcoin and Ethereum have also corrected, with Bitcoin trading just above $101k.

    Despite this, stock futures indicate investors are shrugging off the weekend’s sell-off, and oil prices have stabilized after a brief spike, suggesting markets are adapting to the geopolitical unrest.

    A crypto market bounce is possible if risk-on sentiment returns, but an escalation in the Middle East could trigger further declines.

    Ripple price prediction

    A bounce for cryptocurrencies comes as data from asset manager CoinShares shows digital asset investment products saw a 10th consecutive week of inflows for the week ending June 20.

    As per details shared on June 23, the crypto sector attracted $1.24 billion in exchange-traded funds last week, with Bitcoin leading with $1.1 billion for a second straight week of inflows.

    Meanwhile, Ethereum hit a 9th consecutive week of inflows with $124 million. Solana attracted $2.78 million and XRP $2.69 million.

    Analysts are cautiously optimistic about XRP’s future. Short-term forecasts suggest a potential breakout above $2.50 could push prices toward $3.00.

    XRP chart by TradingView

    The bounce to $2.00 suggests that bulls are defending this key level, positioning XRP for a possible short-term rally.

    Despite the RSI and MACD on the weekly chart, long-term projections are more ambitious.

    A break above the 20-week exponential moving average (EMA) will reinforce this outlook.

    Notable predictions for XRP include a potential rocket past $10, driven by increased institutional adoption and regulatory clarity.

    However, failure to hold above $2.00 could see prices retest April’s low of $1.60.

    Source link

  • MicroStrategy rebrands to Strategy, remains focused on Bitcoin

    MicroStrategy rebrands to Strategy, remains focused on Bitcoin

    • Strategy unveils a new Bitcoin logo and orange color scheme representing its Bitcoin strategy
    • Saylor is expected to discuss the rebrand during the company’s earnings call on Wednesday evening
    • Strategy currently has 471,107 Bitcoin in reserve worth $45.8 billion

    MicroStrategy, the largest corporate Bitcoin holder, has announced it’s rebranded to Strategy and unveiled a new Bitcoin logo.

    In a post on X, Michael Saylor, co-founder of Strategy, simply said: “new brand, same strategy,” with an image of him in front of the company’s new logo.

    In an announcement released on February 5, Strategy said the rebrand was a “natural evolution of the company, reflecting its focus and broad appeal.” The stylized “B” in the new logo represents Strategy’s Bitcoin strategy while the orange color highlights “energy, intelligence, and Bitcoin,” according to the press release.

    Strategy’s stock ticket, MSTB, remains the same.

    The rebrand comes ahead of the company’s earnings call on Wednesday evening, during which Saylor is expected to discuss it.

    Bitcoin buying strategy

    Since 2020, Strategy has employed a Bitcoin buying strategy; however, over the past year, it has ramped up its efforts. In November, Saylor announced that the company was raising $21 billion from a stock sale so it could buy more Bitcoin.

    According to data from SaylorTracker, the company currently has 471,107 Bitcoin worth $45.8 billion.

    Claiming that Bitcoin represents digital capital, Saylor urged Microsoft to adopt Bitcoin, stating that “Bitcoin represents the greatest digital transformation of the 21st century.”

    Other companies following in Strategy’s Bitcoin buying footsteps include Metaplanet, which is aiming to increase its Bitcoin holdings to 10,000 in 2025.


    Source link

  • Bitcoin found support at $25k (again). YTD performance remains impressive.

    Bitcoin found support at $25k (again). YTD performance remains impressive.

    • Bitcoin found support at $25k (again)
    • YTD performance remains impressive
    • A dovish Fed may trigger even more strength

    Cryptocurrency investors may have been disappointed by the lack of volatility during the summer months—after all, Bitcoin, the leading cryptocurrency, only consolidated levels. 

    But one should keep in mind that Bitcoin rallied strongly in 2023. It returned over 61% in the trading year, and the bias remains bullish. 

    The bullish perspective is even more obvious if one looks at the yearly returns of Bitcoin. Since 2010, only in three years did Bitcoin deliver negative returns. 

    Buying the dip seems to have worked every time, even though the dips were quite scary. 

    Will the Fed’s decision boost Bitcoin?

    Tomorrow, the Federal Reserve of the United States (Fed) is expected to hold the funds rate steady. As always, the details in the FOMC Statement and the press conference will move markets. 

    Higher inflation than the Fed’s target was the main cause of rising interest rates. Now that inflation comes down from its highest levels, the Fed may feel comfortable that it will reach the target in a timely manner. 

    Therefore, a dovish Fed would trigger weakness in the US dollar and strength for Bitcoin. 

    The technical picture also favors more Bitcoin strength. The market bounced twice from $25k and now trades above $27k. A dovish Fed would send Bitcoin back to the $30k resistance area with big chances to move even higher. 

    Source link

  • Bitcoin remains the focus as outflows hit March highs

    Bitcoin remains the focus as outflows hit March highs

    • Digital assets investment products saw outflows of $168 million last week, $146 million of which was for Bitcoin.
    • It’s the largest weekly outflows total since March 2023, according to a report by CoinShares.

    CoinShares’ latest weekly report on digital asset investment flows shows that the market witnessed its largest funds outflows in nearly six months last week. The outflows come as sentiment across cryptocurrency dips amid recent sell-off.

    Crypto sees $168 million in outflows

    According to the report, outflows totaled $168 million over the week to mark the largest outflow from crypto products since March 2023 when the US Securities and Exchange Commission (SEC) started its regulatory crackdown on major exchanges.

    The outflows in the week ended August 25 saw the monthly outflows stand at $278 million as sentiment continued to trend negative amid “exceptionally low trading volume.” Indeed, CoinShares data shows the investment products market traded $1.3 billion last week, about 16% off the year’s average.

    This negative sentiment we believe is due to the increasing acceptance that a spot-based ETF for Bitcoin in the US is likely to take longer than many expect, with recent delays being announced by the SEC,” said James Butterfill, head of research at CoinShares.

    Bitcoin continues to lead

    The crypto market recently witnessed a sharp sell-off for Bitcoin, the benchmark cryptocurrency falling to lows of $25,350. The struggle to strengthen above $26k has illustrated the market jitters permeating the broader risk assets sector, with this shown in outflows from Bitcoin investment products.

    Bitcoin price chart

    However, while outflows totaled $149 million last week, the flagship crypto asset’s flows are net positive for the year at roughly $265 million. Meanwhile, investors are increasingly selling their short positions, with $4 million in outflows registered last week for an 18-week streak of outflows. 

    Data shows shorts outflows are currently 89% of the total AuM.

    In the altcoin market, Ethereum recorded outflows of $17 million, while XRP and Litecoin had minor inflows of $0.5 million and $0.44 million, respectively.


    Source link

  • Bitcoin correlation with gold drops, highlighting risk-on nature remains

    Bitcoin correlation with gold drops, highlighting risk-on nature remains

    Key Takeaways

    • Bitcoin’s correlation with gold is currently at its lowest level since FTX collapsed in November
    • Our Head of Research writes that while one day Bitcoin may become a store of value, the numbers say it currently trades like an extreme risk-on asset
    • Bitcoin lost 76% of its value amid the pullback in risk assets once central banks around the world transitioned to tight monetary policy amid the inflation crisis
    • Meanwhile, gold traded flat and is currently close to all-time highs
    • Bitcoin’s correlation with growth stocks and riskier sectors of the stock market remains tight

    One of the ultimate bull scenarios for Bitcoin is that it morphs into some kind of digital gold. 

    For whatever reason, humans have been obsessed with this weird, shiny metal for thousands of years. Stories date back even further, but we have concrete evidence that gold was an important symbol of wealth in Ancient Egypt in 3000 BC, as well as part of everyday life and mythology. 

    Bitcoin, on the other hand, was not around in Ancient Egypt. Nor was it around for the Middle Ages, the Great Depression in the early 20th century, a World War (yet?), the inflation and energy crisis of the 1970s, and it even missed most of the subprime mortgage crisis of 2008. 

    In fact, Bitcoin was launched in January 2009, the Genesis blocked mined only two months before the stock market bottomed. Over the next twelve years, not only did the stock market recover, but it went absolutely bananas. Between the 2009 trough and the peak at the end of 2021, the S&P 500 multiplied 7X while the Nasdaq jumped nearly 13X. In other words, Bitcoin was launched into one of the most explosive and longest bull markets in history. Until 2022, it had never known anything but basement-level interest rates and up-only markets. 

    Gold’s hedge properties are what Bitcoin seeks

    Once 2022 came, risk assets sold off. The Nasdaq shed a third of its value; the S&P 500 fell 20%. Bitcoin had dipped plenty before, but make no mistake: this was the first time it was staring a bear market in the wider economy in the face.

     Despite certain enthusiasts claiming Bitcoin would act as a hedge asset, this did not happen. By the end of 2022, Bitcoin was 76% off its high. In the most explosive inflationary environment since the 1970s and Bitcoin’s first bear market, the asset was getting crushed. There was no debate: Bitcoin was trading like a risk-on asset. And today, it still is.  

    That is not to say that the narrative could flip in the future. Personally, that is what I view as Bitcoin’s upside: a store of value akin to gold. But while we can debate whether that may one day happen, it is unequivocal that Bitcoin currently trades like a risk-on asset. These are the facts of the case, and these are undisputed, to borrow Kevin Bacon’s phrase from the absolute classic that is A Few Good Men. 

    Gold, on the other hand, traded flat during 2022, and is currently trading close to all-time highs. 

    Bitcoin and gold correlation dipping

    For all the reasons discussed above, the correlation between gold and Bitcoin is particularly interesting to track. Using the 60-Day Pearson indicator, I have plotted it on the below chart. 

    Immediately, the past month jumps out. The correlation was a near-perfect 0.86 at the start of June, and had been around this level since late April. And then, it fell. It currently sits at 0.16, the lowest mark since FTX collapsed in November, sending the crypto market into a tailspin. But why?

    Well, I don’t really know. And that is kind of the point. Bitcoin, as it tends to do sometimes, is rising at the moment. Most likely, this is due to news of asset managers Blackrock and Fidelity filing ETFs, but maybe it’s just Bitcoin doing its thing. Perhaps it is merely bouncing back from the sharp fall it took after the Binance and Coinbase lawsuits were announced back-to-back two weeks ago. 

    But if we stretch out the time horizon on the previous graph, we see that the correlation between gold and Bitcoin bounces around a lot.

    It is challenging to put any pattern on that, to say the least. I thought I might try a different metric, so in the next graph I have used 90-Day Pearson instead of 60-Day. Predictably, the trend is less volatile, but there still appears to be no meaningful relationship here. 

    I think it’s pretty clear that assessing the correlation coefficients directly proves that there is zero positive relationship between these two assets. 

    Federal Reserve holds the key

    In truth, I believe this actually says more about gold than Bitcoin. Gold is in a funny place at the moment, trading more off expectations of inflation and interest rate movements rather than current conditions. The correlation between gold and the stock market is therefore higher than what we have typically seen in the past. This is why we are seeing gold often advance when soft CPI numbers are announced, or when dovish Fed comments surface regarding interest rate policy.

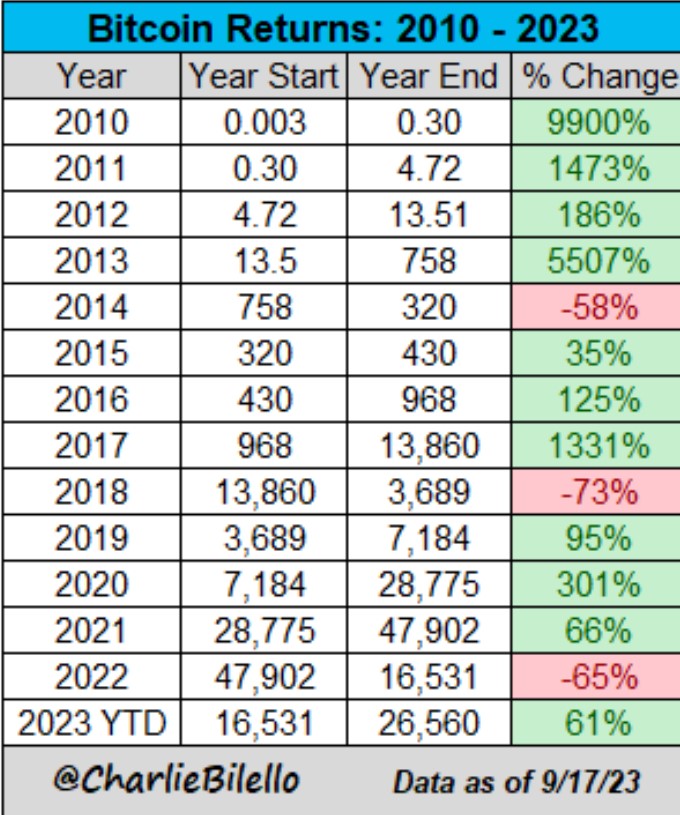
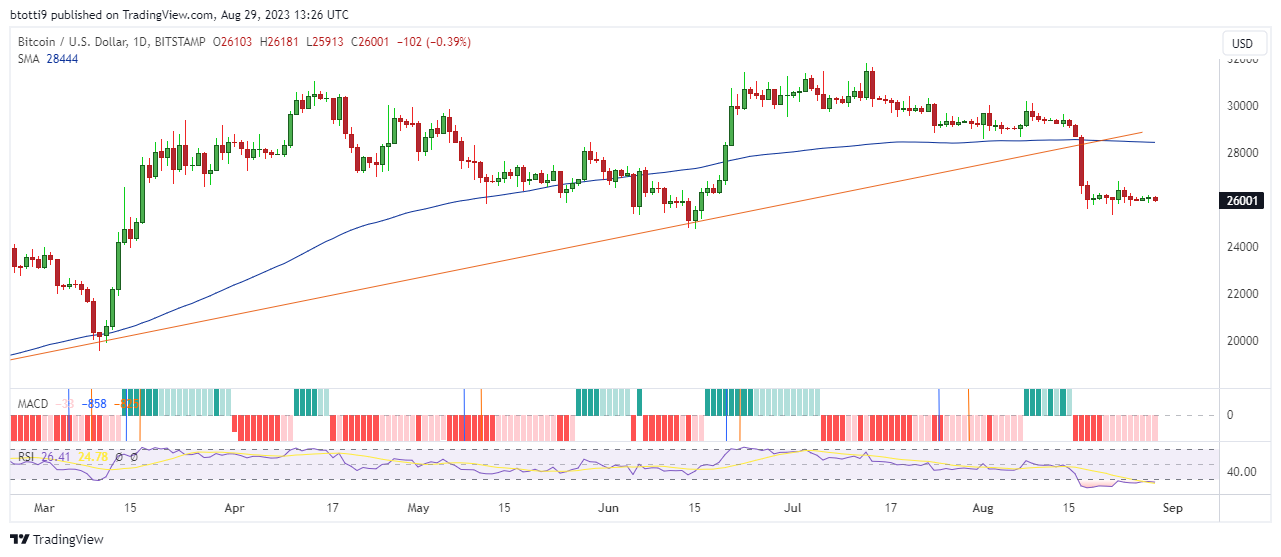
    If we step back and look at the big picture, it really is not complicated. Bitcoin has gone from $68,00 in November 2021, when money was cheap and risk assets were trading at outrageous valuations, to $15,500 last November, seven months into the swiftest hiking cycle in recent memory and the worst inflation crisis in 50 years. Then, it doubled to $30,000 as inflation numbers fell away and expectations around the length of the hiking cycle softened. 

    Along with all the fakeouts and reverberation in between, that is a hell of a lot of movement and clearly trading like an extreme-risk asset. Meanwhile, gold has been far less volatile, relatively range-bound between $1,600 and $2,000 for three years now. 

    Again, while Bitcoin may one day seize the crown of an uncorrelated asset, or a portfolio hedge to inflation, that is clearly not the case today. The below chart is the simplest method of all to show this, plotting Bitcoin’s hand-in-hand relationship with the tech-heavy Nasdaq composite since the economy transitioned to this risk-off, tight monetary policy period. 

    A few months ago, Bitcoin rose during the banking crisis, sparking some to declare it as decoupling from risk assets and the fiat world. As I wrote back then, this is nothing more than wishful thinking. Rather, it moved off expectations that the Fed would not be able to hike as aggressively in future if banks were going under due to the strain of these higher rates (indeed, soon after, the correlation rose back up).

    The latest dip in correlation with gold, falling back down from the ultra-high 0.86ish value it has been for six weeks or so, is similar. There is nothing ambiguous about the situation at the moment – Bitcoin is trading like a risk-on asset. It may one day claim that coveted title of digital gold, but right now it is nowhere near.

    Source link

  • Crypto markets rallying but damage remains severe

    Crypto markets rallying but damage remains severe

    Key Takeaways

    • Bitcoin is up close to 50% from its lows, but is still down over two-thirds from all-time highs
    • Some on-chain metrics show how much the rally pales in comparison to the prior fall 
    • Positive news from the industry remains few and far between, as market prepares for latest interest rate policy, to be revealed at FOMC meeting Wednesday

    Let us start with a riddle. How much profit/loss have you made if an asset you own rises by 47%, having previously fallen by 77%?

    The answer is a gruesome 67% loss. 

    That is the predicament facing Bitcoin investors who bought at all-time highs in late 2021. While markets have kicked off the year in scintillating fashion, it is important not to lose perspective. 

    Humans have short memories, though. With Bitcoin up nearly 50% from the lows post-FTX collapse, crypto markets have that giddy feel about them again. It’s amazing what hope can do for people, huh? And by hope, I mean hope that interest rates will come down again.

    Federal Reserve controls the Bitcoin price

    I wrote a piece last week about how this latest rally, if it shows anything, simply proves once and for all how much Bitcoin is trading as an extreme risk-on asset. 

    Bitcoin was crushed last year as central banks worldwide flipped hawkish for the first time in Bitcoin’s existence. With the cheap money of the last decade no longer available, and stout yields available on other investments such as T-bills, high-risk assets collapsed. 

    The tech sector, also notoriously sensitive to interest rates, has been sacking employees left, right and centre – Meta, Salesforce, Twitter, Google, and the list goes on. 

    This latest rally now comes as inflation begins to cool, with hope renewed that the pain of suffocating monetary policy will, in fact, one day come to an end. 

    Market remains ravaged

    While the picture undoubtedly looks rosier than this time two months ago, the crypto market is still in a world of pain. 

    Bankruptcies are still flowing – see Genesis filing last week – while there are numerous other potential downside catalysts as the market still delves through Sam Bankman-Fried’s chaotic mess: DCG still present a lot of uncertainty, for example.

    While prices have been running, there is no particularly good news to explain this rally. As I said, it’s all macro, with investors staring squarely at the Federal Reserve. 

    A couple of charts paint a good picture of the pain still present in markets. Despite the recent upturn, the net realised profit marker, which is an on-chain metric calculated by comparing the price of recent coins moved to the price at which they previously moved, shows how much the recent rally pales in comparison to the scale of the fall last year. 

    In truth, there is no need to complicate things. Despite the bluster of “hedge” narratives and “uncorrelated investment” that floated around through COVID, it is as clear as night and day that Bitcoin is trading off interest rate expectations right now. 

    The below chart is perhaps the most important one in all of crypto over the last couple of years. 

    That little bounce at the end could reverse very quickly depending on how things shake out at the upcoming Fed meeting. It could also do the opposite if things end up being more hawkish than the market has currently priced in. 

    Either way, it is clear what is moving markets right now.

    Source link

  • Bitcoin remains close to $17k after FOMC minutes release: Will BTC rally soon?

    Bitcoin remains close to $17k after FOMC minutes release: Will BTC rally soon?

    • Bitcoin price steadied above $16,800 as US Federal Reserve officials agreed to slow its pace of interest rate hikes.

    • The latest FOMC minutes indicate that US policymakers are focused on controlling the pace of price hikes.

    • Bitcoin could surge past the $17k resistance level soon.

    BTC eyes the $17k resistance level

    The United States Federal Reserve recently released minutes from the Federal Open Market Committee for December. Fed members agreed that a restrictive policy stance would need to be maintained for now until the incoming data provided confidence that core inflation was on a sustained downward path back down to 2%.

    This latest cryptocurrency news saw Bitcoin, the world’s leading cryptocurrency by market cap, maintain its price above the $16,800 level over the last 24 hours. It has lost less than 1% of its value, and the price of Bitcoin now stands at $16,834. 

    The broader crypto market is also recovering from its recent slump. At press time, the total cryptocurrency market cap stands at $819 billion, up by less than 1% in the last 24 hours.

    Key levels to watch

    The BTC/USD 4-hour chart is bullish as Bitcoin has held its ground above the 50-day Exponential Moving Average (EMA) at $16,714 over the last few days. 

    The MACD line is above the neutral zone, indicating that the leading cryptocurrency has preserved its downward trend from the standpoint of realised price. The 14-day RSI of 61 also shows that more bulls controlling the market could see BTC enter the overbought region. 

    If the bullish momentum increases, BTC could surge past the first major resistance level at $17,145 over the next few hours. However, Bitcoin could struggle to surpass the second major resistance level at $17,485 in the short term, unless it gains support from the broader crypto market. 

    Where to buy Bitcoin now

    eToro

    eToro offers a wide range of cryptos, such as Bitcoin, XRP and others, alongside crypto/fiat and crypto/crypto pairs. eToro users can connect with, learn from, and copy or get copied by other users.


    Buy BTC with eToro today

    Bitstamp

    Bitstamp is a leading cryptocurrency exchange which offers trading in fiat currencies or popular cryptocurrencies.

    Bitstamp is a fully regulated company which offers users an intuitive interface, a high degree of security for your digital assets, excellent customer support and multiple withdrawal methods.


    Buy BTC with Bitstamp today

    Source link