Tag: spike

  • Succinct (PROVE) price eyes $1.74 peak amid volume spike

    Succinct (PROVE) price eyes $1.74 peak amid volume spike

    Succinct Token PROVE

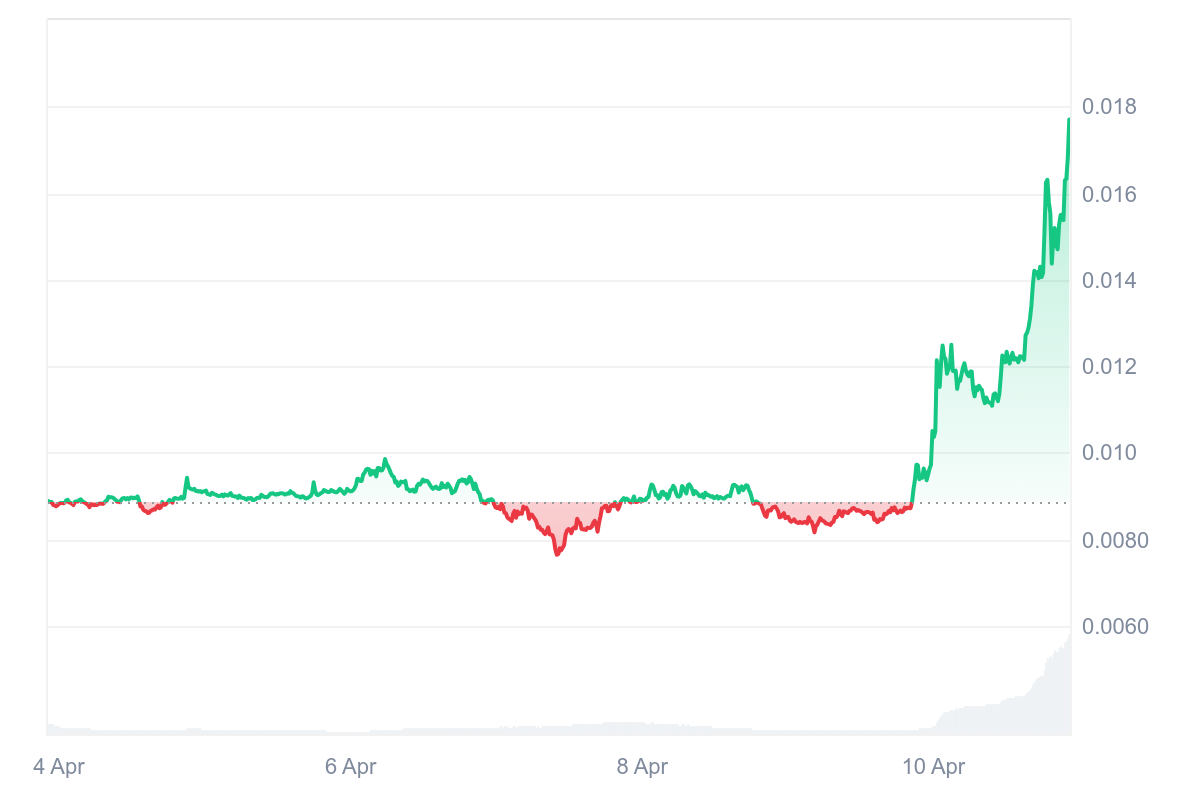
    • Succinct price jumped 20% amid a 228% spike in daily volume.
    • PROVE outpaced most altcoins in the top 100 by market cap as bulls looked to break above $1.
    • The altcoin traded higher amid a zero-knowledge proofs milestone on Arbitrum.

    Succinct (PROVE) trends among cryptocurrency outperformers in the past 24 hours, with double-digit gains pushing the verifiable computation protocol’s native token to above $1.00.

    As Ethereum’s Layer 2 ecosystems push boundaries in scalability and security, PROVE’s latest momentum aligns with fresh investor confidence.

    Particularly, Succinct’s zero-knowledge proofs milestone on Arbitrum has coincided with the price surge.

    The PROVE token mirrors gains for SynFutures, Aster and World Liberty Financial. Ethereum is also up amid CPI anticipation.

    Succinct price tests $1 amid a 200% volume spike

    The Succinct token (PROVE) rose sharply on Friday to test the psychologically significant $1.00 threshold.

    Gains came as trading activity exploded, with PROVE climbing more than 20% from recent lows of $0.79 to highs of $1.02.

    The uptick positioned Succinct as a standout performer in the altcoin space, outpacing Ethereum and other top altcoins.

    Significantly, the upward pressure for the altcoin comes on the heels of a dramatic 228% spike in trading volume.

    Market data from CoinMarketCap indicated Succinct’s volume exceeded $146 million as PROVE hovered above $0.98 amid a slight retreat. 

    However, PROVE price has jumped by more than 137% since touching lows of $0.41 on October 11, 2025.

    Bulls could eye strengthening above $1 in the coming weeks, with the target on a new all-time high. 

    As PROVE hovers near $1, the combination of price appreciation and elevated volume suggests a breakout is likely.

    The token reached its all-time peak of $1.73 in August 2025. Downside action could rely on critical support around $0.75.

    Succinct Chart
    Succinct prove chart by CoinMarketCap

    Succinct hits key milestone

    The crypto market has shown lacklustre action these past few days. However, Succinct has jumped by more than 32% in the past week. 

    Amid this market outlook, Succinct has achieved a landmark advancement in its mission to democratize ZK proofs.

    The protocol recently announced the implementation of zero-knowledge proofs tailored for Arbitrum, Ethereum’s leading optimistic rollup.

    Through its SP1 zero-knowledge virtual machine, Succinct has verified real Arbitrum blocks while maintaining seamless compatibility with the Ethereum Virtual Machine and Stylus smart contracts.

    By enabling ZK proofs across all Arbitrum chains, including those built on the Orbit stack, Succinct unlocks new possibilities for modular DeFi, cross-chain bridges, and privacy-enhanced applications.

    For the Succinct ecosystem, it solidifies PROVE’s utility as the economic backbone for proof generation, staking, and governance. 

    In August, while disclosing a strategic partnership with Tandem, the Succinct team said the integration with Arbitrum could be key to PROVE revenue. 

    “Since Arbitrum chains account for ~50% of L2 TVS, our rollup market just doubled. If the SPN can monetize a fraction of that value, it will unlock hundreds of millions in revenue for our ecosystem,” they posted on X.

    While volatility remains inherent in crypto markets, the milestone and other developments affirm the Succinct’s edge against industry peers.

    Traders will watch the market closely for signals of upward momentum.

    Source link

  • Synthetix price soars 20% amid volume spike: here’s why

    Synthetix price soars 20% amid volume spike: here’s why

    • Synthetix’s native token SNX spiked more than 20% in 24 hours to hit $0.79.
    • Daily volume rocketed 700% to over $147 million, with Synthetix benefiting from a broader crypto bounce.
    • The Synthetix network’s move to launch its perps DEX on the Ethereum mainnet has helped SNX price.

    Synthetix (SNX), a decentralized futures protocol with trading support on Ethereum, has seen its price surge by 20% within the last 24 hours as Bitcoin leads a minor bounce for the crypto market.

    The SNX token, which has climbed alongside notable gains for Ethereum, Solana and XRP, hit intraday highs of $0.79.

    Price gains for the altcoin happened alongside a significant jump in daily volume, with bulls attempting to break above a level that has previously constrained upside momentum around $0.80.

    Synthetix (SNX) pops 20% in 24 hours – here’s why

    The crypto market, still reeling from recent losses, is showing early signs of recovery as buyers attempt to regain control.

    Bitcoin has reclaimed the $110,000 mark after a sharp dip, while Ethereum has climbed back above $4,560, holding steady despite broader risk asset pressure.

    Solana has broken past $204, and XRP is eyeing the $3.70 level, both reflecting improved sentiment.

    Within this backdrop, Synthetix has surged 20%, standing out as one of the stronger performers.

    The rally comes as decentralised finance tokens show renewed strength, aided by Synthetix’s recent launch of the first perpetual exchange on the Ethereum mainnet—a development seen as a key catalyst for the token’s momentum over the past week.

    In the period, SNX price has jumped by double digits, helped by the rollout of pre-deposits and a chance for traders to get on the Synthetix mainnet alpha whitelist.

    The launch of SLP vault, a liquidity pool offering access to liquidity across all perp markets and an opportunity to rank among the first to earn SNX points, has driven a lot of the market activity for Synthetix.

    Network support for gasless trading is also a huge move for the perps DEX.

    SNX price forecast

    While SNX price hovers at $0.79 and eyes gains towards $1, the altcoin remains well off its all-time peak of $28.53 reached in 2021.

    Synthetix has also struggled since rejecting the December 2024 peak of $3.40.

    Despite this largely negative trend, analysts are seeing a short-term bullish flip for Synthetix’s price.

    If SNX successfully takes out the resistance at $0.80 and $0.85, bulls could eye the $1 mark.

    Synthetix chart by TradingView

    Technical indicators on the daily chart support this outlook. The Relative Strength Index (RSI) is at 57, signalling potential for continuation.

    Meanwhile, the Moving Average Convergence Divergence (MACD) is signalling a strengthening of upward momentum after a bullish crossover.

    However, volatility remains a concern, and the $0.60 zone could offer support if bears pick up the advantage.

    Traders taking profit or whale activity taking hold will be a key watch in the coming days for Synthetix, particularly after its 20% surge.


    Source link

  • OKB price hits new all-time high amid a 50% spike

    OKB price hits new all-time high amid a 50% spike

    OKB Price Skyrockets To New All Time High

    • OKB price rose 50% to hit a new all-time high of $195.
    • The altcoin is outpacing peers as investors react to tokenomics changes.
    • OKB is seeing traction as altcoins bid to break higher.

    OKB, the native token of the OKX exchange, has soared to a new all-time high of $195, with intraday gains of over 50% catapulting the altcoin to the new ATH.

    OKB’s price surge has also come amid a significant spike in daily volume, with market data showing the OKX token witnessed a staggering 428% uptick in 24-hour trading volume.

    At the time of writing, the metric hovered around $1.17 billion.

    Meanwhile, OKB is one of the standout performers in the past 24 hours and week, outpacing top altcoins as recent bullish catalysts keep bulls in control.

    BNB also hit a new peak as exchange tokens rally.

    Why OKB surged 50% as it hit a new all-time high

    As top altcoins braced for a fresh dose of downside volatility, OKB extended its recent rally to a new ATH.

    Having gone vertical from lows of $46 to highs of $116 on Aug. 13, the token retested the $92 area.

    But bulls have traded higher since, breaking above $150 and hitting the intraday record high of $195 on Aug. 21.

    OKB chart by CoinMarketCap

    The buying pressure follows a strategic tokenomics overhaul that OKX undertook recently, with this significantly altering the OKB’s supply dynamics.

    On Aug. 13, OKX executed a massive one-time burn of 65.26 million OKB tokens, slashing the circulating supply by over 50% to a fixed cap of 21 million tokens.

    The move meant OKX aligned its token’s supply with Bitcoin’s hard cap, with the deflationary event a key catalyst to the parabolic price action.

    The supply change has seen OKB’s market cap surge to $4 billion, while the price has increased nearly 90% in the past week and over 290% in the past 30 days.

    As well as the token burn, OKX introduced an upgrade to its zero-knowledge Ethereum Virtual Machine (zkEVM) network built with Polygon technology.

    The upgrade boosted the network’s transaction capacity to 5,000 transactions per second while slashing gas fees to near-zero levels, enhancing OKB’s utility as the native gas token.

     OKB price outlook

    OKB’s price trajectory has pushed key technical metrics to extreme levels, with the Relative Strength Index (RSI) hitting overbought conditions.

    Per the daily chart, OKB’s price hovers at a level where the RSI is above 92 and signaling a potential reversal.

    OKX price chart by TradingView

    However, the Moving Average Convergence Divergence (MACD) remains strongly bullish, with the MACD line above the signal line.

    This and the histogram’s outlook suggest sustained buying pressure.

    If bulls weather profit-taking deals, the next target will be a spike above $200 and further price discovery.

    On the downside, support levels include $125 and $92.

    Source link

  • Mantle price outlook as MNT gains momentum with 20% spike

    Mantle price outlook as MNT gains momentum with 20% spike

    Mantle Price Bullish

    • Mantle is up 20% in 24 hours amid overall altcoin rcovery.
    • The MNT token reached highs of $0.91 on Tuesday and could break to $1 and eye the all-time high of $1.51.
    • Ecosystem growth buoys overall bullish momentum.

    Mantle (MNT) price has surged more than 20% in the past 24 hours, jumping from lows of $0.72 to $0.91.

    This uptick aligns with other altcoins’ bounces over the past day, with likes of Litecoin and Pump.fun among top gainers in the largest 100 coins by market cap.

    Notable gains for Mantle have come amid a 280% surge in daily volume to $622 million, while its market cap has increased to $2.96 billion.

    Mantle pumps 20% as altcoins bounce

    As noted, Mantle’s price surge coincides with a pump in the broader altcoin market.

    A lot of the upside momentum has come after last week’s sell-off, with an announcement from the Commodity Futures Trading Commission buoying investors.

    MNT price has also benefited from a robust network, which boasts a significant increase in stablecoin market cap to $653 million.

    The total value locked in DeFi on the protocol has also jumped to $233 million, largely helped in recent weeks by a surge in activity around its ecosystem.

    Also worth noting is Mantle’s contribution of 101,867 ETH worth over $388 million to the Strategic ETH Reserve.

    Institutional inflows through initiatives like the Mantle Index Four and innovative products such as mETH Protocol for liquid staking add further upside fuel. Lookonchain highlights these in the X post below.

    Mantle’s strong market momentum has MNT trading towards the psychological $1 mark. The last time bulls hovered at or above this level was in February 2025.

    Is Mantle price poised for a breakout to a new all-time high?

    Mantle’s price trajectory has bulls eyeing fresh bids above $1, and analysts say a breakout above this level could catapult MNT past its all-time high of $1.51. The altcoin reached this milestone on April 8, 2024.

    On the daily chart, technical indicators provide bullish signals. The Relative Strength Index (RSI) stands at 66 and upsloping to indicate potential upside continuation before hitting the overbought zone.

    Mantle price chart by TradingView

    Meanwhile, the Moving Average Convergence Divergence (MACD) indicator suggests a bullish crossover. Per the chart above, the MACD line is looking to cut above the signal line, highlighting a potential short-term bullish momentum.

    Mantle is also trading near the upper Bollinger Band at $0.87 with price above the middle line and with likely support at the lower band of $0.68.

    A decisive break above the upper resistance could signal a bullish flip, allowing buyers to extend gains past $1 to the $1.40 region.

    A confirmation of an upbeat sentiment from other catalysts will help this bullish trend. The downside however could make $0.68 a key level to watch. Major support also lies near $0.55.


    Source link

  • Memecoin (MEME) jumps 29% amid significant volume spike

    Memecoin (MEME) jumps 29% amid significant volume spike

    • Memecoin price rose 29% in 24 hours to hit highs above $0.0023.
    • Daily volume spiked 600% as MEME jumped amid a technical breakout.
    • Altcoins are bullish and an anlyst says MEME price could surge 690%.

    Memecoin (MEME), a meme token of the Memeland platform, has surged by 29% in the past 24 hours.

    This sudden price surge, which has come amid a notable spike in trading volume, has MEME trading at levels that might see bulls take further control.

    While profit taking remains a potential setback, bullish momentum is largely in place as the broader cryptocurrency market gets a boost from institutional demand and regulatory support.

    Memecoin’s surge is also not isolated in the meme token ecosystem.

    Pepecoin, DOGS and Pump.fun are among those seeing a significant upside amid a backdrop of bullish projects for altcoins.

    Dogecoin, Shiba Inu and TRUMP have also signaled resilience.

    Volume spikes as MEME token surges 29%?

    MEME’s price jump follows a technical breakout and overall flip in memecoins.

    With a 29% spike in 24 hours, this token’s value is back at $0.0023 levels seen in May.

    The gains also mean the price has increased 75% from lows of $0.0012 seen in June.

    Daily volume has also jumped 600% to over $170 million, notable activity as the token benefits from speculative buying on launchpad sentiment.

    In recent months, tokens such as PUMP and RAY have exploded on launchpad anticipation and adoption.

    Memecoin price rose amid a technical breakout

    However, the MEME price remains well over 95% down since reaching its all-time highs of $0.081 in November 2023.

    What’s next for Memecoin price?

    Crypto analysts point to Memecoin’s uptick amid a breakout from a large falling wedge pattern.

    In the market, a falling wedge breakout is a technical formation that usually suggests a reversal from a downtrend.

    The token is showing a regular bull divergence, to signal bullish strength.

    According to analyst Javon Marks, MEME could be poised for a significant upward movement.

    The forecast aligns with the analyst’s earlier predictions from July 12, 2025, when Marks identified a falling wedge breakout.

    “MEME (Memecoin) is currently showing MAJOR STRENGTH and with prices still being broken out of a large Falling Wedge as well as coming off of a huge Regular Bull Divergence, there can be significantly more bullish action coming!,” noted crypto analyst Javon Marks.

    According to the analyst, MEME prices are likely to skyrocket if bulls take control.

    The memecoin’s price could target $0.018, a level that would represent a staggering 690% upside.

    Conversely, a failure to maintain momentum might see prices retreat, testing lower support levels. Likely, these will be at $0.0016 and $0.0014.

    Source link

  • Why did Conflux price spike 38% today?

    Why did Conflux price spike 38% today?

    Conflux Price Surge

    • Conflux price rose 38% amid multiple key integrations.
    • Bulls could push CFX price to $0.50 and target $1 in the short term.
    • Most cryptocurrencies are trading at key support levels, with Conflux set to ride on overall bullish sentiment.

    Conflux (CFX) price rose 38% in 24 hours to hit highs of $0.27 and lead top gainers in early trading on July 29.

    The gains came amid several strategic integrations and partnerships for Conflux, with daily volume also rising as CFX jumped to prices last seen in mid-April.

    A technical outlook suggests a retest of the $0.50 level is possible as Conflux continues to attract attention as a decentralised finance and artificial intelligence ecosystem.

    Conflux price: CFX gains amid major network integrations

    Conflux Network’s native token has benefited from fresh upside momentum as the ecosystem sees a series of high-profile collaborations.

    Both in DeFi and AI, these integrations are set to enhance the utility and market appeal of CFX.

    Among the pivotal developments is the partnership with OrcaMind.AI, which brings AI-driven payment solutions to the Conflux Network.

    Set to amplify upside momentum is the announcement that Conflux Network has joined forces with Fufuture, a decentralised perpetuals platform, a move set to integrate advanced trading capabilities and expand CFX adoption.

    These efforts add to recent momentum fueled by Conflux’s partnership with AnchorX and Eastcompeace Technology to unveil an offshore yuan-pegged stablecoin.

    “We have joined forces with AnchorX and Eastcompeace Technology for offshore RMB stablecoin (AxCNH) projects, cross-border settlement, and RWA initiatives across Belt and Road countries,” Conflux posted on X.

    Also crucial is Conflux’s mainnet upgrade, with transactions boost adding to scalability as the network looks to expand its footprint across real-world assets tokenisation and cross-border payments.

    Support in China is a major factor for CFX.

    CFX price outlook

    Bullish sentiment has indeed catalysed a 34% uptick this past week and over 250% in the past month.

    However, Conflux price remains well off the all-time high of $1.70 reached in 2021.

    Conflux price chart by CoinMarketCap

    What’s next for CFX is therefore a key sentiment factor for analysts and investors, who might look at the 24-hour spike of 38% and 250% in 30 days as a pointer to where prices might go next.

    The integrations and partnerships could drive more gains, albeit with market volatility and the overall crypto outlook a significant consideration.

    But should the network continue to leverage AI integration and cross-chain capabilities, a bounce in altcoins will solidify CFX’s upward potential.

    A breakout to $0.50 in the short term will allow bulls to target $1 and higher. Meanwhile, a downward flip may bring $0.20 and 0.15 into play as support levels.


    Source link

  • SUI price: bulls eye all-time high amid spike above $4

    SUI price: bulls eye all-time high amid spike above $4

    Sui Price

    • Sui’s price is above $4.20 after surging more than 56% over the past month. 
    • The token’s rally has pushed the total value locked to all-time highs amid a surge in open interest.
    • Bulls could target the SUI all-time high of $5.35 reached in January 2025.

    Sui (SUI) has broken above $4.20 amid a notable 56% surge over the past month.

    This rally brings SUI tantalizingly close to its all-time high of $5.35, recorded in January 2025.

    It also means an impressive rally from April lows of $1.90, putting the token alongside top performers PancakeSwap, BNB and Optimism.

    Sui price jumps above $4 as TVL, open interest surge

    While Sui isn’t the standout performer in the past day or week, the token has gained over 56% in the past month.

    This has allowed it to break above $4.20 and see bulls come within reach of all-time highs witnessed in January 2025.

    Sui is also significantly up since lows of $1.9 in April 2025, with the cryptocurrency showing remarkable recovery since plummeting amid the Cetus protocol hack.

    Bulls’ dominance as top altcoins rally means Sui has experienced a notable spike in its total value locked (TVL).

    According to DeFiLlama, the project’s TVL has surpassed $3 billion, including staking, borrowings and vesting tokens.

    Key protocols like Suilend, NAVI and Bluefin have witnessed a spike in their respective TVLs to boost Sui’s.

    As well as DeFi activity, Sui is recording notable upside in the futures market.

    Per data by Coinglass, open interest in SUI has surged 10% to $2.7 billion, with strong speculative interest showing in the $7.4 billion in derivatives volume.

    Long positions dominate, suggesting overall bullish sentiment. As TVL rises and open interest grows, Sui’s market outlook becomes increasingly bullish.

    If market conditions support an upward flip, it could be a new ATH for Sui within the short term.

    Token unlocks are nonetheless a factor to watch.

    SUI price prediction

    Looking at the technical picture, SUI’s price trajectory appears upbeat.

    Technical indicators, such as the Relative Strength Index (RSI), support the bullish outlook.

    RSI currently sits at 65, having retreated from overbought territory, which means there’s room for further gains without SUI flipping immediately overheating.

    SUI chart by TradingView

    Meanwhile, the Moving Average Convergence Divergence (MACD) shows a bullish crossover.

    The MACD line is above the signal line to suggest bulls have an upper hand.

    Despite an upcoming cliff unlock, analysts predict SUI price could soon retest its all-time high of $5.35.

    Price discovery could push the token’s value even higher. However, the token unlock and short-term profit taking may derail bulls.

    SUI currently trades around $4.21, about 6% up in the past week.


    Source link

  • Injective price jumps as bulls extend gains amid Bitcoin spike

    Injective price jumps as bulls extend gains amid Bitcoin spike

    Injective Bulls Take On Bears

    • Injective price is extending gains above the $10 mark.
    • Bitcoin’s rally above $105k and real-world assets tokenization catalysts could drive the INJ price higher.
    • INJ technical outlook is largely bullish.

    Injective (INJ) is among the top-performing altcoins on Monday as bullish sentiment sweeps through the cryptocurrency market.

    The token is trading above $13.60, lifted by renewed investor confidence following Bitcoin’s surge past $105,000.

    With macroeconomic optimism and progress on regulatory fronts driving broader market momentum, analysts suggest Bitcoin could challenge new all-time highs in the near term.

    This backdrop is fuelling capital rotation into altcoins, with projects like Injective benefiting from increased speculative interest.

    A layer-1 blockchain focused on decentralised finance and real-world asset tokenization, Injective has continued to attract attention as narratives around scalability and use-case-driven growth gain ground.

    Injective price extends gains above $10

    Injective (INJ) price is up 7% in the past 24 hours, gaining as top alts such as Ethereum, BNB, and Solana break to key levels.

    The price of INJ has surged after recently breaking past the $10 mark.

    Currently, it changes hands for around $13.62. However, it hovered at highs of $14.29 on May 12, 2025, to hit its highest level since late February.

    Amid the price gains, Injective’s market cap rose to $1.37 billion, although the 24-hour trading volume remained modest at $172 million.

    Having surged 46% in seven days and 67% in the last 30 days, the overall market interest might see bulls take control.

    Bitcoin rally and RWA tokenization drive INJ price

    While Bitcoin’s rally is fueling further optimism across the market, catalysts for INJ price also include strong institutional demand across its RWA ecosystem.

    Tokenization is a key tailwind for Injective, with a recent Four Pillars report highlighting how this sector is shaping up INJ for traction.

    Recent bull cycles have had DeFi, play-to-earn games, memecoins, and AI tokens explode.

    Now, analysts say while these areas see growth, the RWA market’s growth has blockchains like Injective in the spotlight.

    Injective’s network, optimized for the tokenization of traditional assets like stocks, stablecoins, and commodities, stands as a likely beneficiary.

    Investors eyeing an on-chain opportunity are increasingly seeing it as the go-to platform.

    RWA adoption may further boost INJ’s price momentum.

    Injective price technical outlook

    From a technical perspective, INJ’s daily chart paints a bullish picture.

    INJ chart by TradingView

    The daily Relative Strength Index (RSI) currently hovers in overbought territory.

    However, it’s not overly extended to suggest more room for bulls.

    If it sees a pullback, INJ will likely bounce off support around $11.05 and $10.22.

    This scenario may align with the Moving Average Convergence Divergence (MACD), which shows a bullish crossover.

    The histogram indicates an upward momentum. If this happens, bulls will target $16 and then $20.

    Source link

  • Pepe, dogwifhat see price gains amid altcoin spike

    Pepe, dogwifhat see price gains amid altcoin spike

    Pepe And Dogwifat Memecoins Jumped As Bitcoin Rose

    • PEPE jumped to above $0.0000092, up nearly 13% as volume spiked 46%.
    • Meanwhile, dogwifhat hit highs of $0.64, also up 13% as altcoins mirrored Bitcoin gains.
    • Analysts say President Donald Trump’s announcement of a trade deal with the UK could spark further gains.

    Pepe (PEPE) and dogwifhat (WIF) are among the top gainers in the crypto market today as Bitcoin rides bullish sentiment to near $100k.

    The meme coins, ranked 28th and 98th by market cap on CoinMarketCap, posted double-digit gains as Bitcoin rose 3%, hitting a two-month high alongside a broader rally in risk assets.

    PEPE traded at around $0.000009217, up by 12.59% at the time of writing. Whale activity suggests investor confidence.

    Meanwhile, dogwifhat hovered near $0.64, up 13% in the past 24 hours.

    The gains happened alongside a spike in trading volume, Pepe recording a 46% surge in daily volume to $766 million, while dogwifhat saw an increase of 44% to about $242 million.

    dogwifhat, Pepe surge as crypto reacts to trade deal news

    Bitcoin surged as investors reacted to President Donald Trump’s announcement of a massive trade deal between the United States and the United Kingdom.

    As risk-on sentiment kicked in, equities signaled a rally with futures up. Cryptocurrencies, including the memecoins PEPE and WIF, rose alongside Bitcoin, Ethereum, and Solana.

    EOS and Pudgy Penguins led the top performers.

    With the trade deal likely to be among many others lined up, analysts say an easing of tariff tensions could spark fresh market optimism.

    “President Trump teased a major trade deal this morning, with speculation pointing to the UK. Despite a few details, the headline alone sparked a sharp risk-on reaction across global markets,” QCP Capital analysts noted.

    “Crypto jumped on the news. $BTC rose 2.74% to reclaim $99K, while $ETH surged 6.89%, breaking out of a three-week range. Options flow showed strong demand for May and June calls, signalling renewed bullish sentiment,” they added.

    PEPE and WIF price outlook

    While analysts urge a cautious approach as the US markets open, they see a BTC close above $100k as potentially adding to the upside.

    This scenario could see meme coins soar amid capital rotation into anticipated gainers.

    The surge in volume and open interest (+13% to $454 million for PEPE, and +16% to $244 million for dogwifhat) suggests strong interest in the tokens.

    If this sentiment holds as BTC rallies, buying pressure could see PEPE and WIF rise to key levels.

    WIF price could return to above $1 if bulls edge higher.

    Meanwhile, Pepe may see a zero taken off the price range, with recent hurdles at $0.000015 and $0.000020 key.


    Source link

  • XCN defies Bitcoin and Ethereum slump with 97% spike

    XCN defies Bitcoin and Ethereum slump with 97% spike

    • Onyxcoin (XCN) has risen 97% in the past 24 hours as altcoins enjoy massive buying pressure.
    • The XCN price bucks the trend that saw Bitcoin and Ethereum down after notable gains a day earlier.
    • Tariffs and other market conditions weigh on investor sentiment.

    Onyxcoin (XCN) has defied a dip for Bitcoin, Ethereum, and top altcoins with an impressive 97% over the past 24 hours.

    In a price rally that put it on top of the daily gainers’ list, XCN shot up to an intraday high of $0.017.

    The performance bucks the downward pressure that has seen Bitcoin (BTC) and Ethereum (ETH) pare gains from a day ago with dips below $80k and $1.5k, respectively.

    XCN price performance

    The XCN token’s standout performance sees it outpace Flare, Kaspas, and Walrus, among other notable gainers.

    According to data from CoinMarketCap, XCN is currently trading at $0.017, with its volume up 1,230%.

    XCN chart by CoinMarketCap

    The token’s market, though tiny at $531 million, is up 97% and puts Onyxcoin in the top 100 by market cap.

    XCN has flipped Floki and CORE, which currently rank 100th and 99th by market cap, respectively.

    Onyxcoin’s massive spike comes despite a broader risk market downturn in the past 24 hours.

    BTC, ETH, and other coins’ dip has seen the global cryptocurrency market cap drop by 3.9% to $2.52 trillion.

    Volume is down 20% to about $127 billion as crypto mirrors losses on Wall Street.

    Overall market outlook

    Crypto and the stock market rose sharply on Wednesday after US President Donald Trump changed his tariffs stance.

    His announcement of a 90-day pause sent risk assets skyrocketing, with Bitcoin’s price breaking to above $82k.

    S&P 500 and the Dow Jones Industrial jumped, rising by historic single-day gains.

    However, the S&P 500 and Dow opened lower on Thursday and looked to close lower with 3.2% and 2.4 %, respectively.

    Dow was down more than 900 points.

    On Thursday, Trump announced an additional 25% tariff on China, bringing this to 145%.

    After excluding it from the 90-day pause, analysts say the trade war will continue to hurt optimism.

    This looks to be the case as stocks sold off despite the latest inflation report that showed CPI dropped to 2.4% against an expected 2.6%.

    While this sees many turn to the Federal Reserve for expectations of interest rate cuts, analysts are pointing to “sticky” prices and tariff impact for likely pressure on equities and crypto. Analysts point to a potential bull trap.

    Peter Schiff said via a post on X:

    “I’ve never seen such a mass selloff of US assets. The US dollar, bonds, and stocks are all getting killed. I can’t remember when the dollar lost 3.5% against the Swiss franc in one day. America’s ride on the global gravy train is about to come to a screeching halt. Buckle up.”

    Source link