

- Bitcoin price rose to near $93,000 on Friday before sell-off pressure resumed.
- Ethereum and XRP also climbed but faced key hurdles around $3,000 and $2.25.
- Sentiment remains downbeat across the crypto market despite notable gains for a few top altcoins.
The cryptocurrency market continued to witness a mixed outing on Friday, with Bitcoin retesting the $92,500 mark while Ethereum and XRP both broke to key resistance areas.
While gains indicated renewed investor optimism amid broader economic uncertainties, the swift retreat to below $91k for BTC highlights the fragile market sentiment.
Also, while Sky, Monero and Bitcoin Cash gained, Zcash, Dash and Aptos led the top losers in the leading 100 coins by market cap.
Bitcoin breaks to highs near $93k
Bitcoin’s price marked a decisive breach of the $92,500 resistance level by rising to near $93,000.
On Friday, the benchmark asset hit highs of $92,969 across major exchanges. However, the level has proved a robust barrier that means the quest to break higher towards the psychological $100 mark continues to evade bulls.
QCP Group analysts shared the short-term Bitcoin price outlook via an X post. They see mid-$90k levels as key supply wall zones, while major support remains in the $82k-$80k area.
“Options markets show caution even as year-end BTC call open interest stays heavy. Skew, IV and sentiment have softened, reinforcing a rangebound profile. Supply likely caps moves toward mid-90Ks, while support sits near 80–82K, leaving macro catalysts firmly in control of direction.”
Despite the dip to below $91k as of writing, BTC’s gains earlier in the day allowed layer-1 and layer-2 solutions on the Bitcoin network to post gains.
As noted, BounceBit and Stacks were among the Bitcoin ecosystem tokens to see an uptick.
But as prices have dipped again, rather than bounce higher, this latest move could be a dead cat bounce.
ETH and XRP face resistance
Like Bitcoin, Ethereum has struggled to sustain momentum. Recently, the top altcoin fell to lows of $2,600 after closing above $4,000 in late October. The breach of the $3,000 level threatened more pain for bulls.
However, after testing the demand reload zone, the ETH price has jumped back to the resistance area above $3,000.
That’s despite a 25% dip over the past month.
While prices are nearly 9% up in the past week, ETH’s inability to break higher reflects broader altcoin fatigue. Bitcoin’s drop to $90,504 at the time of writing suggests a potential downward cascade for ETH.
XRP has fared similarly, trading at $2.18 amid a 1.4% dip in the past 24 hours.
The token faces formidable overhead resistance at $2.25 and at $2.50. Per market data, the latter marks a level at which bulls have struggled since the crash on Oct. 10,2025.
The launch of spot XRP ETFs in recent days has failed to help bulls break higher.


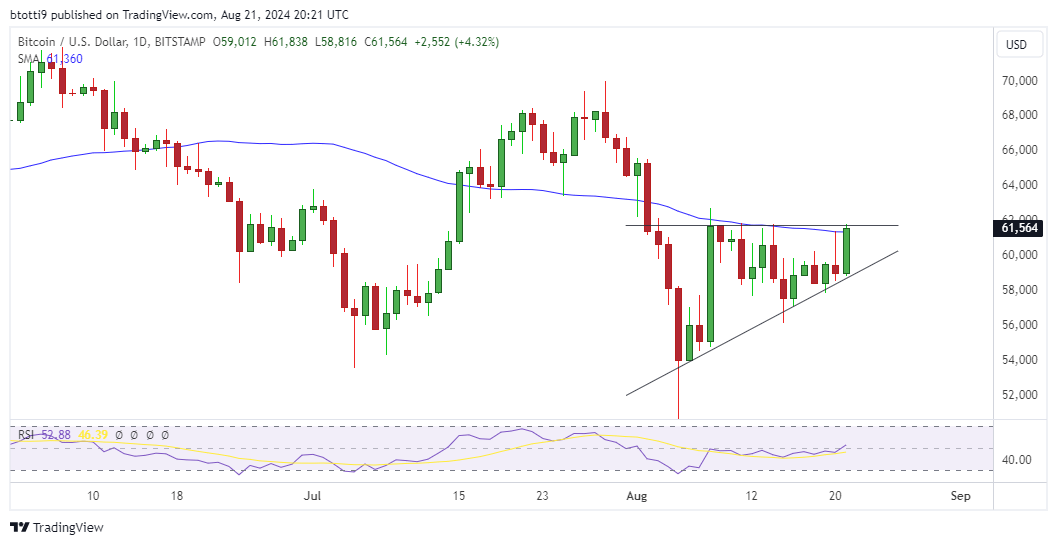


 Source: TradingView
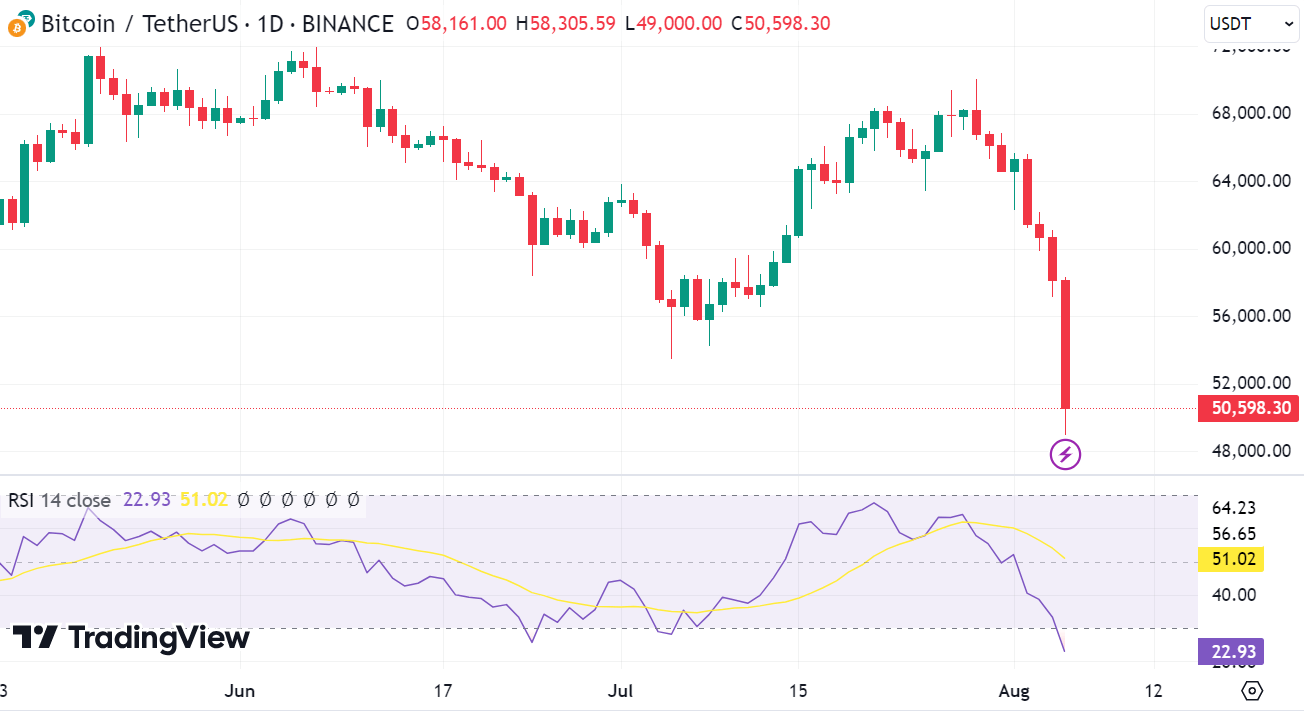