Tag: Today

  • Altcoins today: Perpetual tokens shed over $2B as ETH slips under $3.5K

    Altcoins today: Perpetual tokens shed over $2B as ETH slips under $3.5K

    Altcoins today: Perpetual coins shed over $2B as ETH slips under $3.5K

    • Alts suffered a bloodbath on Tuesday as Ethereum surrendered a key level.
    • Perpetual tokens lost over $2B amid broader sell-offs.
    • New US sanctions on North Korea fuel fears of stiffer crypto regulations.

    Digital assets saw another dip today, as Bitcoin fell to $102,425 after losing nearly 4% of its value over the past 24 hours.

    Altcoins extended their declines as Ethereum plummeted by over 6% to $3,401.

    The global cryptocurrency market lost 3% the previous day to $3.43 trillion.

    Amidst the broader bloodbath, tokens linked to perpetual decentralized exchanges appeared to suffer the most.

    According to Coingecko data, the value of perp tokens reduced from $18.511 billion to $16.381 billion in the last 24 hours.

    That’s a roughly 13% dip, reflecting significant bearishness within a sector that many anticipate to shape the next stage of crypto evolution.

    Top tokens in the category, including ASTER, HYPE, and JUP, have lost more than 10% of their value within the past day.

    Perpetual tokens exhibit heavy selling pressure, signaling more downtrends before potential bounce-backs.

    Sanctions stir uncertainty over regulation

    The cryptocurrency market has experienced faded sentiments lately.

    Various developments contribute to the current bearish mode.

    For instance, the Fed Governor magnified uncertainty over December interest rates with his latest remarks on Bloomberg Surveillance.

    Also, bears thrived after the DeFi platform Balancer suffered an over $100 million hack.

    Further, Stream Finance’s decision to freeze withdrawals and subsequent de-peg of its stablecoin added fuel to the fire.

    The US Treasury Department crashed the struggling market after announcing new sanctions targeting North Korean crypto activities.

    The Office of Foreign Assets Control confirmed sanctions against entities and individuals involved in information technology worker fraud and crypto-associated crime used to fund North Korea’s missile programs.

    The post detailed:

    Over the past three years, North Korea-affiliated cybercriminals have stolen over $3 billion in cryptocurrency. Often using sophisticated techniques such as advanced malware and social engineering.

    Meanwhile, the announcement triggered panic across the markets as it hinted at stiffer cryptocurrency regulations and possibly aggressive enforcement moves.

    Such developments might catalyze a regulatory domino effect where DeFi projects and exchanges face intensified scrutiny.

    Market players potentially began reducing exposure as the sanctions updates surfaced, accelerating the broader sell-offs.

    Crypto market outlook

    The cryptocurrency market displays substantial selling pressure.

    Coinglass data shows liquidations surged past $1 billion over the past 24 hours.

    Long positions suffered the most at $845 million, with shorts at $183 million.

    Bitcoin lost the key support zone at $107,500 during the latest decline from weekly highs of above $115,300.

    It looks poised for extended dips to the psychological level at $100,000 before setting a clear trajectory.

    Thus, altcoins, including perpetual tokens, will likely plummet further from their current price levels before stabilizing and potentially bouncing back.


    Source link

  • Why did Conflux price spike 38% today?

    Why did Conflux price spike 38% today?

    Conflux Price Surge

    • Conflux price rose 38% amid multiple key integrations.
    • Bulls could push CFX price to $0.50 and target $1 in the short term.
    • Most cryptocurrencies are trading at key support levels, with Conflux set to ride on overall bullish sentiment.

    Conflux (CFX) price rose 38% in 24 hours to hit highs of $0.27 and lead top gainers in early trading on July 29.

    The gains came amid several strategic integrations and partnerships for Conflux, with daily volume also rising as CFX jumped to prices last seen in mid-April.

    A technical outlook suggests a retest of the $0.50 level is possible as Conflux continues to attract attention as a decentralised finance and artificial intelligence ecosystem.

    Conflux price: CFX gains amid major network integrations

    Conflux Network’s native token has benefited from fresh upside momentum as the ecosystem sees a series of high-profile collaborations.

    Both in DeFi and AI, these integrations are set to enhance the utility and market appeal of CFX.

    Among the pivotal developments is the partnership with OrcaMind.AI, which brings AI-driven payment solutions to the Conflux Network.

    Set to amplify upside momentum is the announcement that Conflux Network has joined forces with Fufuture, a decentralised perpetuals platform, a move set to integrate advanced trading capabilities and expand CFX adoption.

    These efforts add to recent momentum fueled by Conflux’s partnership with AnchorX and Eastcompeace Technology to unveil an offshore yuan-pegged stablecoin.

    “We have joined forces with AnchorX and Eastcompeace Technology for offshore RMB stablecoin (AxCNH) projects, cross-border settlement, and RWA initiatives across Belt and Road countries,” Conflux posted on X.

    Also crucial is Conflux’s mainnet upgrade, with transactions boost adding to scalability as the network looks to expand its footprint across real-world assets tokenisation and cross-border payments.

    Support in China is a major factor for CFX.

    CFX price outlook

    Bullish sentiment has indeed catalysed a 34% uptick this past week and over 250% in the past month.

    However, Conflux price remains well off the all-time high of $1.70 reached in 2021.

    Conflux price chart by CoinMarketCap

    What’s next for CFX is therefore a key sentiment factor for analysts and investors, who might look at the 24-hour spike of 38% and 250% in 30 days as a pointer to where prices might go next.

    The integrations and partnerships could drive more gains, albeit with market volatility and the overall crypto outlook a significant consideration.

    But should the network continue to leverage AI integration and cross-chain capabilities, a bounce in altcoins will solidify CFX’s upward potential.

    A breakout to $0.50 in the short term will allow bulls to target $1 and higher. Meanwhile, a downward flip may bring $0.20 and 0.15 into play as support levels.


    Source link

  • Crypto news today: Bitcoin nears all-time high; ETH, DOGE, PEPE, ATOM show bullish signs

    Crypto news today: Bitcoin nears all-time high; ETH, DOGE, PEPE, ATOM show bullish signs

    Crypto news today: Bitcoin nears all-time high; ETH, DOGE, PEPE, ATOM show bullish signs

    • Bitcoin surged past $100K this week, fueled by strong spot ETF inflows of over $1 billion.
    • With Bitcoin nearing its all-time high, key support is now eyed around the $100,000 level.
    • Ether experienced a dramatic price jump, breaking $2,600 and targeting $3,000.

    Bitcoin has decisively reclaimed ground above the psychologically crucial $100,000 mark this week, signaling a resurgence of bullish momentum in the cryptocurrency market.

    Supported by substantial inflows into spot Bitcoin ETFs, particularly BlackRock’s IBIT fund, buyers are now attempting to consolidate these gains and potentially push towards new all-time highs.

    This renewed strength in the market leader is also igniting interest in several altcoins, prompting discussions about the potential onset of an “altseason.”

    The past week saw Bitcoin climb over 10%, with buyers successfully pushing the price through significant resistance levels.

    This rally has been notably backed by consistent institutional demand, exemplified by BlackRock’s IBIT spot Bitcoin ETF extending its inflow streak to 19 days, attracting $1.03 billion in the latest trading week alone, according to Farside Investors data.

    Technically, Bitcoin is gradually inching towards its all-time high of $109,588, indicating a measured but confident advance by the bulls who seem reluctant to book profits prematurely.

    While this strong rally has pushed the Relative Strength Index (RSI) into overbought territory – often a precursor to a short-term correction or consolidation – any pullback is anticipated to find robust support between the $100,000 level and the 20-day exponential moving average (EMA), currently around $96,626.

    A successful rebound from this support zone would significantly increase the probability of a breakout above $109,588, potentially targeting $130,000.

    However, bears still have a window to regain control.

    A swift and decisive break below the 20-day EMA could trigger a sharper decline towards the 50-day simple moving average (SMA) near $88,962.

    On shorter timeframes, strong selling pressure is expected in the $107,000 to $109,588 zone.

    A successful defense of the 4-hour 20-EMA on any dip would signal continued bullish strength, while a break below $100,000 could open the door for a deeper correction towards $93,000 or even $83,000.

    Ether (ETH) skyrockets, eyes further upside

    Ether (ETH) experienced a dramatic surge, catapulting from $1,808 on May 8 to $2,600 by May 10, showcasing aggressive buying pressure.

    This rapid ascent also pushed its RSI into overbought territory, suggesting a potential near-term consolidation or minor pullback.

    Key support levels to watch on the downside are $2,320 and then $2,111.

    If Ether finds support at these levels and turns higher, the ETH/USDT pair could extend its rally towards $2,850 and subsequently aim for the $3,000 mark.

    However, a break below the $2,111 support would invalidate the immediate bullish outlook, potentially leading to a period of range-bound trading between $1,754 and $2,600.

    On the 4-hour chart, bulls managed to push above the $2,550 resistance but struggled to sustain those higher levels.

    A positive sign is that buyers haven’t conceded much ground, suggesting they anticipate further upside.

    A break above $2,609 could trigger the rally towards $3,000, while a drop below the 4-hour 20-EMA might initiate a deeper correction towards the $2,111 support.

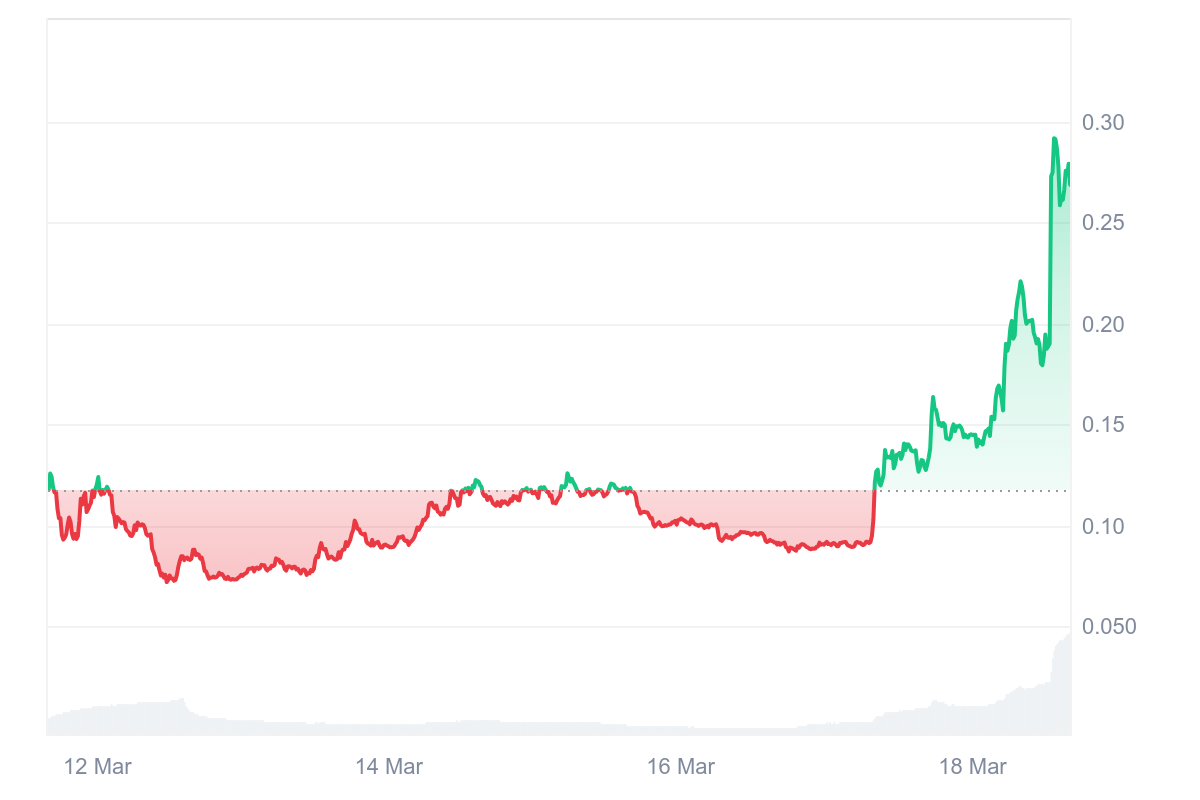
    Dogecoin (DOGE) breaks resistance, signals trend change

    Dogecoin (DOGE) showed a significant short-term trend change by soaring above the $0.21 overhead resistance on May 10.

    The rally is currently facing selling pressure near $0.26, which could lead to a retest of the $0.21 breakout level.

    If DOGE rebounds strongly from $0.21, it would indicate a shift in market sentiment from “sell the rally” to “buy the dip,” increasing the likelihood of a continued advance towards $0.31.

    To negate this bullish momentum, sellers would need to pull the price back below the 20-day EMA (around $0.19).

    Such a move could trap DOGE within a larger trading range between $0.14 and $0.26 for an extended period.

    Immediate support on any pullback from $0.26 is seen at $0.22 and then $0.21.

    Pepe (PEPE) rallies sharply, tests key levels

    Meme coin Pepe (PEPE) staged a sharp rally from its 50-day SMA (around $0.000008), breaking above the $0.000011 overhead resistance on May 8.

    This aggressive move has also pushed its RSI into overbought territory, signaling a potential pullback. The PEPE/USDT pair might drop to retest the $0.000011 breakout level.

    If this level holds as support, it would strengthen the bullish case for a rally towards $0.000017 and then $0.000020.

    Conversely, a break below the 20-day EMA (around $0.000009) would invalidate this optimistic outlook.

    On the 4-hour chart, bears are aggressively defending the $0.000014 level.

    A pullback to the 4-hour 20-EMA is a critical support to watch; a bounce could lead to another attempt to break $0.000014, while a failure could see PEPE slide back to $0.000011 or even the 50-SMA.

    Cosmos (ATOM) breaks out of base, targets higher levels

    Cosmos (ATOM) signaled a potential trend change by closing above the $5.15 resistance on May 10, breaking out of a large basing pattern.

    However, bears are expected to defend this level strongly.

    If they succeed in pushing the price back below $5.15, aggressive bulls could be trapped, leading to a pullback towards the moving averages.

    If buyers can sustain the price above $5.15, the ATOM/USDT pair could gain significant momentum and rally towards $6.50.

    While sellers will likely attempt to halt the advance there, a successful break above $6.50 could open the path towards $7.50.

    The sharp rally has pushed the 4-hour RSI into overbought territory, suggesting a short-term correction or consolidation.

    Bulls must defend the $5.15 level to maintain momentum towards $6.60. A break below $5.15 could lead to a deeper correction towards the 20-EMA or even $4.70.

    While some analysts debate whether a full-blown “altseason” has truly begun, given the modest recovery of many altcoins from their significant drawdowns, the recent price action across several key cryptocurrencies suggests a renewed bullish appetite in the market.

    Source link

  • Crypto news today: Bitcoin bulls eye $100K breakout; SUI, AVAX charts show potential

    Crypto news today: Bitcoin bulls eye $100K breakout; SUI, AVAX charts show potential

    Crypto news today: Bitcoin bulls eye $100K breakout; SUI, AVAX charts show potential

    • Bitcoin gained over 10% this week, testing key resistance near $95,000 amid strong buying.
    • US Spot Bitcoin ETFs saw massive $3.06 billion weekly inflows, signaling renewed institutional interest.
    • Avalanche (AVAX) consolidates near $23.50 resistance; a breakout could target $31.73 (double-bottom).

    Bitcoin demonstrated renewed strength this week, posting gains of over 10% as determined buyers pushed the price back towards the significant overhead resistance level near $95,000.

    While consolidating below this key hurdle, the fact that buyers haven’t ceded significant ground suggests underlying bullish conviction, further supported by robust institutional inflows and optimistic analyst projections.

    ETF inflows signal renewed institutional appetite

    The sharp upward move in Bitcoin’s price has been significantly bolstered by resurgent buying activity in the US spot Bitcoin exchange-traded funds (ETFs).

    Data from Farside Investors revealed impressive weekly inflows totaling $3.06 billion into these funds.

    Commenting on this influx, Bloomberg ETF analyst Eric Balchunas highlighted on X (formerly Twitter) how notable it was to witness “HOW FAST the flows can go from 1st gear to 5th gear,” indicating a rapid acceleration in institutional demand.

    This renewed buying coincides with bullish technical and quantitative signals. 21st Capital co-founder Sina noted on X that Bitcoin had reclaimed its “power-law price,” a model suggesting considerable long-term upside.

    Sina’s Bitcoin Quantile Model projects potential targets between $130,000 and $163,000 before the end of 2025.

    Other anonymous analysts, like apsk32, hold even more ambitious short-term targets, predicting a move above $200,000 in the fourth quarter of this year.

    Bitcoin (BTC) price analysis: bulls target $100K

    The price chart reveals a tense battle unfolding near the critical $95,000 resistance.

    Technical indicators currently favor the bulls: the 20-day exponential moving average (EMA), sitting around $88,619, is sloping upwards, and the relative strength index (RSI) is positioned near overbought territory, signaling strong buying momentum.

    A decisive close above the $95,000 mark could act as a powerful catalyst, potentially propelling the BTC/USDT pair towards $100,000 and subsequently to the $107,000 region.

    However, sellers are expected to mount a strong defense in the zone between $107,000 and $109,588.

    Conversely, the 20-day EMA serves as crucial near-term support.

    A break below this level could invalidate the immediate bullish momentum and potentially pull the price back into the broader range between $73,777 and $95,000.

    Looking at the 4-hour chart, bears are actively defending the $95,000 level but have struggled to push the price decisively below the shorter-term 20-EMA.

    A rebound off this moving average would strengthen the case for an eventual breakout above $95,000, targeting $100,000.

    However, failure to hold the 4-hour 20-EMA could lead to a deeper pullback towards the 50-simple moving average (SMA), a key level bulls must defend to prevent a slide towards $86,000.

    Sui (SUI) price analysis: testing resistance, eyeing upside

    Sui (SUI) has encountered resistance near the $3.90 level.

    However, the pullback from this high has been relatively shallow, indicating that bulls are holding their positions rather than rushing to take profits.

    If the price remains above the 38.2% Fibonacci retracement level at $3.14, buyers are likely to make another attempt to push the SUI/USDT pair above $3.90.

    A successful breakout could see the price surge towards $4.25 and potentially $5.00.

    On the downside, a break below $3.14 would signal the start of a more significant correction, potentially targeting the 50% retracement level at $2.94.

    Buyers are expected to defend the zone between $2.94 and the 20-day EMA (currently around $2.69).

    The 4-hour chart shows support near the 20-EMA, but sellers remain active at higher levels.

    A break below the 4-hour 20-EMA could trigger a drop to $3.14, while a push above the
    3.81−3.90 resistance is needed to confirm the next leg up towards $4.25.

    Avalanche (AVAX) price analysis: range consolidation, breakout potential

    Avalanche (AVAX) has been consolidating within a range defined by support at $15.27 and resistance near $23.50.

    Trading within such ranges often involves buying near support and selling near resistance.

    While buyers haven’t yet managed to decisively break above $23.50, the fact they haven’t given up much ground suggests accumulation might be occurring.

    A breakout above $23.50 would complete a potential double-bottom pattern, a bullish formation with a calculated target objective near $31.73.

    However, this optimistic scenario would be invalidated if the price turns down and breaks below the moving averages, suggesting the range-bound action might persist.

    On the 4-hour chart, AVAX has been consolidating tightly between $21.60 and $23.10. This narrow range indicates bulls are holding firm, anticipating further upside.

    A break above $23.10 could trigger a move towards $25, likely overcoming the resistance at $23.50.

    Conversely, a drop below $21.60 would signal weakening bullish resolve, potentially pulling the price down towards $19.50.

    Source link

  • Here’s why Bubblemaps (BMT) price soared 110% today

    Here’s why Bubblemaps (BMT) price soared 110% today

    • Bubblemaps (BMT) has spiked more than 110% in the past 24 hours, climbing from lows of $0.12 to intraday highs of $0.29.
    • This put BMT ahead of Mubarak (MUBARAK) and API3 (API3) in terms of 24-hour performance.
    • Binance and Bithumb news are likely catalysts for Bubblemap’s price rally.

    Bubblemaps’ native token BMT has surged by more than 110% in the past 24 hours, climbing from lows of $0.12 to intraday highs of $0.29.

    The altcoin’s gains put it at the top of the 500 largest coins by market cap, ahead of Mubarak (MUBARAK) and API3 (API3). Per CoinMarketCap, the two tokens have surged 77% and 54% respectively in the past 24 hours. Bounce (AUCTION) led gainers on Monday.

    Why did Bubblemaps price skyrocket today?

    Bubblemap’s BMT is surging amid an overall flip for some altcoins. The cryptocurrency is also surging as BMT’s traction post its token generation event continues.

    Part of this upside momentum reflects invstor enthusiasm after major announcements by Binance and Bithumb. Recently, Binance announced the launch of BMT futures and price rallied hard.

    Bubblemaps price chart by CoinMarketCap

    On Tuesday, South Korean crypto exchange Bithumb announced trading support. With another major Binance announcement out today, Bubblemaps has skyrocketed.

    “Binance is excited to announce the 12th project on the HODLer Airdrops page – Bubblemaps (BMT). Users who subscribed their BNB to Simple Earn (Flexible and/or Locked) and/or On-Chain Yields products from 2025-03-02 00:00 (UTC) to 2025-03-06 23:59 (UTC) will get the airdrops distribution,” the exchange noted.

    Users will get the HODLer Airdrops in their spot accounts at least an hour before the exchange rolls out trading.

    Expected pairs set to go live on March 18 at 15:00 UTC will be BMT against stablcoins Tether (USDT), USDC (USDC) and First Digital USD (FDUSD). Binance will also list trading pairs against BNB (BNB) and Turkish Lira (TRY).

    Bulls push BMT price to all-time high

    Positive vibes have propelled BMT’s market capitalization to over $72 million, with trading volume up 257% in 24 hours.

    Bubblemaps is a blockchain data visualization platform designed to make complex on-chain data accessible and actionable. Launched on networks like Solana and BNB Chain, Bubblemaps transforms tokenomics and wallet interactions into intuitive bubble charts, helping users identify patterns, clusters, and potential scams.

    Its native token, BMT, powers the ecosystem and serves as both a utility and governance token.

    Since its token generation event on March 11, hosted on Binance Wallet, Bubblemaps has seen its price jump to the all-time high of $0.29. Notably, BMT is up 266% since its all-time low of $0.07 on March 12.

    Momentum has swung upward amid top exchange’s listing of BMT. Apart from Binance and Bithumb, the token is available on Kraken, Bitget and Bybit.

    Source link

  • Here’s why OKB price spiked 20% today

    Here’s why OKB price spiked 20% today

    • OKB token surged more than 20% to hit highs of $61.29 on Jan. 17.
    • The altcoin, native to the OKX exchange, rose as the community reacted to news around Azuki’s Animecoin (ANIME).

    OKB registered a price surge 20% higher. The price surge follows OKX adopting OKB as the primary token for mining Animecoin which is their maiden project aimed at revolutionizing the Anime industry.

    On Friday Jan 17, the price of OKB, the native token of the OKX ecosystem rose by 20% posting a high of $58.86. This came after the crypto platform chose it as the primary token for mining Animecoin (ANIME), the Azuki backed token.

    OKX Jumpstart and ANIME tokens

    The OKX Jumpstart staking program  is set to begin mining Animecoin on Jan 20. The OKB users can stake their OKB and BTC tokens to gain Anime tokens.

    The program will run from Jan 20 to Jan 23.

    While there is no minimum limit for staking for the holders of OKB and BTC tokens, maximum staking limit is set at 600 OKB and 0.3 BTC ($30,000). Staking and unstaking is permissible at any given time.

    Of the 10 billion total token reserve, a share will go to the active participants in the OKX Jumpstart event. 50.5% of the total supply will be apportioned to the community. 37.5% of the token will go to the Azuki community who are the very first supporters of Animecoin while Community Cultivation which is held by future AnimeDao will get 13%. The 13% will be used as community incentives and initiatives.

    Partner communities will also get 2% share.

    The Anime token Listing

    The Anime token is set for listing on both the Ethereum and Arbitrum platforms on Jan 23. Sources indicate that the token will stir up great following among the Anime users,its creators and revolutinize the the anime ecosystem to a great deal.


    Source link

  • Robert Kiyosaki says Bitcoin is ‘bargain today … but not tomorrow’

    Robert Kiyosaki says Bitcoin is ‘bargain today … but not tomorrow’

    robert kiyosaki bitcoin price forecast
    • World-renowned author Robert Kiyosaki shares his view on Bitcoin.
    • Pseudonymous crypto analyst sees BTC at $100,000 in 2025.
    • Bitcoin slid back under $27,000 after Fed’s rate decision today.

    Bitcoin – the world’s largest cryptocurrency is a “bargain” today, says Robert Kiyosaki – the renowned author of Rich Dad Poor Dad.

    Robert Kiyosaki shares his view on Bitcoin

    The so-called digital gold has not been a lucrative investment over the past two months.

    But the Founder of Rich Global LLC recommends seeing the recent weakness as an opportunity to build a position in the “future” at a discount. His recent tweet reads:

    Gold, silver, bitcoin are bargains today … but not tomorrow. America is broke. Buy GSBC today before stocks, bond, real estate.

    Robert Kiyosaki even called fiat currencies “fake money” this past weekend. Also on Wednesday, Santiment – a crypto analytics platform reported an increase in Bitcoin’s on-chain activity to levels not seen since April.

    What could help propel Bitcoin price?

    Note that there’s a bunch of tailwinds that could catalyse the price of a Bitcoin in the near to medium term – the pending approval of an exchange-traded fund for example.

    And then of course, there’s the halving event scheduled or April or May of 2024. In fact, PlanB – a pseudonymous crypto analyst who also goes by 100trillionUSD reiterated today that BTC could hit $100,000 in about two years.

    He even left the prospect for it to eventually be worth $1.0 million much like what Cathie Wood has forecast multiple times this year.

    Bitcoin is currently trading at $26,900 versus its year-to-date high of $31,500 in mid-July.


    Source link

  • ‘I’m more comfortable being long Bitcoin today’

    ‘I’m more comfortable being long Bitcoin today’

    galaxy digital ceo shares view on bitcoin
    • Michael Novogratz puts Bitcoin and Gold in the same bucket.
    • Wolfe Research strategist reiterated his bullish view on BTC.
    • Bitcoin is currently up 80% versus the start of the year 2023.

    Owning Bitcoin today is nowhere as scary as it was about six months ago, says Michael Novogratz – the Chief Executive of Galaxy Digital.

    Novogratz shares his view on Bitcoin

    Interest rates continued to go up this year; FTX collapsed; the U.S. Securities & Exchange Commission came down hard on bellwethers of the crypto space.

    And yet, Bitcoin has outperformed every other financial asset – now up 80% year-to-date.

    What that establishes beyond doubt, as per Novogratz, is that the world’s largest cryptocurrency is here to stay. On CNBC’s “Squawk Box”, he said:

    The normalization of 5.0% budget deficit … is why Bitcoin, gold, silver trade great. I put them all in the same bucket. Bitcoin has got the additional adoption cycle.

    Novogratz sees Bitcoin as digital gold

    Novogratz drives his optimism also from BlackRock Inc that has recently filed with the regulator for a Spot Bitcoin ETF which could boost institutional interest in the digital asset.

    I’m more comfortable being long Bitcoin today than I was six months ago. I like to think of BTC as digital gold to store value.

    Meanwhile, Jacobi Asset Management is all set to debut its Bitcoin-focused exchange-traded fund in Europe by the end of this year.

    Also on Thursday, Wolfe Research strategist Rob Ginsberg reiterated his bullish view on BTC. He agreed, though, that the cryptocurrency has to fight an uphill battle to reclaim its former highs.

    Source link

  • Why is Bitcoin price up today?

    Why is Bitcoin price up today?

    Key takeaways

    • Bitcoin briefly touched the $29k level on Wednesday after rallying by more than 6% in the last 24 hours.

    • The rally comes after BlackRock filed for a Bitcoin ETF and Fidelity, Schwab, and Citadel backed a crypto exchange.

    Institutional interest pushes Bitcoin higher

    Bitcoin has been performing well since the start of the week and set a new milestone a few hours ago. The leading cryptocurrency touched the $29k level for the first time since May after adding more than 6% to its value over the last 24 hours.

    At press time, the price of Bitcoin stands at $28,834 per coin. Bitcoin reached a daily high price of $29,110 a few hours ago before retracing to currently trade above $28,800 per coin.

    The rally comes as institutional interest in the cryptocurrency market increased in the last few days. 

    Earlier this week, BlackRock, the world’s largest asset management firm with nearly $10 trillion in assets under management, applied with the US Securities and Exchange Commission (SEC) to launch a Bitcoin exchange-traded fund (ETF). 

    The SEC has rejected all the spot Bitcoin ETF applications filed over the years. However, market participants are optimistic that the SEC could approve BlackRock’s application due to the company’s standing.

    A few hours ago, EDX Markets, a crypto exchange backed by Fidelity, Schwab, and Citadel, also went live

    The increased interest in the crypto market by traditional financial institutions fueled Bitcoin’s rally over the last 24 hours. 

    Bitcoin Eyes $30k

    Bitcoin could be looking to break past the $30k psychological level in the near term if the current market momentum is maintained. The technical indicators currently show that Bitcoin is bullish.

    If the Bulls can maintain the current market sentiments, Bitcoin could rally toward the $30k level in the next few hours. 

    The total cryptocurrency market cap surged past the $1.1 trillion mark a few hours ago as Bitcoin and the other leading cryptocurrencies rallied. 

    Source link

  • Why is the crypto market up today? Imminent debt ceiling vote boosts the market

    Why is the crypto market up today? Imminent debt ceiling vote boosts the market

    Key takeaways

    • The cryptocurrency market is up by more than 2% today after underperforming for the best part of May.

    • Bitcoin topped the $28k mark for the first time this month.

    • The rally comes as President Biden and the House leadership reached an agreement on the debt ceiling.

    Crypto Market Cap Reaches $1.16 Trillion

    The cryptocurrency market performed well over the weekend, with most coins and tokens trading in the green zone.

    For the first time this month, the total cryptocurrency market cap reached the $1.16 trillion threshold for the first time this month. 

    The rally comes following an agreement between President Biden and the House leadership on United States’ debt ceiling. President Biden and congressional Republican Kevin McCarthy reached an agreement to suspend the federal government’s $31.4 trillion debt ceiling over the weekend. 

    However, the deal still has to pass through Congress later this week. The vote is expected to take place on Wednesday before the United States runs out of money to pay its debts in early June.

    The deal sparked optimism amongst investors that the United States would not default on its debt. If the US default on its debt, a recession would likely follow, and this could see the financial markets experience massive losses. 

    Bitcoin Rallies To $28k 

    Bitcoin, the world’s leading cryptocurrency by market cap, touched the $28k level for the first time in three weeks. Bitcoin started May trading above $29k per coin but plunged to a low of $26,008 last week. At press time, the price of Bitcoin stands at $27,953 per coin. 

    The leading cryptocurrency is now slowly recovering, thanks to the positive news from the United States. 

    Ether, the second-largest cryptocurrency in the world, also moved past the $1,900 level for the first time in weeks, adding more than 3% to its value in the last 24 hours. At press time, the price of Ether stands at $1,904. 

    Source link