Tag: Trading

  • Why you need caution trading Bitcoin (BTC/USD) this week

    Why you need caution trading Bitcoin (BTC/USD) this week

    Bitcoin (BTC/USD) trades at $20,390, a clear price decline since topping $21,000 late last month. There is no doubt that BTC remains resilient against a less reassuring macro outlook. The cryptocurrency has strongly defended the $19,500, which has become a crucial psychological level. Consequently, BTC’s technical outlook remains bullish as long as this level is maintained. But investors may need to exercise caution this week.

    The Federal Reserve interest rate decision remains the focal point this week. We already know that inflation has been running higher than estimated. With that in mind, investors have earmarked a 75-basis points rate hike when the Fed issues a statement. The expectation has raised caution in all markets, which has been responsible for the BTC slowdown. A rate hike followed by a hawkish Fed statement could spook markets and force a further price fall.

    On the contrary, expectations grew mixed the last one week that Fed may settle for a soft stance. With growing recession fears, analysts projected that the Fed would move slower. For this reason, BTC saw some recoveries to above $21,000.

    As the Fed nears its policy decision, mixed expectations may not be good for Bitcoin. That is captured in the price reaction, which has stalled despite remaining stable.

    Bitcoin stalls ahead of FOMC decision

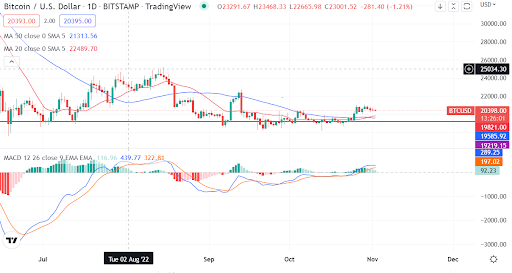
    Source – TradingView

    On the daily chart, Bitcoin met a minor resistance at $21,000. Momentum is weakening, but the MACD indicator remains in the bullish zone.

    The 20-day MA crossed above the 50-day MA, suggesting that BTC was heading higher. Both moving averages support the cryptocurrency below.

    Should you buy BTC?

    The technical indicators and the $19,500 support give a bullish view of the BTC price. However, the sentiment around cryptocurrencies, in general, is mixed. Investors are turning to the Fed statement to assess a bull scenario.

    A dovish Fed could be the trigger for BTC to move higher. Similarly, the cryptocurrency could head back to $19,500 on a hawkish Fed. Investors should be patient for now and gauge the BTC price based on the Fed decision.

    Where to buy BTC

    eToro

    eToro offers a wide range of cryptos, such as Bitcoin, XRP and others, alongside crypto/fiat and crypto/crypto pairs. eToro users can connect with, learn from, and copy or get copied by other users.


    Buy BTC with eToro today

    Bitstamp

    Bitstamp is a leading cryptocurrency exchange which offers trading in fiat currencies or popular cryptocurrencies.

    Bitstamp is a fully regulated company which offers users an intuitive interface, a high degree of security for your digital assets, excellent customer support and multiple withdrawal methods.


    Buy BTC with Bitstamp today

    Source link

  • How Does it Rank Tuesday on Long-Term Trading Metrics?

    How Does it Rank Tuesday on Long-Term Trading Metrics?


    Shiba Inu receives a strong long-term technical score of 71 from InvestorsObserver analysis. Our proprietary scoring system considers the trading patterns over the past several months to a year by analyzing the token’s consistency, volatility, and where it is relative to long-term averages to determine whether it’s a strong buy-and-hold investment opportunity.

    Currently, SHIB holds a superior long-term technical analysis score than 71% of crytpocurrencies. Long-term investors employing a buy-and-hold strategy will find the Long-Term Rank especially relevant when allocating their assets and may find additional value finding cyptos with a high short-term technical score to discover tokens that have bottomed out.

    Long-Term Technical - 71
    InvestorsObserver is giving Shiba Inu a 71 Long-Term Technical Rank. Find out what this means to you and get the rest of the rankings on Shiba Inu!

    Trading Analysis

    The current trading price of $0.000010002 for SHIB is -$0.0000018 (-15.20%) below the tokens 100-day moving average of $0.000011796. SHIB meanwhile is $0.0000028 (-152835551.42%) above its 52-week low of $0.000007197 and -$0.00007845 (-11305707.43%) under its 52-week high price of $0.000088451. Shiba Inu’s current price relative to the tokens long-term average and 52-week high and low, gives the crypto a strong long-term technical score of 71. The price movement and range of SHIB suggest that investors are neutral on the token at this time.

    Shiba Inu currently has a total market cap of $5,491,960,713.56 to go along with its average daily volume of $817,872,064.98 worth of the currency over the past seven days. SHIB’s volume is below its seven day average as of the past 24 hours, with 111,373,385.17 exchanged in that period.

    Summary

    Trading patterns over the last year for Shiba Inu leads to the token’s a strong long-term technical score of 71 as its consistency, volatility, and relation to long-term averages has given investors reason to be neutral on the token.

    Click Here to get the full Report on Shiba Inu (SHIB).

    Stay In The Know

    Subscribe to our daily morning update newsletter and never miss out on the need-to-know market news, movements, and more.

    Thank you for signing up! You’re all set to receive the Morning Update newsletter

    Source link