Bitcoin’s price is experiencing its lowest level of volatility since 2012 and bullish traders defended the $19k level for the 41st consecutive day on Monday. Despite holding $19k, when traders settled-up at 12:00 AM UTC, BTC’s price was -$239.8 for the day.
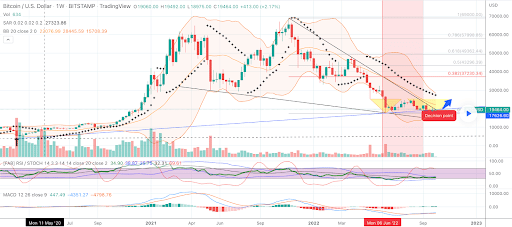
We’re starting our price analyses today with the BTC/USD 1W chart below from ft-73. BTC’s price is trading between the 0 fibonacci level [$17,664.04] and the 0.382 fib level [$37,230.34], at the time of writing.
Bullish traders need to do more than just stall bearish momentum and they firstly need to regain BTC’s 2017 ATH [$19,891] with a second target of eclipsing the asset’s 200WMA [$23,719].
Above those targets are the typical fib level aims of 0.382, 0.5 [$43,296.39], 0.618 [$49,362.44], 0.786 [$57,998.85] and the 1 fib level [$69,000] on the BITSTAMP chart.
From the perspective of bearish traders, they’re looking to again send BTC’s price below the 0 fib level which will mark a fresh 2022 and 12-month low for the asset.
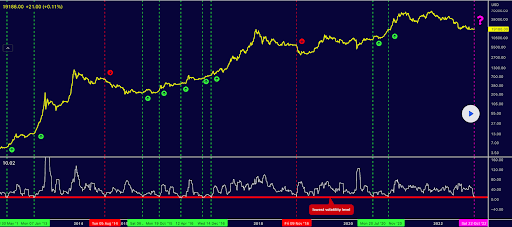
Traders can see just how low the volatility is on the chart below from Babenski.
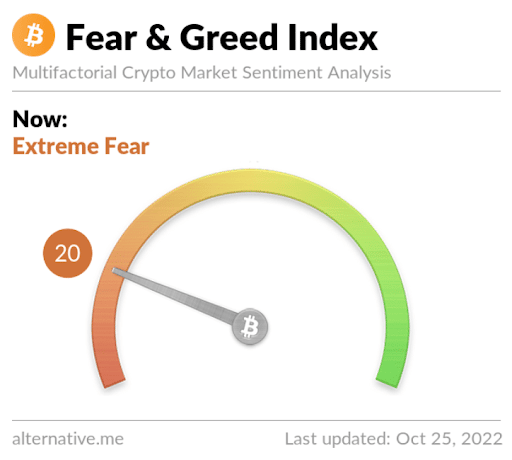
The Fear and Greed Index is 20 Extreme Fear and is -2 from Monday’s reading of 22 Extreme Fear.
Bitcoin’s Moving Averages: 5-Day [$19,231.25], 20-Day [$19,438.56], 50-Day [$20,069.44], 100-Day [$21,267.31], 200-Day [$29,911.07], Year to Date [$30,612.38].
BTC’s 24 hour price range is $19,157-$19,601.2 and its 7 day price range is $18,788.33-$19,660.63. Bitcoin’s 52 week price range is $17,611-$69,044.
The price of Bitcoin on this date last year was $63,100.
The average price of BTC for the last 30 days is $19,335.8 and its -0.2% over the same stretch.
Bitcoin’s price [-1.23%] closed its daily candle on Monday worth $19,331.4 and in red figures for the first time in four days.
Ethereum Analysis
Ether’s price was also sent lower on Monday and ETH finished the day -$20.31.
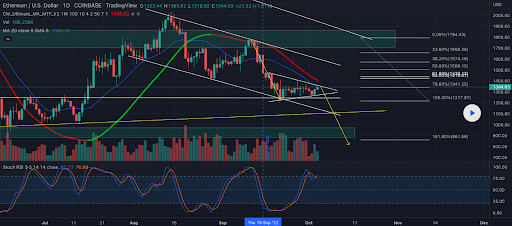
The ETH/USD 1D chart by EdgarTigranyan is the second chart we’re focusing on this Tuesday. ETH’s price is trading between the 100.00% fib level [$1,217.87] and 78.60% [$1,341.25], at the time of writing.
If bullish traders can regain the 78.60% fib level their targets are as follows, 65.00% [$1,419.67] 61.80% [$1,438.12], 50.00% [$1,506.15], 38.20% [$1,574.18], 23.60% [$1,658.36], and a full retracement at 0.00% [$1,794.43].
Bearish Ether traders are conversely trying to continue ETH’s downtrend that began during the week leading up to The Merge. The targets to the downside for bears are the 100.00% fibonacci level followed by the 161.80% fib level [$861.56].
Ether’s Moving Averages: 5-Day [$1,308.50], 20-Day [$1,321.38], 50-Day [$1,475.22], 100-Day [$1,444.33], 200-Day [$2,077.12], Year to Date [$2,145.14].
ETH’s 24 hour price range is $1,324.17-$1,370.6 and its 7 day price range is $1,264.48-$1,370.6. Ether’s 52 week price range is $883.62-$4,878.
The price of ETH on this date in 2021 was $4,220.35.
The average price of ETH for the last 30 days is $1,316.22 and its +1.73% over the same interval.
Ether’s price [-1.49%] closed its daily candle on Monday worth $1,343.88 and in red digits also for the first time in four daily candle closes.
Shiba Inu Analysis
Shiba Inu’s price followed the macro market cap low on Monday and when SHIB’s daily candle was printed it was -$0.0000024.
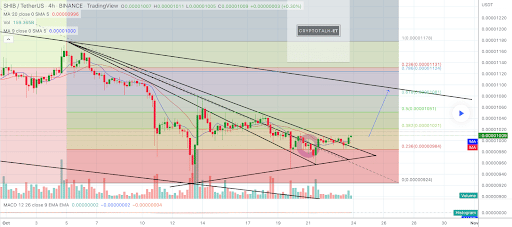
The final chart we’re looking at today is the SHIB/USDT 4HR chart below from abanefsobulls. Shib’s price is trading between the 0.236 fib level [$0.000009884] and 0.382 [$0.00001021], at the time of writing.
The overhead targets for bullish SHIB traders are 0.382, 0.5 [$0.00001051], and 0.618 [$0.00001081].
Bearish SHIB traders that are still short the asset want to push SHIB’s price below the 0.236 fibonacci level followed by a target of a full retracement back at 0 [$0.00000924].
Shib’s 24 hour price range is $0.00000984-0.00001019 and its 7 day price range is $0.00000974 / $0.00001045. Shiba Inu’s 52 week price range is $0.00000716-$0.0000884.
Shib’s price on this date last year was $0.00003599.
The average price of SHIB over the last 30 days is $0.00001068 and its -8.2% over the same duration.
Shiba Inu’s price [-2.36%] closed its daily session on Monday worth $0.00000992 and in red digits for the second time over the last three days.

Leave a Reply