- The crypto market is stabilizing after a sharp correction and a massive leverage flush.
- Analysts see the move as a healthy reset, not a structural breakdown.
- While speculators were purged, institutional money continues to accumulate.
A fragile but significant calm has settled over the cryptocurrency market, as it begins the slow and painful process of healing from a brutal correction that has purged the speculative excess from the system.
Bitcoin is holding steady, a quiet resilience that analysts believe is not a sign of weakness, but of a market that has undergone a healthy and necessary reset.
As Asia begins its trading day, Bitcoin is hovering around $110,300 dollars, with Ethereum changing hands at $3,970.
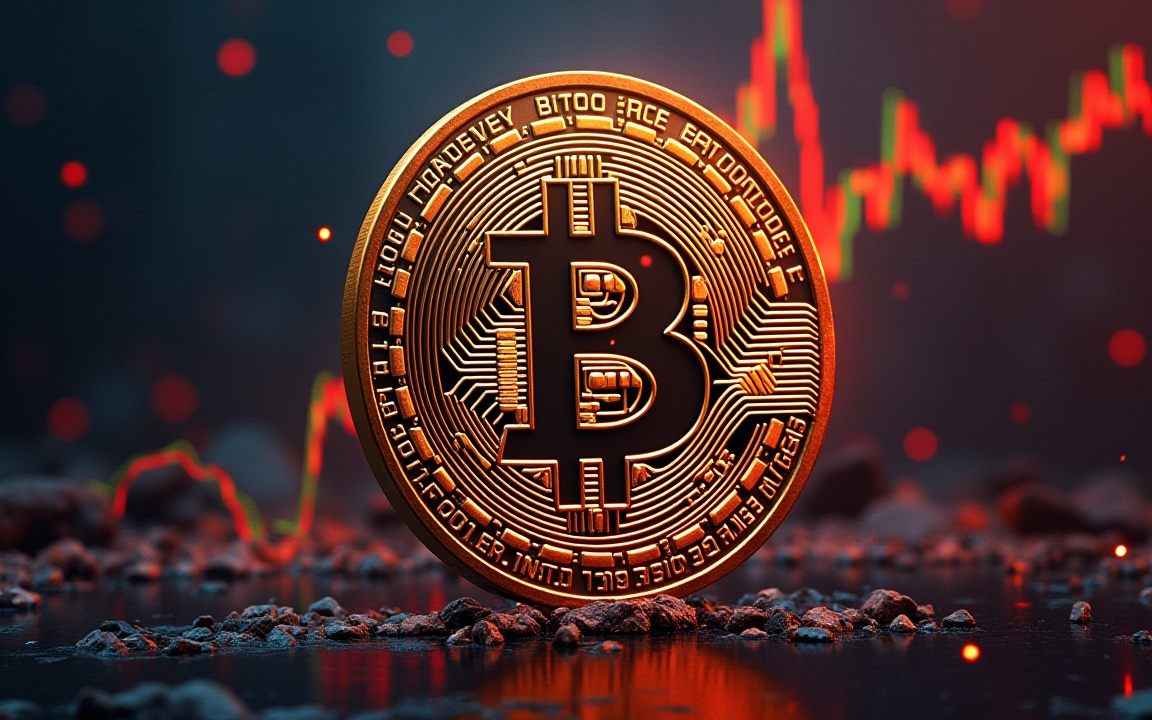
This newfound stability comes after a sharp and violent sell-off that had pushed Bitcoin as low as 104,000 dollars just last week.
The great reset: A cleansing of speculative excess
The key to understanding the market’s current state is to see the recent crash not as a catastrophic failure, but as a violent and necessary cleansing. In a recent market note, the analytics firm Glassnode described the move as a “flush, not a failure.”
The firm’s analysis shows that the speculative leverage that had been driving the market has been decisively unwound, futures open interest has fallen sharply, and traders have been realizing losses in a defensive normalization, not a full-blown capitulation.
This view is echoed by other market observers who see a similar dynamic playing out in the world of capital formation.
The market maker Enflux, in a note to CoinDesk, highlighted the news of Blockchain.com’s planned US SPAC listing as a “full-circle moment” for crypto exchanges, a sign that the industry is once again re-engaging with the public markets, but this time from a position of greater maturity.
The quiet accumulators: The giants beneath the surface
While the speculative layer of the market has been flushed out, a different and far more powerful story is unfolding beneath the surface.
While retail traders were being liquidated, the institutional giants were quietly buying the dip.
Enflux pointed to Tom Lee’s Bitmine allocating another $800 million to buy more ETH as an “infrastructure-scale commitment,” a clear and powerful sign that institutional money is not just staying, but is actively accumulating.
This is the great divergence that now defines the market: the short-term speculators have been purged, while the long-term capital is quietly and methodically rebuilding the foundation.
A new harmony in a chaotic world
This reset is also reshaping the very narrative that governs the market. As Enflux noted, gold’s continued and stunning strength—surging to a new record of $4,380.89 an ounce—is no longer seen as a threat to Bitcoin, but as a complementary signal.
It shows that in a world of deep macroeconomic and geopolitical uncertainty, digital assets now coexist with traditional hedges, a sign of a broader portfolio shift toward diversification, not abandonment.
The market may be wounded, but it is also wiser, and a new, more resilient foundation is quietly being laid.