the thing is that why OTHER exchanges should fear is <binance making its world wide dominance > through Politics , money and sponsorships and influence over people mind
BINANCE SMART CHAIN : Binance let people create new tokens and exchange with their own pancake swap and selling people new crypto made of their eco system example your money became a token your token was traded your token made a million dollar market cap got listed on binance coin market cap / your token listed on binance / from start to end the whole profit maker was binance and you even know that.
After satoshi Binance has most power in crypto world . but how a exchange founded less then a decade ago make this kind of progress the reason is influence over people mind telling them how big binance is and buying companies like trust wallet or coin market cap and many other things
that is WHY SHOULD OTHER EXCHANGES FEAR BINANCE
we make news less words so u not get bored while reading
Tired of Botted Influencers Need a pump With 78k+ App downloads and 3.5 Million + monthly web users BitcoinlfG : Pro Coin Tracker is among Top 5 Coin trackers globaly
● Get On Front page with Banner ads / in app buttons / trending articles Reach 5 million+ dm now pic.twitter.com/pIJ4wqlEFE
Robinhood CEO Vlad Tenev detailed the hypothetical in a lengthy Twitter thread after his retail investing platform added a feature allowing users to buy and sell dogecoin.
Tenev noted dogecoin already has “vanishingly small” transaction fees when compared to traditional credit card network charges – an advantage “compared to the 1-3% network fees that major card networks charge.”
The top boss at Robinhood is bullish about dogecoin’s outlook — proposing the meme token has the potential to become the “future currency of the internet” if the developers take a key step to improve its functionality.
But in order to compete with the likes of Visa and other mainstream payment processors, Tenev said dogecoin developers would need to boost the crypto token’s “block time,” or the process by which it verifies transactions.
Tenev said dogecoin’s current block time is “a bit on the long side for payments,” with a platform capable of performing roughly 40 transactions per second (tps).
“As a comparison, Visa’s network can theoretically handle 65,000 tps,” Tenev said. “Doge would need to be able to significantly outperform Visa, which entails increasing throughput by at least 10000x. Fortunately, this is easy to solve simply by increasing the block size limit.”
How Bitcoin Adoption in Russia Can Favour Trust wallet etc
users of trust wallet are on rise recent survey shows that binance trust wallet is gaining momentum in russia due to fall on rubel russian currency people are using us dollar to rate their products using private wallets on crypto currencies
Per a report from local news outlet Kommersant, the Russian Ministry of Finance has completed a bill addressing crypto payments in the country. The document was obtained by the local news website and confirmed by two different sources.
The bill could finally provide citizens and Russian crypto investors with clarity around digital assets and digital mining. Called “On Digital Current”, the document addresses previously unexplored aspects of Russian regulation for this nascent asset class.
Among these aspects is the classification of digital currency, the legal framework for its issuance and legal circulation in Russia, certifications, trading, and more. As Kommersant noted, Russian entities will need to be granted permission to trade cryptocurrencies and will need to comply with a rigorous identification process. The local media noted:
According to the draft law, digital currency can be accepted as a means of payment that is not the monetary unit of the Russian Federation, as well as an investment, while there must be no obligated person in relation to it.
United States-based cryptocurrency exchange Coinbase sent waves across the cryptocurrency ecosystem on Apr. 11 when it released a list of 50 crypto assets that were under consideration for listing in the second quarter of 2022 in a bid to increase the transparency of its listing process.
Responses to the release were mixed and led to some allegations of insider trading by crypto sleuths, while a majority of crypto traders took a deeper dive into the list in an attempt to discover diamonds in the rough.
Following a week’s worth of trading that saw many of the tokens on the list experience pump-and-dumps, the dust is beginning to settle revealing Morpheus Labs (MITX), Kromatika (KROM) and Big Data Protocol (BDP) as the top three gainers from the Coinbase announcement.
Morpheus Labs
Morpheus Labs (MITX) is a project that offers an extensive blockchain development toolbox designed to simplify the process of decentralized application development across a variety of networks and programming languages.
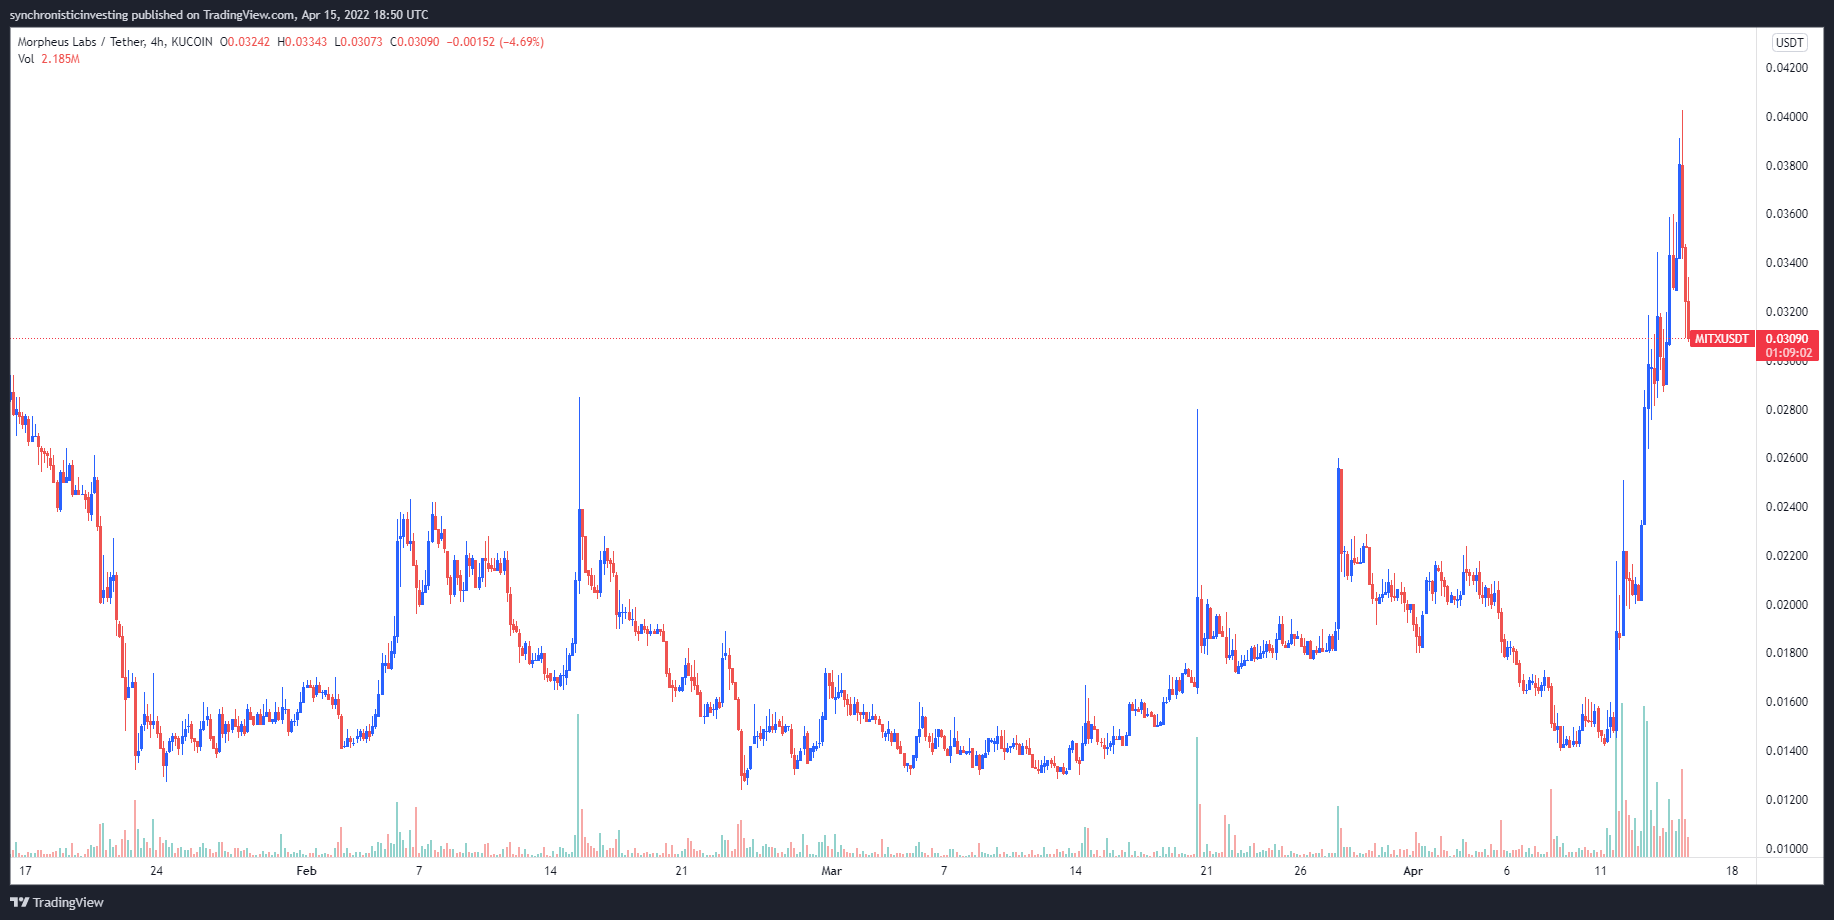
Data from Cointelegraph Markets Pro and TradingView shows that, following the Coinbase announcement, the price of MITX skyrocketed 185% from a low of $0.014 to a daily high of $0.04 on Apr. 15.
MITX/USDT 4-hour chart. Source: TradingView
In addition to the Coinbase announcement, the protocol has seen positive news flow tied to its so-called NFT Launcher, as well as the launches of the Morpheus Labs Launchpad and SEED developer portal.
Kromatika
Kromatika Finance is a decentralized crypto trading protocol that offers users a zero swap fee trading environment that eliminates front-running bots and prevents price slippage.
Data from CoinGecko shows that on Apr. 9, KROM was trading at a price of $0.0525 before rallying 145% to a high of $0.13 on Apr. 12. The token is currently trading at $0.11.
KROM/USD 2-hour chart. Source: CoinGecko
Developments that are helping to boost the outlook for KROM include the launch of Kromatika v2, which is scheduled for Apr. 20, and the possibility of being added to the Arbitrum Odyssey project.
Big Data Protocol is a decentralized finance project focused on the creation of a liquid marketplace for commercially valuable data that is sourced from professional data providers.
Data from TradingView shows that the price of BDP catapulted 204% from a low of $0.058 on Apr. 11 to a high of $0.177 immediately following the Coinbase announcement. It has since retraced to $0.128, resulting in a net gain of 121%.
BDP/USDT 4-hour chart. Source: TradingView
The bullish move higher for BDP has been sustained due to several notable developments for the protocol, including integration with Fortune 500 company Intercontinental Exchange and partnerships with MetaGameHub DAO and Securities Quote Xchange.
The overall cryptocurrency market cap now stands at $1.875 trillion and Bitcoin’s dominance rate is 40.9%.
The views and opinions expressed here are solely those of the author and do not necessarily reflect the views of Cointelegraph.com. Every investment and trading move involves risk, you should conduct your own research when making a decision.
The rollout of Ethereum 2.0, or Eth2, includes a transition from proof-of-work to proof-of-stake that will supposedly transform Ether (ETH) into a deflationary asset and revolutionize the entire network. The event has been a trending topic for years and while anticipation for “The Merge” has been building over the past couple of months, this week Ethereum core developer Tim Beiko informed the world that “It won’t be June, but likely in the few months after. No firm date yet.”
Delays in Ethereum network upgrades are nothing new and so far, the immediate effect on Ether’s price following the revelation has been minimal.
Here’s what several analysts have said about what the merger means for Ethereum and how this most recent delay could affect ETH price moving forward.
Staking Rewards expects the Merge to be a short-term boon
Based on data from Beaconscan, there is currently more than 10.9 million ETH staked on the Beacon Chain, offering a gross staking reward of 4.8%. According to a recent report from the cryptocurrency data provider Staking Rewards, this level of staking offers validators the opportunity for a net staking yield of 10.8%.
The current amount staked is equivalent to 9% of the circulating supply of Ether but several barriers including the inability to withdraw staked Ether or any rewards from the Beacon Chain have limited more widespread involvement.
In the post-Merge world, Staking Rewards expects the number of ETH staked to increase to between 20 to 30 million ETH, which would “yield a net validator return (staking return) of 4.2% to 6%.”
While the Merge has several benefits for the Ethereum network, including a reduction in the circulating supply of ETH through burning and staking, some of the main concerns facing the network remain an issue.
Chief among these are high transaction costs, difficulty of use and network congestion, leaving the door open for competing networks that offer comparable staking rewards and cheaper transactions to increase their market share.
Hayes makes the case for Ethereum Bonds
Big events like the Merge, oftentimes, turn into a “buy the rumor, sell the news” type of event in the cryptocurrency sector, but several analysts are saying that it would be a mistake to assume that with Ethereum.
According to decentralized finance (DeFi) educator and pseudonymous Twitter user “Korpi,” there are multiple factors that will change the supply and demand dynamics for Ether following the Merge.
The Triple Halvening refers to ETH issuance being reduced by 90% following the Merge, a feat that would “take three Bitcoin halvings to produce an equivalent supply reduction.”
Other bullish factors include a potential increase in the staking reward as stakers will also receive the unburnt fee revenue that currently goes to miners and an increase in institutional demand due to the ability to apply the discounted cash flow model to Ethereum which “is what institutional investors need to approve multi-million dollar investments.”
In essence, following the transition to proof-of-stake, institutional investors could start to view Ethereum as a sort of internet bond, presenting a viable alternative to the United States Treasury bonds.
This concept was explained in detail in a recent post titled “Five Ducking Digits” by former BitMEX CEO Arthur Hayes, who stated, “The native rewards issued to validators in the form of ETH-based issuance and network fees for staking Ether in validator nodes renders Ether a bond.”
Hayes provided the following chart, which illustrates how much value Ether could lose while investors still break even versus the United States bond market.
ETH/USD breakeven price expressed as a percentage change from a spot price of $3,320. Source: Medium
Based on this chart, if the staking rate is 8% Ether price could fall 32.6% in value and still be equal to a 10-year 2.5% interest bond.
With many analysts making long-term Ether price projections of $10,000 and higher, there is potential for many U.S. bond investors to start seeking yields from Ether staking rather than the U.S. bond market, assuming the institutional infrastructure needed to support these types of investments is present and approved.
On the trading front, several ways to trade the Merge were discussed by pseudonymous Twitter user “ABTestingAlpha,” who noted that there will be less selling pressure following the Merge because the regular sales by proof-of-work miners will stop.
According to ABTestingAlpha, this is likely to be a crowded trade on the long side which means there will be “a good chunk of momentum traders getting long Ether into the Merge.”
This will help with incremental price gains, but it’s important to remember that these traders aren’t likely to hold Ether long term, so it’s important to try and determine when they will sell.
Based on the news of the recent delay, the launch of the Merge would be considered late by ABTestingAlpha, which leaves several possible scenarios. With the current delay pushing the launch into the second half of 2022, there is a chance that momentum traders sell their tokens which could result in a loss of the 75% to 80% gains made by Ether since mid-March.
If the delay is extended into 2023, sentiment is likely to be crushed, resulting in momentum traders selling with some opening short positions. This is the worst-case scenario and could lead to Ether liquidity flowing into cash and other layer-one and layer-2 protocols.
ABTestingAlpha said:
“Outcome: Ether sells off, giving back all its gains into the Merge plus an additional 30-50%.”
At this point, the situation has turned into a waiting game and a test of patience because the official launch of the Merge is unknown and the crypto market is notorious for having a short attention span.
Want more information about trading and investing in crypto markets?
The views and opinions expressed here are solely those of the author and do not necessarily reflect the views of Cointelegraph.com. Every investment and trading move involves risk, you should conduct your own research when making a decision.
Activity across the cryptocurrency market has been largely subdued on April 15 as traders in the United States have taken an early weekend thanks to the closure of financial markets for the observance of Good Friday.
A survey of the top 20 tokens indicates a relatively flat trading day, with Bitcoin (BTC) clinging to support above $40,000. Several lower-ranking altcoins managed to post double-digit gains on the back of recent protocol developments.
Top 7 coins with the highest 24-hour price change. Source: Cointelegraph Markets Pro
Data from Cointelegraph Markets Pro and TradingView shows that the biggest gainers over the past 24-hours were Quantstamp (QSP), DigitalBits (XDB) and AirSwap (AST).
Quantstamp launches NFT Combinator
Blockchain security and code audit provider Quantstamp led the altcoin charge as its token price spiked 35% on April 15 to reach a daily high of $0.0804.
VORTECS™ data from Cointelegraph Markets Pro began to detect a bullish outlook for QSP on April 14, prior to the recent price rise.
The VORTECS™ Score, exclusive to Cointelegraph, is an algorithmic comparison of historical and current market conditions derived from a combination of data points including market sentiment, trading volume, recent price movements and Twitter activity.
VORTECS™ Score (green) vs. QSP price. Source: Cointelegraph Markets Pro
As seen in the chart above, the VORTECS™ Score for QSP spiked into the green and hit a high of 76 on April 14, around three hours before the price increased 35% over the next day.
The move higher for QSP follows the launch of NFT Combinator, a new platform created by Quantstamp that is designed to help incubate up-and-coming digital artists and help them launch their early collections.
DigitalBits partners with David Beckham
DigitalBits is a protocol layer blockchain that is specifically designed to support brand currencies and consumer digital assets.
Data from Cointelegraph Markets Pro and TradingView shows that the price of XDB has climbed 28% from a low of $0.317 on April 14 to an intraday high at $0.404 on April 15, as its 24-hour trading volume spiked 162%.
XDB/USDT 4-hour chart. Source: TradingView
XDB’s momentum was sparked by the signing of well-known footballer David Beckham as the global ambassador for DigitalBits to help spread awareness of the project around the world.
The Airswap protocol is a developer-focused decentralized autonomous organization (DAO) that specializes in the creation of decentralized trading systems.
VORTECS™ data from Cointelegraph Markets Pro began to detect a bullish outlook for AST on April 12, prior to the recent price rise.
VORTECS™ Score (green) vs. AST price. Source: Cointelegraph Markets Pro
As shown in the chart above, the VORTECS™ Score for AST hit a high of 76 on April 12, around 60 hours before the price increased 24% over the next day.
The price reversal for AST follows the March 30 launch of AirSwap v3 and the protocol’s April 15 integration with the Avalanche network, which offers AirSwap users lower transaction fees when performing token swaps.
The overall cryptocurrency market cap currently stands at $1.877 trillion and Bitcoin’s dominance rate is 40.9%.
The views and opinions expressed here are solely those of the author and do not necessarily reflect the views of Cointelegraph.com. Every investment and trading move involves risk, you should conduct your own research when making a decision.
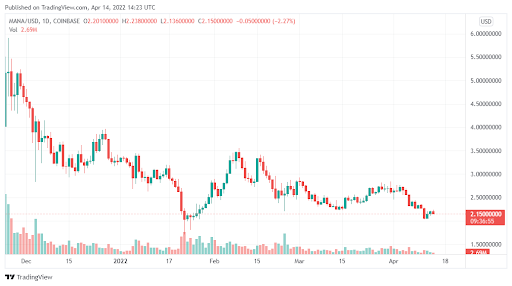
The last 7 days have been bitter-sweet for Decentraland (MANA). After initially falling, the coin has started to gain some upward momentum albeit it hasn’t been that much. But an RSI reading suggests that a potential bull run is possible. Here are the main facts:
RSI readings show MANA is now oversold, suggesting the risk of a major sell-off is low.
With limited downside risk, MANA could bounce back steadily in the near term.
The coin could surge by 50% in this bullish setup.
Data Source: Tradingview
How can MANA smash $3?
The recent uptick in bullish momentum has not been that huge. But it has been enough to bring MANA above a crucial support zone of around $2. Bulls have done quite well to keep the price action above this. As the price consolidates, we expect it to push further towards the overhead resistance of $2.3.
The Relative Strength Index or RSI appears to suggest that this is actually more likely. You see, in recent days, RSI readings have moved towards the oversold territory. This basically suggests that the risk of any major sell-off as far as MANA goes is very low.
As a result, the only way is up. If indeed MANA is able to breach overhead resistance at $2.3, then it is a matter of time before it reaches $3. The biggest challenge however will be to maintain the price action above $3.
How can investors profit from this bullish setup?
There are two ways to profit from this MANA bullish setup. First, you can buy above the $2 support. As the token tests $2.3, you can either exit or bet on it, hitting $3. Either way, a run towards $2.3 still makes you 15%.
Secondly, you can wait for the coin to breach overhead resistance at $2.3. MANA will likely surge to $3 after that, delivering gains of around 25%.
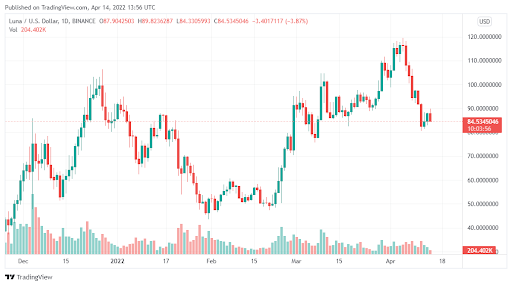
We have seen some decent positive momentum for Terra (LUNA) over the last three trading sessions. The coin however appears to have stagnated but there is still more upside for growth. Here are some key facts to note:
LUNA has fallen sharply from its $119 highs at the beginning of April.
The coin is however consolidating and could surge towards $100 in the days ahead.
This will represent a 15% upswing from the current price.
Data Source: Tradingview
How soon will LUNA hit $100?
After recording modest gains over the last two sessions in a row, LUNA appears to have stagnated. The coin is largely trading sideways, but this is actually a good thing. It means we are seeing some price consolidation following the steep correction LUNA reported after hitting $119 on April 5. Once this consolidation is done, LUNA bulls will likely take over.
This will happen in the next few days, in fact, we expect LUNA to test $100 at the beginning of trading next week Monday. The run will represent a 15% gain from its current price. The key for bulls however will be to see off any sell-off after hitting the $100.
As we have seen with many coins this year, when a decisive bull run breaks out, investors are locking profits at crucial resistance zones. The $100-mark is one such resistance for LUNA, and if bulls decide to lock profit at this price, a fall; towards $80 will be inevitable. But in the short term, the possibility of a $15 – 20% gain is highly likely.
How far can the uptrend go?
We are not sure there will be enough bullish momentum to take LUNA above $100. In fact, this price will be a huge supply zone.
Unless something drastic happens, the upswing potential for the coin is severely limited for now. But if the token can sustain gains above $100 for a few days, then a surge towards $120 is not out of the question.
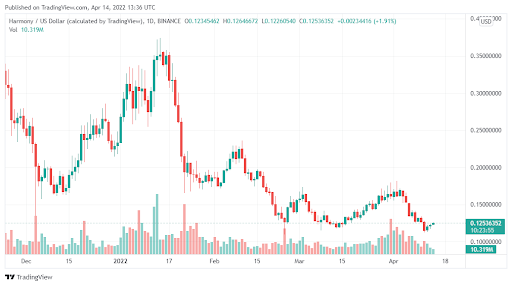
Harmony (ONE) had suffered a major sell-off at the start of April. The coin in fact hit the lowest level since the tail end of February and was looking bearish. But so far, it seems like the token is rebounding. How long can this uptrend last? Learn more below but first, here are key takeaways from the article:
Harmony has managed to maintain strong support at $0.1130 in recent weeks.
The coin has surged by 6% in the last 24 hours albeit it remains 10% down for the week.
The rally over the last few days seems unlikely to last that long.
Data Source: Tradingview
Harmony (ONE) – Why the recent uptrend will fade?
There is a very big difference between a rebound and a trend reversal. When coins go through a sustained bearish period, they are likely to rebound slightly but overall, the bearish conditions still remain. This is the exact case with Harmony (ONE).
Although the coin has posted some decent gains in the last few days, we don’t expect the medium-term bearish trend to reverse. In fact, ONE still remains well below its 25- and 50-day SMAs. Besides, a look at the chart shows that coin has formed an inverted cup and handle pattern.
These two indicators suggest that a bearish trend is still expected. Perhaps the good news for ONE investors is the fact that the coin is still trading above the crucial support zone of $0.113. But if this price is breached, more losses will follow.
How to play the Harmony (ONE) setup?
There is a massive downside risk with Harmony right now. The best thing to do as an investor is to watch the price action this week. If bulls manage to maintain the $0.11 support, then you can buy and exit at 20% gains max.
The potential upside for ONE remains significantly low. But if the support is breached, give it another week to consolidate before you buy.
On Friday, Tornado Cash announced that it was using oracle contracts from Chainalysis to block wallet addresses sanctioned by the U.S. Office of Foreign Assets Control, or OFAC. The move comes after the U.S. Department of the Treasury linked North Korean cybercriminal Lazarus Group as an alleged perpetrator for the recent $600 million+ Ronin Bridge exploit. As told by blockchain analytics firm Elliptic, the hackers have sent approximately $80.3 million worth of Ether (ETH) through Tornado Cash. “Maintaining financial privacy is essential to preserving our freedom; however, it should not come at the cost of non-compliance,” said the Tornado Cash team.
Tornado Cash is a popular cryptocurrency mixture used to obfuscate the trail of transactions for privacy. The Chainalysis Sanctions Oracle can validate if a cryptocurrency wallet address has been included in a sanctions designation from the United States, European Union or United Nations. But Tornado Cash co-founder Roman Semenov later clarified that the instrument only blocks access to the decentralized application, or DApp, interface and not the underlying smart contract.
However, it appears that Semenov has had enough of the protocol’s association with alleged illicit activities, discussing the potential consequence of jail time for noncompliance with regulators in blocking access to blacklisted individuals.
Now do the “Jailed” list for ones that are not bending backwards to be compliant
— Roman Semenov in Dubai️ (@semenov_roman_) April 15, 2022