Bitcoin (BTC) remains closely correlated with the S&P 500 but the institutional investors do not seem to be waiting for a turnaround in the United States’ equities market or decoupling to happen before buying more Bitcoin.
MicroStrategy, the publicly listed company, which is the largest single-wallet holder of Bitcoin, does not seem to be content with its stash of 129,219 Bitcoin. In a letter to shareholders, the firm’s CEO Michael Saylor said that the company aims to “vigorously pursue” and “increase awareness” about its Bitcoin strategy.
Another entity that has been at the forefront of Bitcoin purchases in the past few days has been the Luna Foundation Guard (LFG), a nonprofit organization attached to Terra, which owns 42,530 Bitcoin. LFG was recently gifted $820 million worth of LUNA tokens by Terraform Labs, which some believe may be used to buy more Bitcoin.
Do the huge BTC outflows from a pro-trader crypto exchange suggest that a bottom may be close by? Let’s study the charts of the top-10 cryptocurrencies to find out.
BTC/USDT
Bitcoin’s recovery fizzled out at $41,561 on April 13, indicating that higher levels continue to trigger selling. The buyers are currently attempting to defend the psychological level at $40,000.
BTC/USDT daily chart. Source: TradingView
The 20-day exponential moving average (EMA) ($42,419) is sloping down and the relative strength index (RSI) is in the negative territory, indicating that the path of least resistance is to the downside.
If the price plummets below $39,200, the selling could intensify and the BTC/USDT pair could drop to the support line of the ascending channel. The bulls are likely to defend this level aggressively.
Contrary to this assumption, if the price turns up and breaks above the 20-day EMA, it will suggest accumulation at lower levels. The bulls will then attempt to push the pair to $45,400.
ETH/USDT
Ether (ETH) has been sandwiched between the 20-day EMA ($3,144) and the 50-day simple moving average (SMA) ($2,975) for the past three days. This suggests that bulls are defending the 50-day SMA while bears are selling on rallies to the 20-day EMA.
ETH/USDT daily chart. Source: TradingView
If the price breaks and sustains below $2,950, the selling could accelerate and the ETH/USDT pair could drop to $2,817. This level might act as a support but if it cracks, the next stop could be the uptrend line.
Conversely, if the price rebounds off the current level and rises above the 20-day EMA, the pair could rally to the overhead zone between the 200-day SMA ($3,491) and $3,600. This is an important zone to watch out for because a break and close above it could signal the start of a new up-move.
BNB/USDT
BNB broke above the 20-day EMA ($420) on April 13 but the bulls could not build upon this advantage. The bears pulled the price back below the 20-day EMA on April 14 but a minor positive is that the bulls have not given up much ground.
BNB/USDT daily chart. Source: TradingView
The flattish 20-day EMA and the RSI near the midpoint indicate a possible range-bound action in the near term. If the price rises above $427, the bulls will try to push the BNB/USDT pair to the 200-day SMA ($420) where the bears are expected to mount strong resistance.
Contrary to this assumption, if the price turns down from the current level, the bears will try to sink the pair below $391. If they succeed, the decline could extend to the strong support at $350. The buyers are likely to defend this level with vigor.
XRP/USDT
Ripple’s (XRP) rebound picked up momentum and reached the 50-day SMA ($0.78) on April 15. If the price sustains above the 50-day SMA, the next stop could be the strong resistance at $0.91.
XRP/USDT daily chart. Source: TradingView
The 20-day EMA ($0.77) is flattening out and the RSI is near the midpoint, indicating range-bound action in the near term. The XRP/USDT pair could remain stuck between $0.69 and $0.91 for the next few days.
Contrary to this assumption, if the price turns down from the 50-day SMA, it will suggest that bears are selling on rallies. The pair could then drop to the critical level at $0.69. A break and close below this support could pull the pair down to $0.62.
SOL/USDT
Solana (SOL) has been stuck between the 20-day EMA ($108) and the 50-day SMA ($100) for the past three days but this tight-range trading is unlikely to continue for long.
SOL/USDT daily chart. Source: TradingView
If bears sink and sustain the price below the 50-day SMA, the selling could pick up momentum. The SOL/USDT pair could then decline to $86. The downsloping 20-day EMA and the RSI in the negative zone indicate advantage to sellers.
On the other hand, if the price rebounds off the 50-day SMA, the bulls will try to push the pair above the 20-day EMA. If they succeed, it will suggest that the correction may be over. The pair has a chance to then rise to $122 and later attempt a rally to the 200-day SMA ($148).
ADA/USDT
Cardano (ADA) has been trading inside a tight range between $0.91 and $1 for the past three days. This suggests uncertainty about the next directional move.
ADA/USDT daily chart. Source: TradingView
The downsloping 20-day EMA ($1) and the RSI in the negative territory indicate that bears are in command. If the tight range resolves to the downside, the ADA/USDT pair could extend its decline to $0.86 and later to the critical support at $0.74.
Contrary to this assumption, if the price turns up from the current level and breaks above the 20-day EMA, the pair could rise to $1.10. A break and close above this minor resistance could open the doors for a possible retest of $1.26. The buyers will have to overcome this barrier to signal a potential change in trend.
LUNA/USDT
Terra’s LUNA token turned down from $90 and broke below the support at $80 on April 14, indicating that bears are selling on every minor rally. The bears will now try to pull the price down to $75.
LUNA/USDT daily chart. Source: TradingView
The 20-day EMA ($94) and the 50-day SMA ($93) are about to complete a bearish crossover and the RSI is in the negative territory, indicating that bears have the upper hand. A break and close below $75 could sink the LUNA/USDT pair to the 200-day SMA ($66). The bulls are expected to defend this level with all their might.
Alternatively, if the price turns up from the current level and breaks above the 20-day EMA, it will suggest that the bears may be losing their grip. The pair could then attempt to rise above the psychological level at $100.
Avalanche’s (AVAX) bounce off the uptrend line could not rise above the moving averages, indicating that the bears are active at higher levels. The price is currently stuck between the moving averages and the uptrend line.
AVAX/USDT daily chart. Source: TradingView
This tight-range trading is unlikely to continue for long. The downsloping 20-day EMA ($83) and the RSI below 40 suggest that the bears have a slight edge. If the price turns down and breaks below the uptrend line, the selling could pick up momentum. The AVAX/USDT pair could then drop to the next support at $65.
On the contrary, if the price bounces off the uptrend line with strength, the buyers will try to push the pair above the moving averages. If they succeed, the pair could rise to $90 and later to $93.
DOGE/USDT
After two failed attempts to close above the 20-day EMA ($0.14) on April 12 and 13, the bulls managed to conquer the level on April 14. The buyers will now try to push Dogecoin (DOGE) to $0.16 and then to the 200-day SMA ($0.18).
DOGE/USDT daily chart. Source: TradingView
The bears are likely to defend the 200-day SMA. If the price turns down from this resistance, it will suggest that the DOGE/USDT pair could remain stuck between the 50-day SMA ($0.13) and the 200-day SMA for a few days. The flat 20-day EMA and the RSI just above the midpoint also suggest a consolidation in the near term.
This view will be invalidated in the short term if the price turns down from the current level or the overhead resistance and plummets below the 50-day SMA. That could pull the pair down to $0.12.
DOT/USDT
The recovery attempt in Polkadot (DOT) lacks strength, indicating that demand dries up at higher levels. This increases the likelihood of the continuation of the correction.
DOT/USDT daily chart. Source: TradingView
The downsloping 20-day EMA ($19) and the RSI in the negative zone indicate that bears have the upper hand. If the price turns down from the current level and breaks below $17, the decline could extend to $16. This level is likely to attract strong buying.
If the price rebounds off $16, the buyers will make another attempt to clear the overhead resistance at $19. If they succeed, it will suggest that the correction may be over. The DOT/USDT pair may then consolidate between $23 and $16 for some time.
Alternatively, if the price breaks below $16, the next stop should be the critical support at $14.
The views and opinions expressed here are solely those of the author and do not necessarily reflect the views of Cointelegraph.com. Every investment and trading move involves risk, you should conduct your own research when making a decision.
An insider account of the DeSci origins story — a new movement of citizen scientists, open-access scientific research and crowd-sourced peer-review funded by crypto that’s gathering pace in 2022.
#
At ETHDenver in February, decentralized science became a thing. It was like the good old days of crypto: Like-minded spirits met and then crashed at each other’s rented places. Ideologies and open research were respectfully debated. DeSci panels were well attended with renewed energy for figuring out hard problems. Heated discussions were had. Many committed themselves to decentralized science, whatever that would mean. DeSci is, of course, very new and untested.
This could well be the first insider account of the DeSci origin story. Think Peter Parker citizen scientists funded by crypto.
Decentralized science?
Research is hard and problematically peer-reviewed. Commercializing science and tech is complex and often not profitable. Intellectual property protection is time-consuming. So, scientific research isn’t rife with speculators, rent-seekers and low-hanging fruit like other parts of Cryptoland.
The newly coined DeSci is about championing true decentralization, rejecting institutional influence (read big pharma, and the peer review system) and encouraging citizen science in pursuit of truth.
COVID-19 has spurred its development. The speed at which multiple COVID-19 vaccines and endless studies were delivered was a pivotal moment. If COVID-19 research could be produced that quickly, why couldn’t decentralized movements do it too?
Could crypto, tokenomics and decentralized autonomous organizations play a role in new models of research and commercialization?
This is a story of a band of committed activists who want to make that happen, one of whom is Erik Van Winkle who grew up wanting to be a scientist, had a core role at ConstitutionDAO, and has now found his sweet spot as a community organizer forDeSci Labs — a project working on new technologies to improve the accessibility, reliability, transparency, and value sharing of scientific publications, as well as the DeSci Foundation.
He says the mission is broadly Can we make science more efficient? and while it won’t happen overnight, it will happen:
“DeSci is possible — it just has a long road ahead of it. Blockchain took time; DeFi took time. DeSci will get there.”
He adds it’s already attracting some of the best minds.
“People are excited to be there; they are excited by the mission. Attracting developers is very hard. This is an area that has a good story behind it.”
Building upon existing science
According to a recent article by Sarah Hamburg, co-founder of Web3 advisory Phas3 and blockchain-based biometric data company Lynx, DeSci lies at the intersection of two broader trends. “1) Efforts within the scientific community to change how research is funded and knowledge is shared, and 2) efforts within the crypto-focused movement to shift ownership and value away from industry intermediaries.”
DeSci communities are expected to be largely made up of those already involved in both crypto and science. How they interact with the wider scientific community is key.
Most DeSci advocates are keen to respect existing research communities while harmoniously building new ones. This reflects an important slogan for the DeSci movement, best summed up by Hamburg in a letter to Nature encouraging scientists across all disciplines to join DeSci. Don’t work against us — join us.
The DeSci Foundation is one of the leading organizations in this new sector. Source: DeSci Foundation
Hippocratic Oath for DeSci?
Josh Bate has become a high-profile figure in the burgeoning DeSci space. A community organizer with high visibility, he agrees ETHDenver was a catalyst for DeSci.
Bate, “a DeFi guy” who was once the head of community for the Free Julian Assange campaign and began in crypto “by using Bitcoin just for buying things on the dark web.” He’s pretty forthright when he talks. How did he earn his position of visibility in the community? Just “put myself about,” he says.
Bate founded and funds DeSci World, a “peer-to-peer research platform, and a DeSci aggregator of info.” It aims to create a dashboard akin to DeFi Pulse for DeSci.
He also believes DeFi practices are crucial to DeSci business models, but DeSci needs more than “Web3 tooling to improve on the current state of affairs.”
He tells Magazine that he fears a “dark DeSci and a regular DeSci,” so he’s been campaigning for a Hippocratic Oath for DeSci. He made the case at a talk at ETHDenver:
“It’s so early, but we can choose a Hippocratic Oath for DeSci now — no institutional finance, just pure science.” He asked the crowd for a show of hands on whether “DeSci should have an explicitly stated ideology” and estimates that maybe 5% voted “no,” 20% “yes,” and the rest were too confused by the many variables and held out to see the outcome.
How to peer review as a decentralized public good
Let’s jump back a step to consider the complexproblems with existing research models.
There’s a need to improve:
Research funding
Open access to research
Overhaul the academic peer-review process.
Of course, there’s no proof that grafting crypto onto this process is the best way to improve it. Is creating a coin around a research project a good way to fund it? What do holders of that token get out of it? Is it more out of altruism than a financial return?
LabDAO is an open community of wet and dry labs for citizen science. Founder Niklas Rindtorff tells Magazine that “tokenomics can’t directly change research.”
“But tokenomics can generate new mechanism design and incentives. In a time where most academic research is following the same set of incentives, I am hopeful new funding agencies and tokenomics models can help diversify the ways research is being done.”
Artists impression of the DeSci Future.
1. Crowdsourcing research funding
Funding is the bane of scientists’ existence, and the process does not always reward merit. Scientists waste a lot of time writing grants applications. Hamburg wrote:
“Funding is an especially acute pain point for scientists, who spend up to half their time writing grant proposals. Success in getting funding is heavily tied to metrics such as the h-index, which quantifies the impact of a scientist’s published work. The resulting pressure to ‘publish or perish’ incentivizes the pursuit of novel research over work that’s critical but less likely to grab headlines. Ultimately, inadequate and unreliable funding not only reduces the amount of science being done, but also biases which projects scientists choose, contributing to issues such as the replication crisis.”
The replication crisis means that the results of perhaps more than 50% of published studies cannot be replicated by other scientists carrying out the same experiments or research.
DeSci can help mobilize those most affected and motivated to contribute to research to help improve their lives.
DeSci proponents argue that funding gatekeepers hinder scientific progress. Hamburg, a neuroscientist who has researched innovative ways of treating Alzheimer’s by using light known as entrainment, explains to Magazine that “funding bodies are too slow for innovative therapeutics.” She was building a phone app for entrainment treatments but ran out of funding. She still believes the trial would have proved fruitful for treating Alzheimer’s.
In addition, traditional funding mechanisms aren’t great for new and different research approaches. “For example, DeSci will unleash the growth of digital therapeutics [wearable biometric devices], which will enable large numbers of people across many different locations to participate in digital-based studies and pool their data,” she argues. DeSci trials could be done with fewer biases and better-pooled data on a blockchain.
Like the open-source nature of AI research, Hamburg suggests that “medicine of the future will be algorithms in one way or another. Pooled data will be very important for generating new insights.”
That’s the vision. The question is whether the decentralized science movement has the capabilities to better decide what should orshouldn’t be funded.
How do you conduct peer-reviewed research and collaborate with the harmoniously scientific community? Will DeSci crowdsource both the funding and the peer review, or does it just fund the research and get out of the way? For now, experimentation may be the only option.
SCINET.io co-founder Kaitlin Cauchon believes DeSci’s success is inevitable because the current academic funding model is broken.
“How to get scientists on board the DeSci train? Democratize funding. Funding is the biggest centralization of science.”
SCINET is an early-stage project that is currently focused on building a decentralized crowdfunding platform for life sciences research. Once done, they will turn their attention to an “electronic lab notebook built on on-chain”, according to Cauchon. Open access and replicability are the problems they seek to solve
DeSci events are now highly visible in 2022, and female representation is unusually strong for Cryptoland.
2. Open access for citizen science
Information access is another big problem for science today, Hamburg noted in her article. “Despite the fact that science is the epitome of a global public good, a lot of scientific knowledge is trapped behind journal paywalls and inside private databases. Making all types of data more accessible is the main objective of the Open Science movement, which emerged over a decade ago.”
Peer review is slow and anonymous, and this can lead to “turf wars” as journals are gatekeepers of knowledge. (FYI, see this 2018review of the peer review system.) Two major players are Clarivate and Elsevier, who are the Web2 equivalents of academic research. Scientific journals are an oligopoly of for-profit companies. Articles are protected by copyright.
Thetwo leading business models of journal publication companies are “pay-for-access” and “pay-for-publication.” Even for independent observers, this does seem like a perversion of incentives.
In recent years, preprint platformsArxiv, bioRxiv, medRxiv and SSRN have allowed academics to post early versions of their manuscripts online and have emerged and found favor. However, this is prior to the peer review process, and academics may not divulge key findings at this stage
The problem is clear: paywalled science. And the benefits of fixing the problem are even starker.
Citizen science
Hamburg, who has had a chronic pain condition called fibromyalgia since she was 19 and long COVID over the past two years, believes that by making research more available, DeSci can crowdsource ordinary people working together to help solve problems, especially those affected by an illness who are the most motivated.
“With many chronic conditions, there’s a strong ‘biohacker’ mentality that emerges, as people are left to track flare-ups and the impact of interventions themselves, with inadequate know-how and tools to do so. There is very little crossover (if any) between these ‘citizen science’ experiments and traditional science and medicine, so insights are missed, and many illnesses remain under-researched despite the millions they impact worldwide.”
DeSci Labs plans to store research on ledgers and to “chip away at the reproducibility crisis.”
DeSci Labs is working to create a ledger of scientific records that stores and validates manuscripts, data and code in a transparent way that is accessible to everyone. “Making science truly open involves transforming science from solitary PDFs into dynamic research objects. We plan to showcase our first product, DeSci Nodes, at the DeSci Day on April 20 in Amsterdam to demonstrate how a pre-print can be turned into a reproducible research object stored on IPFS containing data, code and video to evidence work and chip away at the reproducibility crisis,” Van Winkle tells Magazine.
One innovative approach that might improve open access is being taken by the Smart Contract Research Forum. It’s a community for industry and researchers to share research and peer reviews that is “decoupling review from publication.”
Operations leader Eugene Leventhal tells Magazine, “Today, peer review is only available for those vying for those coveted journals and conferences. The majority of the Web3 space, with the exception of the underlying cryptographic primitives, has mostly been built outside of academia, and most researchers publish more on their blogs and Twitter than in traditional venues.”
“That’s why we think it’s important to start a series of open peer review experiments supporting independent researchers in the space, and we’re starting to coordinate with meta-science researchers to ensure that we’re not re-inventing the wheel with our experimentation.”
They will announce their plans for 2022 at ETHAmsterdam on April 20.
So, more open and pooled data is one key to more research from concerned citizens. But should tokenomics mean that reproduction of data sets along with all research data is incentivized?
3. Overhaul the academic peer review process
Patrick Joyce worked at a tumor biology lab at the famed Johns Hopkins University. He also dropped out of med school and a Ph.D. program working on molecular biology.
He’s far from the only person who tells me that “good science isn’t always super citable. This creates weird perverse incentives driven by money flowing from citations.” He adds, “Higher prestige journals lead to better citations. But paywalls mean the world can’t benefit in real-time.”
In 2016, before Joyce discovered crypto, he decided to build a Reddit-like platform for science called Knowledgr. Coinbase founder Brian Armstrong invested in his company, but the project soon sputtered out. Joyce then joined Armstrong’sResearchHub — a sort-of GitHub for science, with utility behind the paper — in 2020 as chief science officer.
ResearchHub is a good example of where DeSci may be heading. ResearchHub has hired 60 editors, he says, people who “are qualified to review scientific papers.” It’s really an economies-of-scale issue, enough editors and support, and the reviews will be almost universally respected. It’s currently on the hunt for preprints or draft research manuscripts to receive peer reviews.
ResearchHub isn’t trying to conduct research, but to create a platform for independent science. The editors are paid in ResearchCoin, which “essentially equates to governance rights on the platform.”
“Like open source, we hope to tear down the Ivory tower so a barefoot biochemist in Yugoslavia can unlock clever science.”
They recently added digital object identifier (DOI) citations to papers to help integrate ResearchHub with existing research models. DOIs aid researchers to find original references.
Joyce says the project started as a pure DAO, but that didn’t work out. It “is still kind of a DAO but more CEO-run. It’s hard to organize people. We had to carefully delineate what the DAOs should decide. For example, ‘should we ban a eugenics hub?’ that question goes to the DAO.”
But he adds in DeSci, “Now there’s an expectation that you’re a DAO.”
In the wake of ETHDenver, new DeSci DAOs have been emerging almost weekly.
The fledglingstdDAO’s mission is to fund sexually transmitted disease research in the hopes of finding cures. The founders are crypto people “remaining anonymous, as everyone in the DAO has personally contracted an STD — all of them know someone who has a more serious STD.” Founder CarmenCrypto says they seek to get access to the industry outside of big pharma. They are looking for “cures, and not just another side effect treatment, which are what is only available on the market today.” They plan to first focus on STDs, such as “herpes simplex types 1 (cold sores) and 2 (genital) and to further gene editing and stem cell research.”
“We run the business, the DAO; outside specialists will help us with the research. The DAO can be cross-border, can move funds, can cut across projects.”
They have in-kind goodwill from lawyers, finance pros and charities all willing to help (and everyone “has crypto skills”).
Being an anonymous DAO is well suited to the cause of No one is shamed by saying they have cancer, but, unfortunately, they still are when it comes to STDs.
Side-stepping United States clinical trial regulations, they want to fund research “wherever scientists and researchers may be.”
They are also looking to capitalize on existing open research. CarmenCrypto says the DAO is “looking for highly knowledgeable professionals, such as doctors, scientists, researchers, philanthropists and entrepreneurs, to help provide insight to our community on innovative medical techniques with a high potential to cure STDs that stdDAO should fund.”
It’s very new, and very experimental. Are decentralized clinical trials even possible, or ethical? It’s so early that tokenomics design is still a vague high-level discussion.
Ok how about: It’s a DAO. The scientists do science. The DAO owns all the data, algos & IP generated – all tokenised (@oceanprotocol) & tied to a DAO token. Giving the tokens value. Scientists are paid in these tokens. Token value is inherently ⬆️ by teaching & collab. Thoughts? https://t.co/Od21X1f2tf
— Sarah Hamburg PhD (@Shamburgularara) April 3, 2022
Tokenized science is still evolving
Despite the enthusiasm, the path to tokenizing science may be slow, says DeSci Labs co-founder Professor Philipp Koellinger, adding:
“It’s too early for a tokenomics model of science. Most scientists are risk-averse and not familiar with Web3 yet. Tokenomic models for DeSci must be very well thought through and, ideally, developed together with and tested by the scientific community to gain widespread adoption and acceptance. It is glaringly obvious to most scientists that the current incentive system is misaligned with the purpose of science. The possibility for incentive design is one of the most powerful features of Web3 technologies. If done well, it could solve a lot of problems in science. Give it some time.”
DeSci Labs believes that a decentralized peer review system can be achieved by “autonomous research communities of the best researchers in every field, who are incentivized and rewarded for providing open, timely, and high-quality peer review and who select the most important contributions to be highlighted in a transparent way.”
This would be a dramatic improvement on the current practice of closed-door peer reviews of journals that rely on unpaid time of scientists, which is haunted by collusion, gate-keeping and bias.
DeSci’s breakout moment in Amsterdam?
Renee Davis is another who was inspired by ETHDenver. She asked Ethereum co-founder Vitalik Buterin at the event what the top five research problems were facing DeSci. “Of the five Buterin stated, four of them are already being worked on by the community,” she says, listing onboarding, governance protocols, token distribution and decentralized identity systems.
“I’m so glad I went to ETHDenver,” she says, adding, “My ROI was massive from bonding with the DeSci community.”
She quit Deloitte consulting to join BanklessDAO and then founded the Journal of Decentralized Work, an open-source journal for the study of DAOs and delegated tokenomic research and TalentDAO. “TalentDAO is trying to create a new science of DAOs, helping to make sure DAOs don’t fail.” It has partnered with Arweave and Ocean Protocol.
At ETHAmsterdam, part of Devconnect Amsterdam,DeSci Day will take place on April 20. It’ll give the community a chance to see how far DeSci has progressed since ETHDenver in February. Davis, for one, thinks it’s progressing in leaps and bounds, and the sky is the limit.
“Crypto disrupted finance; NFTs disrupted culture; and DeSCi will disrupt knowledge in the next 12–24 months.”
Cardano (ADA) price risks undergoing a severe correction in the next few months despite touting its blockchain network’s bolstering growth and a “major” hard fork event in June.
Descending channel hints at ADA selloff ahead
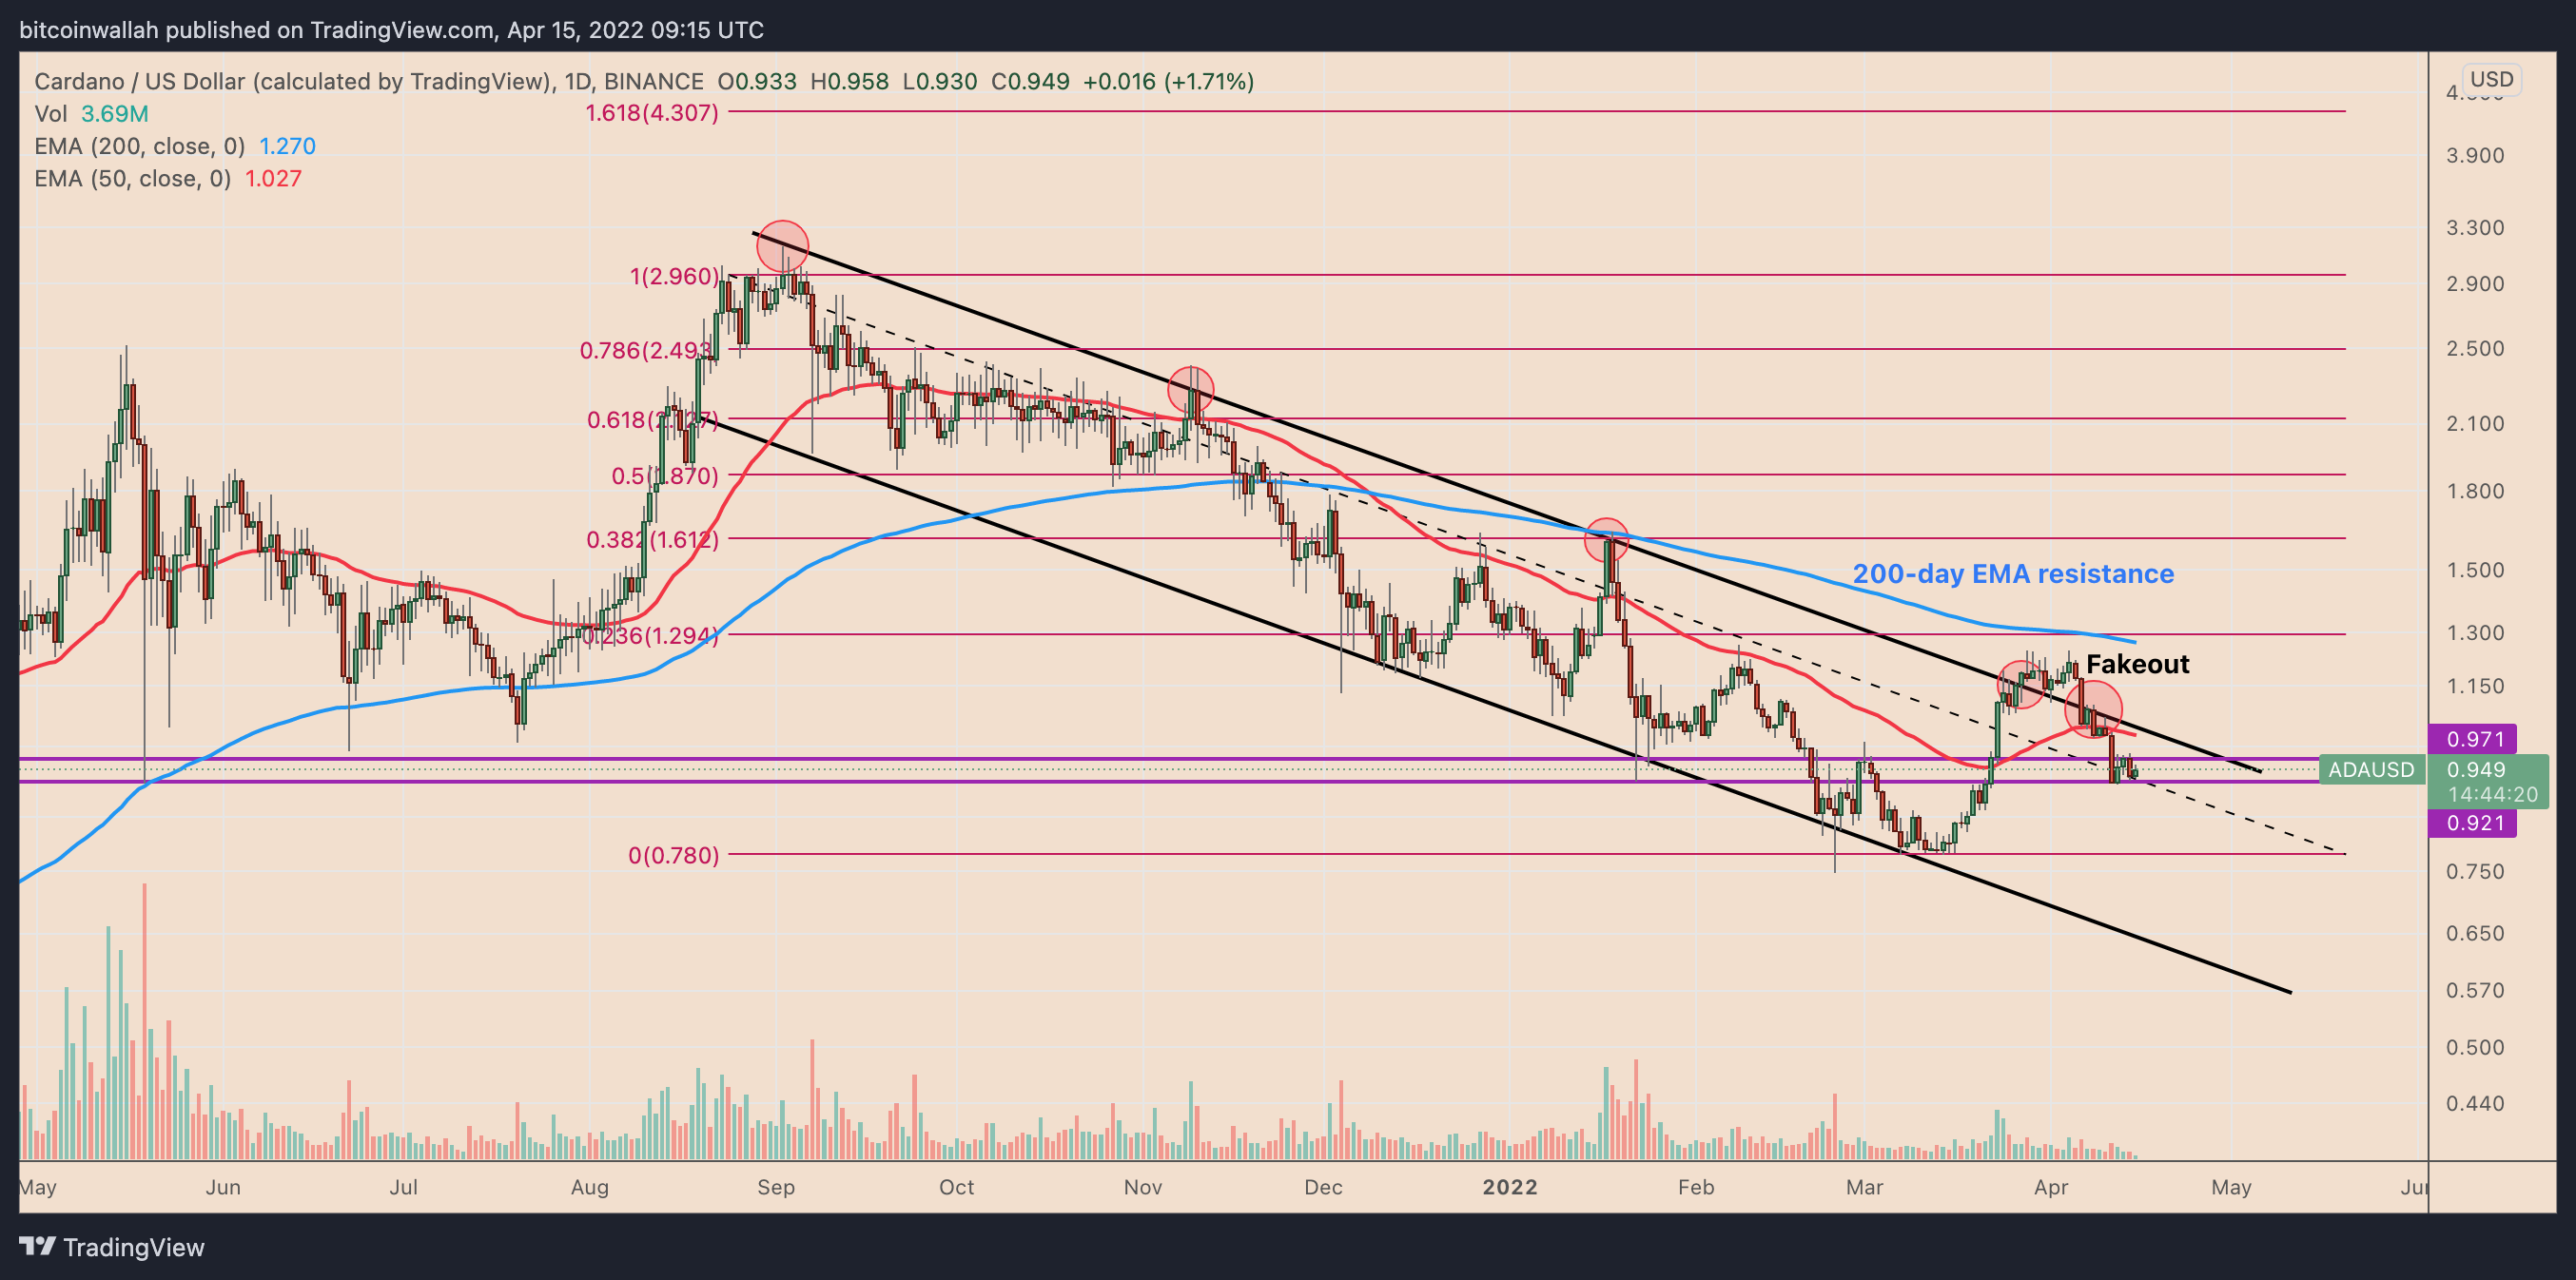
ADA, which makes up about 1.75% of the total crypto market capitalization, has been trending lower since September 2021, inside a “descending channel” pattern that has successfully capped its multiple upside attempts, as illustrated in the chart below.
The channel showed further strength as ADA broke above its upper trendline on March 27, only to reverse entirely in later sessions, showing a lack of conviction among the Cardano bulls.
ADA’s 200-day exponential moving average (200-day EMA; the blue wave), alongside the 0.236 Fib line (near $1.29) of the Fibonacci retracement graph, drawn from $2.96-swing high to $0.78-swing low, further aided the bearish bias.
As of April 15, ADA’s price consolidates inside the $0.97-$0.92 range, signaling intentions to continue its pullback from its fakeout top near $1.25.
If the descending channel setup continues panning out, ADA/USD could fall to its previous bottom range near $0.78 while eyeing the channel’s lower trendline around $0.65 as its primary downside target.
ADA/USD daily price chart. Source: TradingView
That amounts to an almost 30% drop from today’s price.
Cardano network growth fails to impress traders
Meanwhile, Input Output Hong Kong (IOHK), the research and development firm behind the Cardano project, has announced incredible network growth entering April 2022.
Stablecoins, sidechains, NFTs & partnerships, launchpads & project launches, converter bridges…getting overwhelmed with all the news from the #Cardano universe?
We’ve gathered a structured recap of the key updates over the last 10 days.
IOHK also appears to be readying the “Vasil” hard fork, a network upgrade to make Cardano’s blockchain more scalable, sometime in June.
Cardano founder Charles Hoskinson stressed the word “major” five times when describing the fork’s importance to the overall network growth in a video released April 12, a day after ADA crashed more than 10%.
Yes, ADA’s price recovered after Hoskinson’s address and IOHK’s tweets. But the rebound lost momentum and is trending sideways, remaining under the influence of macro factors.
The daily correlation coefficient between ADA/USD and NDX. Source: TradingView
Notably, like Bitcoin, ADA’s correlation with the Nasdaq-100 (NDX) rose to a record level, hitting 0.97 on April 15 versus.0.79 at the beginning of the year.
In other words, ADA price is currently in lockstep with the tech-heavy index, which has erased more than $1 trillion from its market cap in April.
The views and opinions expressed here are solely those of the author and do not necessarily reflect the views of Cointelegraph.com. Every investment and trading move involves risk, you should conduct your own research when making a decision.
Robinhood CEO Vladimir Tenev took to Twitter on Thursday afternoon to explain how Dogecoin could become the “future currency of the internet.”
In a thread of 12 posts to his nearly 200,000 followers, Tenev outlined what steps need to be taken to transform the memecoin into a usable asset for everyday payments and transactions on the internet.
Can #Doge truly be the future currency of the Internet and the people? As we added the ability to send/receive DOGE on Robinhood, I’ve been thinking about what that would take.
Tenev began by drawing attention to the fact that Dogecoin’s transaction fees — roughly $0.003 per transaction — are already small enough to place the altcoin as a feasible e-cash frontrunner.
He believes the block size and the block time of Dogecoin are the main areas that require improvement if the cryptocurrency is to become widely adopted.
Ideally, the block time (time between successive blocks being added to the chain and to verify a transaction) should be fast enough that the transaction can be recorded in the next block in less time than it takes to pay at a point of sale terminal.
Dogecoin currently has a 1MB block size and a 1 minute block time which means that Dogecoin’s total throughput stands at approximately 40 transactions per second (TPS).
In comparison, the VISA network has a throughput of approximately 65,000 TPS — meaning that DOGE would need to increase its total throughput by roughly 1,625 times in order to be on par with VISA. Tenev says that this isn’t a worry, and can be solved simply by increasing DOGE’s block size limit from 1MB to 1GB and eventually to 10GB.
Tenev finished the thread with a message to the developers of Dogecoin, urging them to focus on increasing the block size limit above all else.
This just in: Guy who loves databases wants to turn memecoin into a database. https://t.co/EzVSomnJwq
Tenev’s thread was published just three hours after Dogecoin creator Jackson Palmer took aim at former “Dogecoin CEO” Elon Musk’s planned potential hostile takeover of Twitter.
“It takes some pretty impressive mental gymnastics to associate any type of ‘freedom’ with the richest man in the world initiating a hostile takeover and forcing one of the largest public social media platforms private,” said Palmer in a tweet to his 41,000 followers.
Palmer doesn’t mince words when it comes to criticizing Musk. In mid-May last year, Palmer called Musk a “self absorbed grifter” and claimed that the billionaire’s viral performance on Saturday Night Live was “cringe, bro.”
The price of Dogecoin remains relatively unaffected by these recent events, with the token trading sideways between the $0.14 and $0.15 mark over the past seven days.
One of the biggest challenges cryptocurrency projects face is finding the right type of real-world integration and a use case that can spark a new waves of adoption.
Integrating blockchain and cryptocurrency with professional sports has been the expected “next wave” for some time and Chiliz (CHZ), a protocol focused on creating a fan engagement platform for various sports leagues, made headlines for its new developments this week.
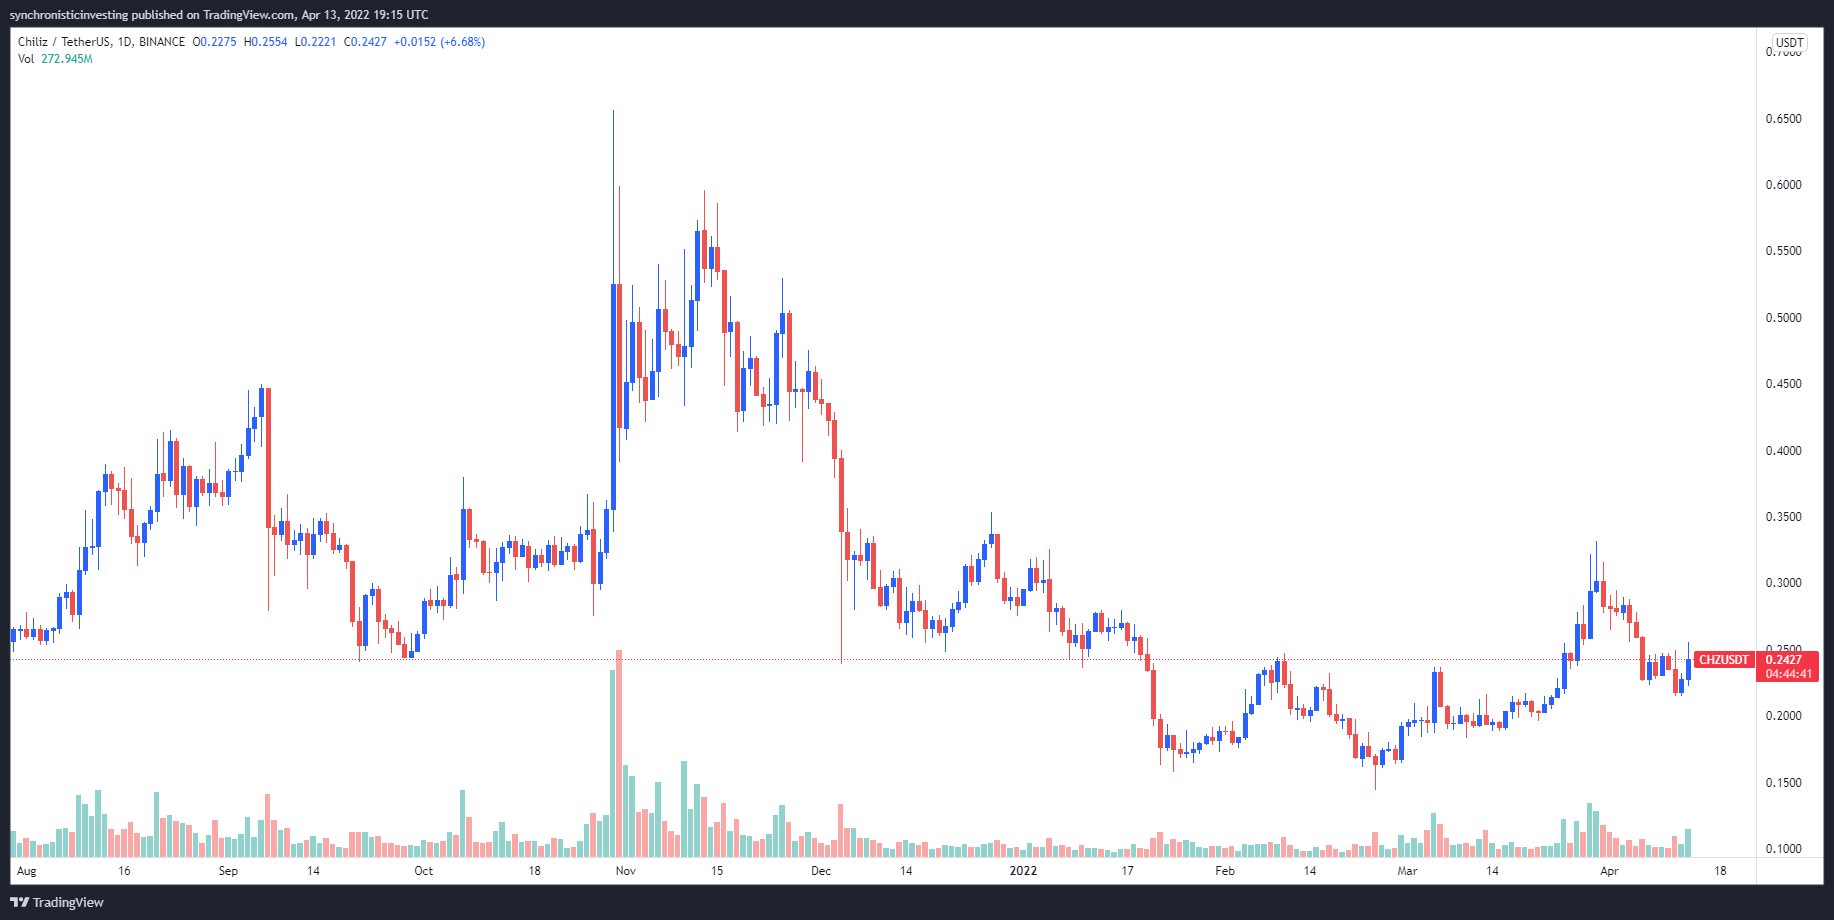
Data from Cointelegraph Markets Pro and TradingView shows that the price of CHZ has increased 69% from its 2022 low of $0.144 to hit a daily high of $0.256 on April 13.
CHZ/USDT 1-day chart. Source: TradingView
CHZ price has been building momentum and a new partnership between the Socios.com fan engagement platform and thirteen National Football League (NFL) teams, plus the success of the platform’s European Football team tokens appear to be adding to the bullish sentiment. The project also plans to host its public testnet launch of Chiliz Chain 2.0.
New NFL partnerships could spark growth
The most recent development to spark a price rally in CHZ was the April 13 announcement that the network’s Socios.com sports fan engagement platform signed multi-year marketing agreements with 13 NFL teams.
This agreement marks a significant escalation in the project’s presence in American sports leagues and the NFL in particular because it had previously only been working with the New England Patriots.
Success of the European football team tokens
Another reason for the building momentum for Chiliz has been the success of the fan tokens, which were created for a handful of European football teams.
With football being the most popular sport in Europe, Socios has focused on forming partnerships with some of the most popular teams, leagues and players to help expand its presence and attract new users.
Most recently, the platform signed a marketing partnership with Lionel Messi, making the star forward the first global ambassador for the platform.
CC2 is designed to help sports and entertainment brands introduce Web3 capabilities, including the ability to mint NFTs and fan tokens. It will also build out decentralized finance (DeFi) products and play-to-earn games, create events, and host loyalty and merchandising programs.
The new chain has adopted a proof-of-stake authority (PoSA) model, which is estimated to be up to 2,000 times more energy-efficient than proof-of-work models and it will be Ethereum Virtual Machine (EVM)-compatible but offer transaction costs that are 200 times cheaper than the Ethereum network.
VORTECS™ data from Cointelegraph Markets Pro began to detect a bullish outlook for CHZ on April 12, prior to the recent price rise.
The VORTECS™ Score, exclusive to Cointelegraph, is an algorithmic comparison of historical and current market conditions derived from a combination of data points including market sentiment, trading volume, recent price movements and Twitter activity.
VORTECS™ Score (green) vs. CHZ price. Source: Cointelegraph Markets Pro
As seen in the chart above, the VORTECS™ Score for CHZ climbed into the green zone on April 12 and hit a high of 81 around 16 hours before the NFL partnership was announced and sparked a 17.3% rally.
The views and opinions expressed here are solely those of the author and do not necessarily reflect the views of Cointelegraph.com. Every investment and trading move involves risk, you should conduct your own research when making a decision.
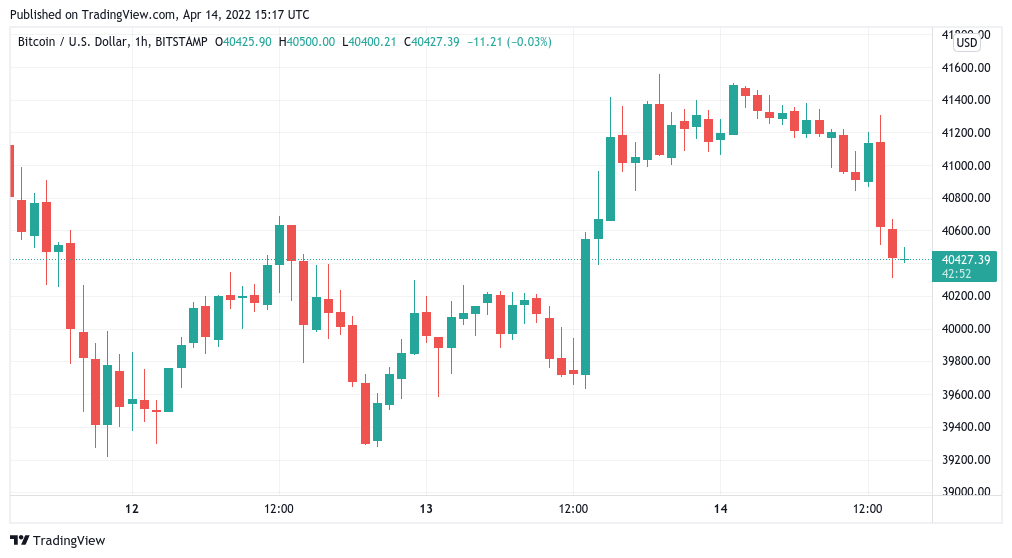
The pair had been approaching $41,600 the day prior, but momentum ran out overnight, and the largest cryptocurrency took minutes to shave almost $1,000 off its price at the opening bell.
At the time of writing, $40,000 was still in play as support but bulls had similarly failed to recoup the latest lost ground.
Traders began to favor a fresh downside once again, the mood fueled by a disappointing start for U.S. equities and Bitcoin’s implied correlation.
The S&P 500 (SPX) traded down 0.34% at the time of writing.
“The correlation coefficient for BTC vs SPX has reached very high regions of ~0.9 on a 7-week basis,” popular Twitter account CRYPTOBIRB noted.
“It shows that on average, Bitcoin has been trading like the large-cap equities and the inter-market connection is apparent. As the correlation fluctuates, inversion may be ahead.”
Short-term price performance, thus, left few impressed as traders kept their guard up in case of a deeper retracement. For Anbessa, only the sustained retention of $41,300 would alter the immediate outlook.
Hopium: – potential early parabola – inverse H&S neckline highlighted green
I don’t see this scenario playing out atm, ready to get stopped out on a bear flag breakout.
A relcaim of Kijun Sen $41,3k could change the shortterm outlook. Still LONG above bear flag support.
The latest chapter in the story of the billionaire’s involvement with Twitter came in the form of Musk asking to buy the company out or “reconsider” his 9.2% equity stake.
DOGE/USD jumped on the news, but a subsequent comedown left daily gains at just 2%.
The views and opinions expressed here are solely those of the author and do not necessarily reflect the views of Cointelegraph.com. Every investment and trading move involves risk, you should conduct your own research when making a decision.
According to a report published by Bloomberg on Thursday, Ava Labs is en route to raising a new round of funding for $350 million at a valuation of $5.25 billion. Details of the agreement have not been made public. Ava Labs is the lead developer of the Avalanche (AVAX) blockchain.
The total value locked, or TVL, on AVAX currently sits at $14.6 billion, according to data from DeFi Llama. Decentralized finance, or DeFi, borrowing and lending protocol Aave accounts for 33.72% of market share on the blockchain.
AVAX has become one of the most popular blockchains, surpassing a market cap of $21.3 billion. Since the launch of its mainnet in September 2020, the blockchain has grown to an ecosystem of approximately 450 individual projects, removed $118 million worth of AVAX from circulation through token burning, and attracted more than 1.5 million community members.
As reported by Cointelegraph last November, the Avalanche Foundation, a primary organization within the Avalanche ecosystem, launched a $200 million fund to incentivize developers to build on the network. Two months prior, in September 2021, the foundation raised $230 million through a token sale spearheaded by Polychain and Three Arrows Capital to grow its DeFi ecosystem. Back then, the blockchain’s TVL stood at $14 billion, while its infrastructure supported about 270 projects.
More recently, organizations behind algorithmic stablecoin blockchain Terra purchased a combined $200 million in AVAX for their strategic Terra USD reserves. In justifying the investment, Terra co-founder Do Kwon cited solid growth in the blockchain’s ecosystem and the loyalty of its users.
To doxx (oneself) or not to doxx? That is a question faced by many operating in the cryptocurrency and blockchain space, including developers, influencers, and investors. Does one use one’s own name when venturing into the often chaotic and largely unregulated crypto world — or don an alias?
Consider Embrik Børresen, developer of RobinHood Inu — a reflection token that was launched in February. Like many crypto and blockchain founders, he considered using a nom de guerre when starting out. But Børresen, 22, raised in a small town, had also served in the Norwegian military where he says he learned some lessons about the value of trust.
So, when it came time to launch his new coin project, he opted to use his real name. “For me, it is the moral thing — to present yourself as who you are,” he tells Magazine. Many of his peers disagree, however. “Pseudo-anonymity has been a fixture of the internet since it began, and I believe it will remain this way,” Ghostbro, a Generation Z developer for the DogeBonk project, tells Magazine. For Ghostbro (a pseudonym), revealing their true identity — or “doxxing” themselves — makes little sense.
“It would essentially put a target on my back to people who might have lost money trading DogeBonk, or wish to steal from me either online or by actually coming to my house and threatening me or my loved ones.”
They have already received threatening messages, they tell Magazine, and have been subject to some “extremely obsessive behavior from people who genuinely ‘hate’ our cryptocurrency.” They’re in no rush to make themselves “a flesh and blood figurehead these people can mess with.”
It is a debate that has been going on in at least some form since crypto’s beginning: To what extent does one really need to reveal one’s personal identity in a decentralized world? After all, one’s transactions are already on display in the form of a public key for any and all to see. Does one really need to put a bullseye on one’s chest, too? Moreover, aren’t assumed names a part of the crypto ethos going back to Bitcoin inventor Satoshi Nakamoto — who assumed an alias that has never been penetrated?
Has it gone too far?
It may seem that pseudonymity just comes with the turf in the cryptoverse. How many “influencers” on Crypto Twitter use assumed names — e.g., PlanB, Cobie, The Crypto Dog, Rekt Capital? Twitter personality Cobie is actually on their second handle — until 2021, they went as Crypto Cobain.
But pseudonymity arguably has some social and economic costs. It can provide cover to “rug pullers,” fraudsters, money launderers and other less-than-trustworthy types. This was nakedly displayed in the recent Wonderland saga where it was revealed that one of the founders of that DeFi protocol, going by the alias Sifu, was actually Michael Patryn, a convicted felon and co-founder of QuadrigaCX, the Canadian crypto exchange, whose collapse under murky circumstances led to a loss of $169 million in user funds.
While the crypto space today has become safer and more user-friendly as it approaches mainstream acceptance, many still believe that anonymous scammers run rampant.
1/ This needs to be shared @0xSifu is the Co-founder of QuadrigaCX, Michael Patryn. If you are unfamiliar that is the Canadian exchange that collapsed in 2019 after the founder Gerald Cotten disappeared with $169m
“This pseudonymous stuff is so dangerous,” Brian Nguyen, a crypto entrepreneur who lost $470,000 in what might have been a crypto “rug pull,” told CNBC.com. “They could be a good actor today, but they could turn bad in two or three years.”
It makes one wonder what they’re hiding from.
Maybe it’s time then to rethink this pseudo-anonymity thing? “If we want crypto to be taken seriously as a community, then we must start unveiling identities,” Hadar Jabotinsky, a research fellow at the Hadar Jabotinsky Center for Interdisciplinary Research of Financial Markets, Crises and Technology, tells Magazine. It is important because this remains a new, unregulated market, Jabotinsky continues. “It’s based on trust, but it is subject to rumors — so, it’s beneficial to use real names.”
Failure to supply one’s true name is traditionally a cause for suspicion, and it remains so still in many quarters. “If people must be anonymous, it makes one wonder what they’re hiding from,” University of Texas finance professor John Griffin tells Magazine. Meanwhile, Børresen adds, “If someone asks about a person, and they are unable or unwilling to answer, a lot of the time, that indicates some murkiness in what is being presented, even if it is not an outright scam.”
Yes, some project founders choose anonymity to further their fraudulent activities, acknowledges Amy Wu, a well-known venture capitalist who was recently named to head FTX Ventures — a $2-billion VC fund to invest in Web3 projects — tells Magazine, but “this is a tiny percentage of crypto founders.” Still, when they succeed — i.e., execute a scam or rug pull — “it tends to anger many inside as well as outside the community,” she says.
And then what is one to make of the Wonderland fiasco? A serial scammer who had served 18 months in a federal prison for credit card fraud, Patryn (Sifu) was serving as Wonderland’s treasurer. “The lesson is you have to assume the worst,” Aaron Lammer, DeFi specialist at Radkl, tells Magazine.
“Even if most people are well-intentioned in their anonymity, you may be masking a very bad actor.”
Part of the ethos
Asked why many crypto influencers, traders and developers post anonymously on Twitter and other social media, Lammer answers that each has their “distinct” rationale. “For developers and project founders, anonymity can be a shield against regulatory uncertainty. For traders and influencers, there may be security risks. Anonymity is part of the ethos of crypto culture, and I don’t necessarily think that people need to justify it.”
Still, as more institutional investors enter the crypto space and the deals get bigger, anonymity — if not pseudonymity — may lose some of its attractiveness. If one seeks to raise financing from a venture capital firm, it probably wouldn’t help if you go by the handle “Loves2party420,” Justin Hartzman, CEO and co-founder of Toronto-based cryptocurrency exchange CoinSmart, tells Magazine, adding:
“If you are running a multi-million-dollar protocol, it’s not wise to remain anonymous. You need to be visible to ensure that you won’t suddenly rug-pull and get away with it.”
A lot of VC firms won’t invest in a project if the founder remains anonymous, adds Wu, but there are situations where the founder chooses to be publicly anonymous — maybe to keep with the Web3’s spirit of egalitarianism — but the founder is still known by name by those within the more narrow investing community, including the enabling VC firm.
Losing credibility?
Is it even right to assume that one loses credibility when adopting an alias? Can’t one build a trustworthy brand around a nom de plume? Did it do lasting harm to Eric Blair (George Orwell), Samuel Clemens (Mark Twain), Mary Anne Evans (George Eliot), or Theodore Geisel (Dr. Seuss), to name a few? “When people’s line of work becomes wrapped up in a pseudonym, then maintaining credibility there becomes just as important as maintaining credibility with their real name,” says Ghostbro.
Moreover, in the internet age, people’s behavior isn’t always exemplary, particularly online. “The majority of my adult [survey] participants use pseudonyms on social media to avoid scorn from those who might deem their behavior ‘unacceptable,’ both within and outside of fan communities,” notes social media researcher Ysabel Gerrard.
And if pseudonyms help to promote a more democratic spirit, is that necessarily a bad thing? Decentralized project founders often want to downplay their roles, Wu tells Magazine, “They don’t want to let their personality get in the way of the community.” They often prefer to be seen as just another member in a dynamic, new community, and to this end, a pseudonym can help.
“You can still build up a reputation without revealing your identity,” Samson Mow, CEO of Pixelmatic and formerly chief strategy officer of Blockstream, tells Magazine, continuing, “and you can also accomplish and have a great impact on the world, as Satoshi Nakamoto demonstrated. Ideas and code are more important than a name and face.”
Allowed to repeat the same fraud?
On the other hand, it’s difficult to deny that some scam artists are able to hide behind anonymity in order to “repeat the same or different scams repeatedly,” Griffin adds. “A ton of this goes on in crypto.”
Meanwhile, Jabotinsky, who has studied financial failures in traditional markets, adds that anonymity can lead to all manner of market failures, given the asymmetricity of information in the crypto world. It facilitates pump-and-dump schemes, for instance, and other sorts of manipulation.
Then, too, scale matters when playing around with avatars and the like. “When you are at a certain level” — with a corporate treasury holding $1 billion, say — “it is important for you to be visible for people to know exactly who they are dealing with,” says Hartzman.
Still, viewed objectively, the amount of fraud in the crypto world is really quite small, Wu notes, and the number of really big projects — unicorns that have reached $1 billion in market value — while growing fast, are still relatively rare. These circumstances don’t really describe the everyday reality of most projects where pseudonymity might bring useful benefits for the everyday developer or founder, as well as influencers and investors.
Dealing with complaints is tiresome, after all, and investors have been known to lash out when startups falter or fail. “If you are a protocol creator working 20 hours a day, do you really want to waste time and energy dealing with these complaints and, possibly worse, death threats?” asks Hartzman.
Depending on one’s line of work, anonymity could be a wise choice, Hartzman adds. Case in point is Zachxbt, the alias of the investigator who exposed the Sifu–Wonderland deception. “A figure like that probably gets [serious] death threats,” said Hartzman. “Being anon can be a matter of life and death for someone holding that kind of information.”
Protection from regulators
Some founders, too, worry that regulators in their country of origin might come after them at some point — another reason to mask their identity. Canada’s recent executive order with regard to the Ottawa truckers got some people thinking.
“With governments, you really never can tell what’s going to happen,” Mow tells Magazine. Maintaining an alias and a low profile can “certainly help lower the chances of seizure of assets — you never know when there’ll be another Executive Order 6102. If Canada can freeze the accounts of peaceful protesters, then asset seizures in any advanced Western nation is possible.”
Even Børresen, a believer in “radical transparency,” is sympathetic toward his many peers who have elected to mask their identities. “I mainly think they are afraid of being targeted personally, either to protect themselves and their family from being targeted online or in real life.” He can even foresee doxxing himself one day. For instance:
“If RobinHood Inu really takes off, and, say, 10,000 people were aware of me as an individual, this would naturally alter how I interact online. If I was to invest in another project and attaching my name to it would affect it, then I would likely do so anonymously.”
Then, too, the blockchain world really might be a special case given the public nature of its transactions. In traditional finance, people are open about their identities, but the route that money takes is often murky, notes Børresen. Whereas, “In crypto, there is a lot of anonymity of individuals, but every transaction is traceable.”
Ghostbro believes that many people in the sector will continue to maintain a Chinese wall between their online persona and their IRL (in real life) persona, while Lammer goes even further: Pseudonymity isn’t just situational — it is the wave of the future. “Crypto is probably ahead of the curve, and more of the world will operate anonymously in the future.”
Hartzman differs. It’s more likely that a convergence is taking place. “Times have changed,” he tells Magazine. “As things stand, crypto businesses need to work hand-in-hand with regulators to ensure consistent and sustainable, widespread adoption.”
“Visibility is the cornerstone of accountability,” Hartzman concludes, while Børresen, for his part, adds that as decentralized finance becomes more readily available, widespread and accepted, “the perceived need for anonymity will likely lessen.”
Then again, some things don’t really change. Identities and reputation have mattered throughout human history, and as Griffin notes, “People typically want to know who they’re dealing with.” They value relationships, too, and “it’s hard to have a deep relationship when people are anonymous.”
Meanwhile, the blockchain and cryptocurrency industry is maturing, becoming more regulated, and attracting more users from outside the tech community who may not understand some of its more colorful traditions. Also, as more large corporations and institutional investors enter the space, some with fiduciary responsibilities, it might be only inevitable that the sector’s love affair with avatars and assumed names wanes.
Rappi, the most popular delivery service in Latin America, is working with Bitso and Bitpay to accept Bitcoin (BTC) and other cryptocurrency payments.
Asreported by Cointelegraph Brazil, Rappi is integrating with Bitso and Bitpay through a trial project in Mexico. However, it’s unclear whether the pilot plan will also enable access to the service in Brazil and other Latin American countries.
In Mexico, Rappi, a Colombian delivery app with operations in nine Latin American countries, has launched a crypto payments pilot program. Customers will be able to convert crypto into credits that can subsequently be used to complete purchases on Rappi’s platform.
Sebastián Mejia, the co-founder and president of Rappi, noted that cryptocurrencies will not be accepted directly by the app at this first stage. Mexico’s Rappi users will be able to pay for credits with cryptocurrencies. They may then use their credits on any items and services available through the app.
However, according to the institution’s president, Rappi’s plans with cryptocurrencies are much more ambitious. In addition, other integrations should be made public in the future. He noted that:
“In this first phase, we decided to build a product that allows our consumers to connect their digital wallets and exchange accounts to convert cryptocurrencies into Rappi credits and thus access all the products available within the platform.”
The Latin America region has been a hotbed of activity for Bitcoin and cryptocurrency adoption. According to a recent study, 75 percent of investors in Asia-Pacific and Latin American emerging markets are seeking to expand their cryptocurrency investments. In September 2021, El Salvador officially became the first nation to recognize Bitcoin as a legal currency.
Cassio Gusson from Cointelegraph Brazil contributed to developing this story.
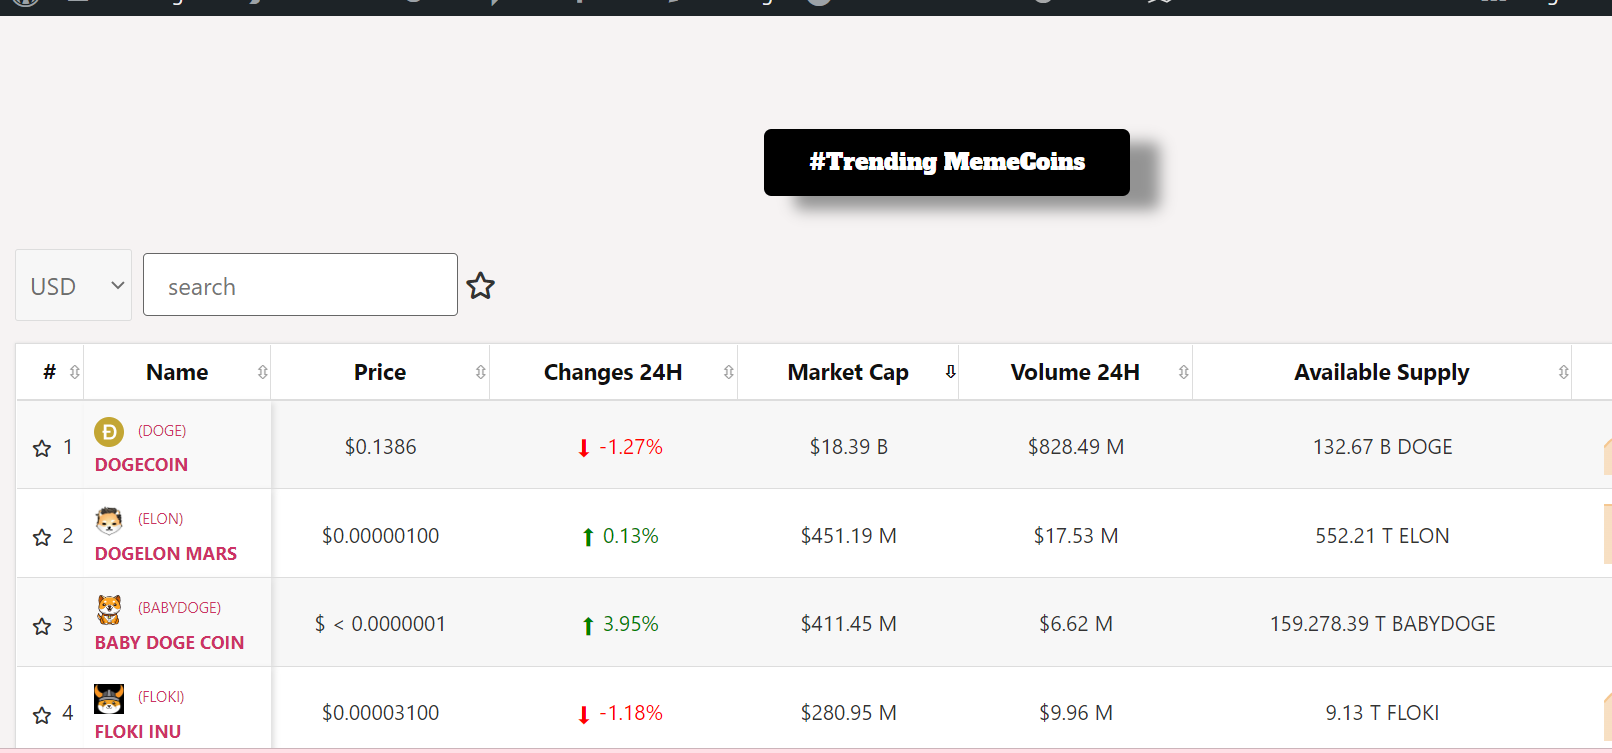
Babydogecoin trending top 3 with mighty reversal coming
babydoge is trending top 3 on bitcoinlfg app and web with mighty reversal indication by the development team of the token check where babydoge is trending https://bitcoinlfg.com