Bitcoin (BTC) is the collateral asset of choice for the world’s biggest decentralized stablecoin, and one of its top executives says there was no other.
Speaking to Bloomberg on April 4, Do Kwon, co-founder of Blockchain protocol Terra, pledged to continue buying BTC to back the firm’s stablecoin, TerraUSD (UST).
Kwon: BTC buys will continue “in perpetuity”
Terra has made waves inside and outside the crypto community in recent weeks thanks to its massive Bitcoin buys.
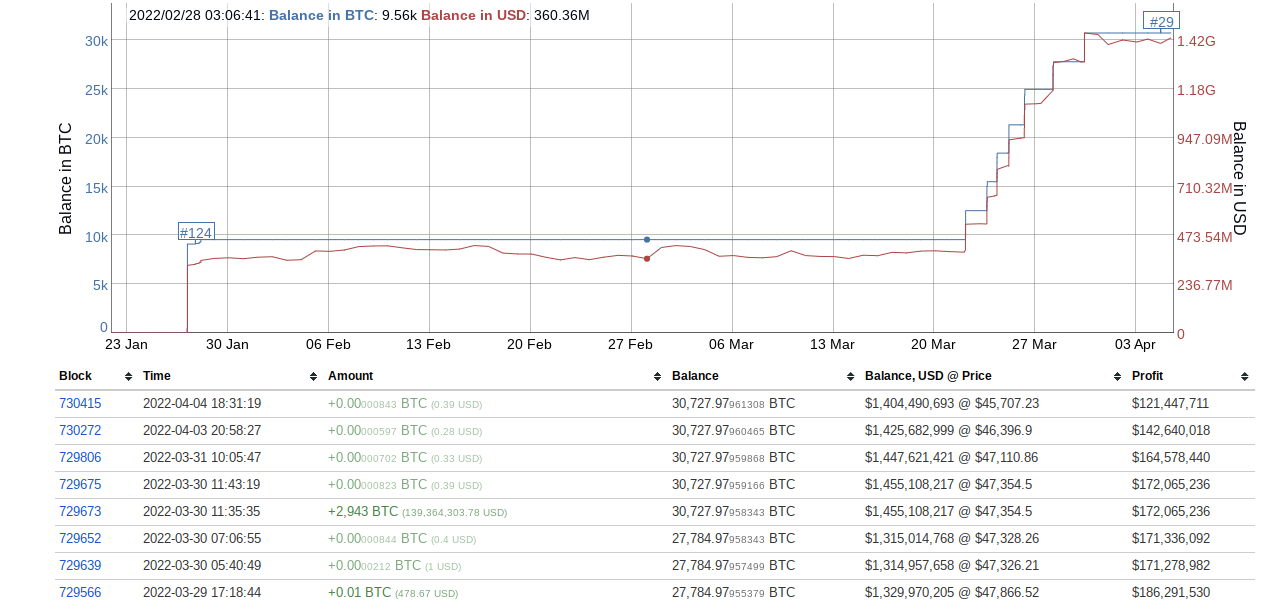
Currently at just over 30,000 BTC, the reserves of Terra nonprofit the Luna Foundation Guard (LFG) are due to expand to the equivalent of $10 billion.
In his latest comments, however, Kwon went even further, saying that as long as UST is minted, Terra will keep buying BTC to back it.
“One important thing to remember about what we’re going here is that this is not a corporate treasury decision in the sense that I am not buying Bitcoin,” he told Bloomberg TV.
“I’ve already donated money so that we can build up these reserves on behalf of the community and we plan to be doing this in perpetuity, so the $3 billion or so that we’re buying initially to bootstrap the reserves is going to be followed up by… persistent buys of Bitcoin through UST seniorage… every time UST is minted, there will be new bitcoin that is added to the reserves.”
As a decentralized stablecoin, anyone can “mint” UST by burning $1 worth of another decentralized asset, Kwon explained. UST is the largest decentralized stablecoin with a market cap of around $16.5 billion. Tether (USDT), the largest stablecoin as a whole, has a market cap of $82 billion.
“The easy way to understand this is that we’re using Bitcoin to create a decentralized Forex reserve for the Terra stablecoin,” he summarized.
All hail the largest Bitcoin whale?
Active on Twitter, Kwon has previously pledged to overshadow any form of competition, notably MakerDAO’s DAI stablecoin.
The Luna Foundation Guard is well in the green as Terra co-founder Do Kwon stresses he is not “capable of moving” Bitcoin markets.
While cryptically telling followers that he was “just getting started” last week, Kwon has yet to give any further concrete details regarding the timeframes of the BTC buys.
The wallet belonging to LFG last saw inflows on March 30. With 30,727 BTC, it is the 29th largest BTC address.
Once complete, Terra’s reserves will outgun those of any corporate treasury, and will make Kwon and his team the largest Bitcoin whale.
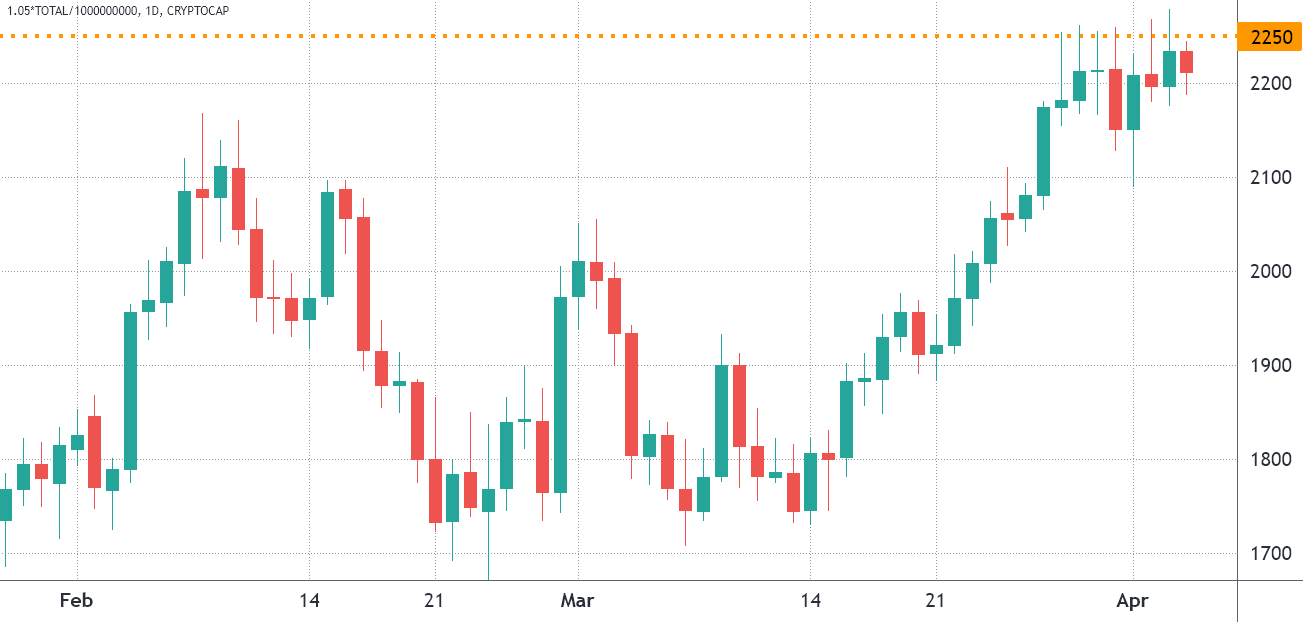
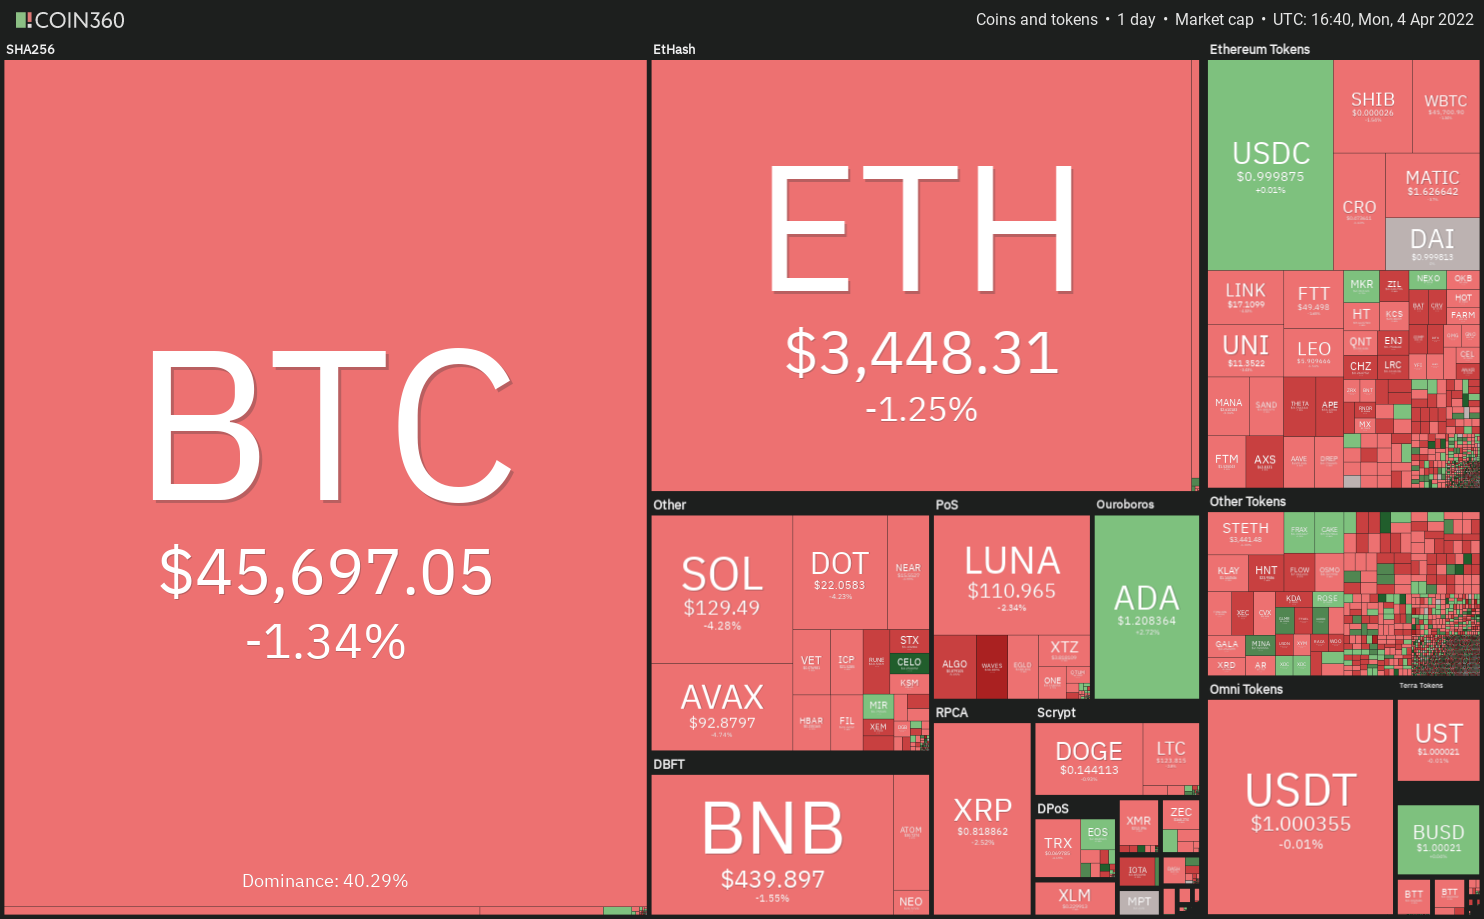
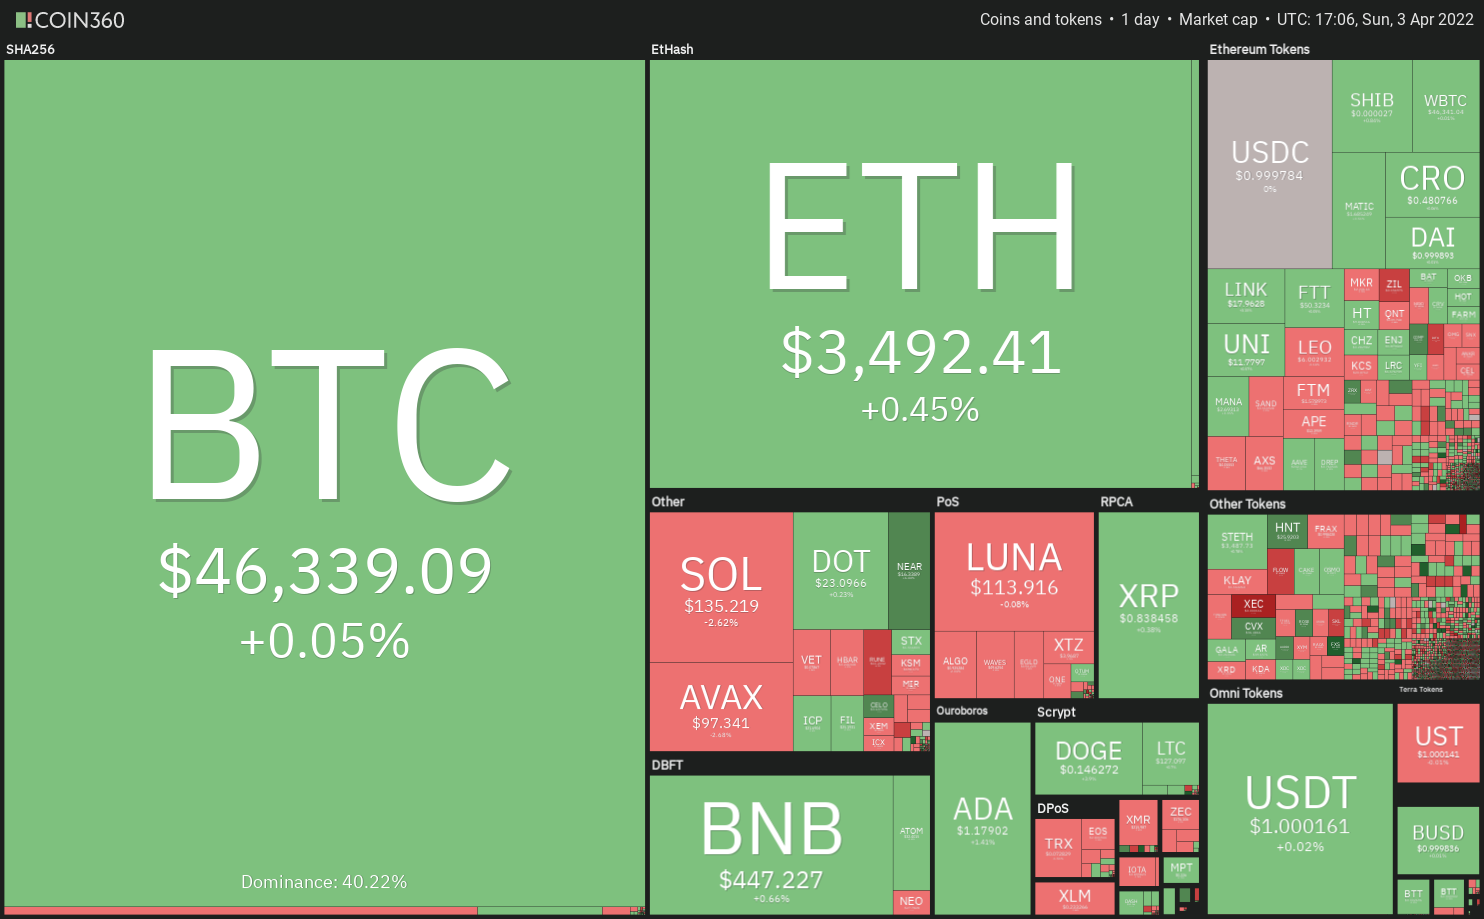
The total crypto market capitalization reached its highest close in three months on April 3 at $2.23 trillion, but the performance between March 28 and April 4 was a mere 1.9% gain. During this time, Bitcoin (BTC) presented a 2.6% negative performance, although that was more than offset by the gains from altcoins.
Total crypto market cap, USD billion. Source: TradingView
While Ether (ETH) and Binance Coin (BNB) gained less than 3% over the past seven days, a handful of mid-capitalization altcoins managed to rally 20% or higher.
On April 1, the Bitcoin network difficulty reached an all-time high at 28.587 trillion. The indicator correlates to the computational power required to mine BTC blocks, currently at an estimated hash rate of 201.8 exahash per second (EH/s).
However, on the same day, the United States Securities and Exchange Commission officially disapproved the application for the ARK 21Shares Bitcoin exchange-traded fund (ETF). The regulator argued that the Cboe BZX Exchange had not met the requirements of listing a financial product under its rules of practice as well as those of the Exchange Act.
Comparing the winners and losers provides skewed results because the top-3 coins had a slightly negative impact.
Weekly winners and losers among the top 80 coins. Source: Nomics
Zilliqa (ZIL) rallied 56% after reports that it will launch a metaverse-as-a-service platform in April. According to a press release, Zilliqa’s Metapolis is being built using the 3D real-time Nvidia Omniverse. Nvidia is a $684 billion Nasdaq-listed graphic processing (GPU) producer.
Aave (AAVE) gained 38% after the release of Aave v3, announced on March 16. The new features aimed to provide greater capital efficiency, increased security and cross-chain functionality. The non-custodial liquidity protocol allows users to lend, borrow or stake their assets to earn yield from their holdings.
Synthetix (SNX) rallied 28% after its Debt Pool Synthesis deployment was scheduled for April 7. Currently, the decentralized finance protocol operates debt pools across two Ethereum chains: the mainnet and layer-2 scaling solution Optimism. By transitioning into an “Optimism-native protocol,” the application will merge its pools to maximize liquidity.
Apecoin (APE) faced a natural correction after a 60% gain between March 21 and March 28, as the firm behind it raised $450 million in a funding round led by Andreessen Horowitz. Yuga Labs, the creator of the Bored Ape Yacht Club (BAYC), launched APE as a governance and utility token that allows its holders to oversee and manage the so-called ApeCoin DAO.
The Tether premium shows slight discomfort
The OKX Tether (USDT) premium is a good gauge of China-based retail trader crypto demand. It measures the difference between China-based peer-to-peer trades and the United States dollar.
Excessive buying demand tends to pressure the indicator above fair value at 100%, and during bearish markets, Tether’s market offer is flooded and causes a 4% or higher discount.
Tether (USDT) peer-to-peer vs. USD/CNY. Source: OKX
The Tether reached 99.2% on April 2, its lowest level since January 26. While this is far away from retail panic selling, the indicator showed a modest deterioration over the past week.
The lack of retail demand is not especially concerning even as the total cryptocurrency market capitalization surpassed $2 trillion and the indicator is down 19% since Dec. 2021.
Futures markets show mixed sentiment
Perpetual contracts are currently reflecting mixed sentiment. As shown below, the accumulated seven-day funding rate is slightly positive for Bitcoin, Ether, Solana and XRP. This data indicates higher demand from longs (buyers), but it is far from excessive. For example, Solana’s positive 0.20% weekly rate equals 0.8% per month, which should not be a concern for most futures traders.
Accumulated perpetual futures funding rate on April 4. Source: Coinglass
On the other hand, Terra (LUNA) showed slightly more demand from shorts (sellers) and the absence of Tether demand in Asia signals a lack of confidence from traders.
The total market capitalization rallied 26% in three weeks, from $1.67 trillion to $2.1 trillion on April 4. Yet, derivatives indicators show no sign of improvement, so there’s a lack of trust from investors. Until the sentiment improves, the odds of a negative price correction remains high.
The views and opinions expressed here are solely those of the author and do not necessarily reflect the views of Cointelegraph. Every investment and trading move involves risk. You should conduct your own research when making a decision.
Non-profile picture (PFP) NFTs had been cooling down over the past few months but now that Bitcoin and Ethereum have turned bullish again, altcoins and NFT-focused tokens are beginning to follow.
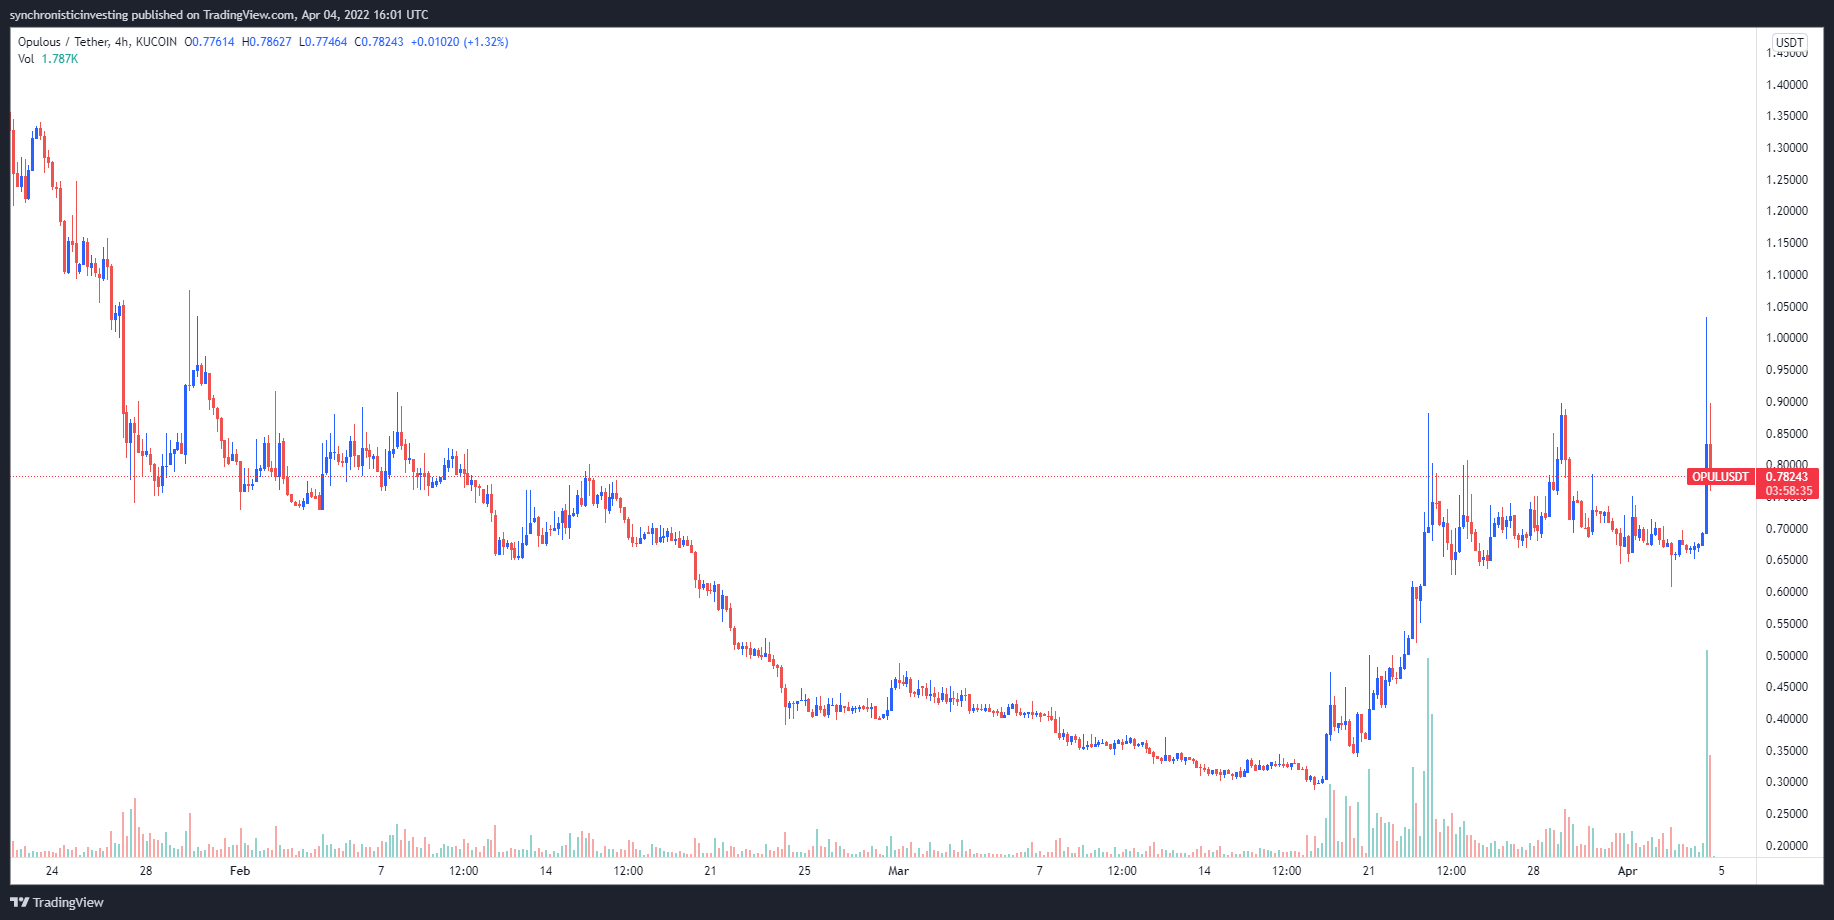
Music NFTs are one sector of the ecosystem that is showing bullish signs this week, and Opulous (OPUL) protocol was the breakout star of the day. Opulous aims to bring aspects of decentralized finance (DeFi) to the music industry and also change how artists access funding.
Data from Cointelegraph Markets Pro and TradingView shows that the price of OPUL has climbed 260% since hitting a low of $0.287 on March 18 to hit a daily high of $1.04 on April 4 amid a 415% spike in its 24-hour trading volume.
OPUL/USDT 4-hour chart. Source: TradingView
Three reasons for the price turnaround in OPUL include the completion of its latest security NFT (S-NFT) sale, new exchange listings and the upcoming launch of liquidity pools for OPUL on multiple Algorand-based DeFi protocols.
The first S-NFT sale is a success
The biggest driver of interest in OPUL over the past couple of weeks was the launch of its latest S-NFT sale for the song “Patek Myself” by the U.K. rap artist Ard Adz.
The S-NFT sale occurred on March 31 and took less than 45 minutes to sell out and reach its goal of raising $50,000, with data from WeFunder showing the sale was oversubscribed and managed to raise $66,900.
Since the sale, the team at Opulous revealed that the next major announcement from the project will be revealed this week and will involve an S-NFT sale for an entire music album.
Huge announcement coming NEXT WEEK. Our next NFT will be for an ENTIRE ALBUM #OPULSEASON is just getting started
Another factor helping to boost the price of Opulous are plans to list OPUL on several DeFi protocols in the Algorand (ALGO) ecosystem.
Pact, an Algorand-based automated market maker, has already established two liquidity pools for OPUL that are paired with ALGO and USD Coin (USDC) and it recently announced a campaign in conjunction with the Algorand Foundation that will distribute 1 million ALGO tokens to its supported pools between April 8 and June 2.
Opulous has also revealed that new staking pools will be coming to the Algorand DeFi hub, AlgoFi, beginning on April 5.
OPUL has also recently listed to a few centralized exchanges, including HotBit and LAToken.
After the March 30 listing announcement for LAToken, the project teased that another exchange listing would be “coming next week,” indicating the potential for further price appreciation.
In addition to these new exchange listings, the OPUL staking pool on KuCoin has increased its capacity to 5 million OPUL, increased the available lockup time to 60-days and now offers an APY of 30%.
The views and opinions expressed here are solely those of the author and do not necessarily reflect the views of Cointelegraph.com. Every investment and trading move involves risk, you should conduct your own research when making a decision.
After the recent hack on Axie’s sidechain, money could flow more into SAND
Sandbox is one of the fastest-growing play-to-earn gaming platforms, with growing adoption.
Axie Infinity is a play-to-earn gaming platform with crypto’s most expensive NFT collection.
While both are good investments, AXS could underperform SAND after the Ronin network attack.
Sandbox SAND/USD is one of the best-known play-to-earn gaming platforms today. The popularity of Sandbox games has been instrumental in the rise of SAND’s value since 2021. However, besides play-to-earn gaming, Sandbox has been venturing into other things that could trigger significant value growth for SAND. For instance, Sandbox has agreed with Warner Music that would see virtual concerts take place inside the Sandbox Metaverse. This, coupled with the growing interest in the Metaverse, makes SAND a potentially good cryptocurrency to buy in 2022.
On its part, Axie Infinity AXS/USD is an equally strong play-to-earn gaming platform. It is the largest play-to-game platform globally and has an NFT collection whose value is second to none. Due to its edge as a market leader, Axie Infinity is likely to get even more popular as play-to-earn becomes more important in the gaming industry.
Why SAND holds an edge over AXS
While both SAND and AXS have strong prospects in the long run, SAND could outperform in the short term. This has a lot to do with the negativity around Axie Infinity’s recent hack. A few days ago, it was revealed that Axie Infinity’s Ronin Network was attacked, and $600 million worth of Ethereum was stolen. Since such events usually create market panic, AXS is likely to rag behind SAND even as bullish momentum returns to the market.
Summary
Sandbox is a play-to-earn gaming platform that is one of the fastest-growing in the Metaverse ecosystem. On its part, Axie Infinity is one of the largest play-to-earn gaming platforms in the market and has one of the most expensive NFT collections in crypto. While both will perform well long-term, the recent attack on Axie Infinity’s Ronin network could see it underperform SAND in the short term.
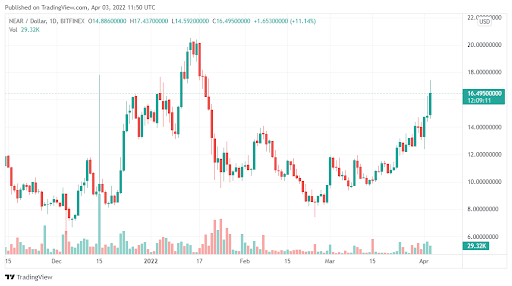
After seeing a major sell-off at the beginning of the year, The Near Protocol (NEAR) appears to have fully recovered. In fact, the coin started to pair up losses well before the entire market rebounded and has since maintained this uptrend. Here are some details:
Since the end of February, NEAR has risen steadily in price.
The coin has breached various crucial resistance zones in the process.
But increased liquidation of long positions could spell doom for the altcoin.
Data Source: Tradingview
Near Protocol (NEAR) – Understanding the risks
The steady jump that NEAR has reported since the end of February has been quite impressive. The coin is now trading well above its 200- and 50-day simple moving averages, something that indicates bullish momentum.
In fact, NEAR is one of the few coins in the top 20 that has managed to breach the 200-day SMA. The RSI is also indicating that further upside is coming. The coin could surge past $20 in the days ahead. But despite this impressive uptrend, there is one thing that should get investors quite worried.
According to data provided by Coinglass, there has been a significant increase in liquidation for long positions. This essentially means that investors who had bought NEAR to hold it for a long period of time are already out of money. What is now left is a huge portion of short positions which are very prone to profit-taking. If this happens, which is quite frankly very likely, the uptrend NEAR has reported will slow significantly.
Why should you buy NEAR anyway?
Despite this downside risk, NEAR is still bullish, and it has a very good chance of posting more gains in the near term before any pullback. However, it would be best to lock in profits once the coin touches $20. This will still represent a net gain of around 25% from the current price.
Bitcoin (BTC) has been stuck between $45,400 and $47,500 for the past two days, indicating a tough tussle between the buyers and sellers as both attempt to establish control over the trend.
Data from on-chain analytics firm Glassnode showed that 100,000 Bitcoin left exchanges in March. These large quantities of withdrawals have only happened twice in the history of Bitcoin with the largest being in March 2020. However, this does not mean the price will rally immediately. In 2020, the momentum picked up only by the fourth quarter of the year.
For the near term, analysts remain divided with some expecting Bitcoin to drop to $44,800 or even to $43,000 while others anticipate a rally to the psychological level at $50,000.
As the crypto markets mature, they continue to attract new investors. A report by Gemini crypto exchange highlighted that the number of users who purchased their first cryptocurrency in 2021 soared by more than 50% in India, Brazil and Hong Kong. Even Latin America, Asia Pacific, the United States and Europe witnessed over 40% more new users who started investing in 2021.
Could Bitcoin and altcoins bounce off their support and extend the recovery? Let’s study the charts of the top-10 cryptocurrencies to find out.
BTC/USDT
The long wick on the candlestick of the past two days suggests that bears are selling near the 200-day simple moving average (SMA) ($48,266). A minor positive has been that the bulls have not allowed Bitcoin to break below the important support at $45,400.
BTC/USDT daily chart. Source: TradingView
However, this tight-range trading is unlikely to continue for long. If the price breaks below the 20-day exponential moving average (EMA) ($44,467), the BTC/USDT pair could drop to the 50-day SMA ($41,689). Such a move could invalidate the short-term bullish setup.
Conversely, if the price rises from the current level or the 20-day EMA, it will suggest that traders continue to buy on dips. That could enhance the prospects of a break above the 200-day SMA. If that happens, the pair could rally to $52,000.
ETH/USDT
Ether (ETH) broke and closed above the 200-day SMA ($3,487) on April 3 but the bulls could not sustain the higher levels. This suggests that the bears are trying to pull the price lower and trap the aggressive bulls.
ETH/USDT daily chart. Source: TradingView
If the price breaks below $3,411, the bears will try to pull the ETH/USDT pair to the 20-day EMA ($3,197). This is an important level for the bulls to defend if they want the positive momentum to remain intact.
If the price rebounds off the 20-day EMA, the buyers will again try to thrust and sustain the price above the 200-day SMA. If they manage to do that, the pair could rally to $4,000.
On the other hand, if the 20-day EMA support gives way, the selling could intensify and the pair may drop to the 50-day SMA ($2,895).
BNB/USDT
BNB has been trading close to the $445 level for the past few days. Although the bulls pushed the price above this level repeatedly, they could not sustain the higher levels and challenge the 200-day SMA ($467). This indicates that demand dries up at higher levels.
BNB/USDT daily chart. Source: TradingView
The bears will now try to pull the price to the 20-day EMA ($421), which is an important support to watch out for. If the price rebounds off this level, the buyers will make one more attempt to clear the overhead hurdle and push the BNB/USDT pair to $500.
Alternatively, if the price breaks below the 20-day EMA, it will suggest that the short-term traders may be booking profits. That could pull the price to the 50-day SMA. A break below this support will suggest that the break above $445 may have been a bull trap.
SOL/USDT
Solana’s (SOL) recovery stalled just below the 200-day SMA ($150). This suggests that higher levels are attracting selling by the bears. The bears will now try to pull the price to the breakout level at $122.
SOL/USDT daily chart. Source: TradingView
If the price rebounds off $122, the bulls will make another attempt to clear the overhead hurdle at the 200-day SMA. If they succeed, the SOL/USDT pair could rally toward the psychological level at $200. The rising 20-day EMA ($111) and the relative strength index (RSI) near the overbought zone indicate advantage to buyers.
Contrary to this assumption, if bears sink the price below $122, the pair could drop to the 20-day EMA. This is an important support to keep an eye on because a break below it could result in a decline to the 50-day SMA ($96).
XRP/USDT
The bulls attempted to push Ripple (XRP) above the overhead resistance at $0.86 but the bears did not budge. The failure to rise above $0.86 may attract profit-booking from short-term traders, which could sink the price to the 50-day SMA ($0.78).
XRP/USDT daily chart. Source: TradingView
If the price once again bounces off the 50-day SMA, it will suggest that bulls are accumulating on dips. That could keep the XRP/USDT pair stuck between the 50-day SMA and the 200-day SMA ($0.89) for a few days.
The flattish 20-day EMA ($0.82) and the RSI near the midpoint also suggest a consolidation in the near term.
If bears pull the price below the 50-day SMA, the pair could plummet to $0.70. Alternatively, if buyers drive the price above the 200-day SMA, the pair could rally to the psychological level at $1.
ADA/USDT
Cardano (ADA) turned up on April 1 and has reached the overhead resistance at $1.26 where the bulls are likely to encounter strong resistance from the bears.
ADA/USDT daily chart. Source: TradingView
The upsloping 20-day EMA ($1.08) and the RSI near the overbought zone indicate that the path of least resistance is to the upside. If bulls push the price above $1.26, the ADA/USDT pair could rally to the 200-day SMA ($1.48) and then to $1.63.
Conversely, if the price once again turns down from the overhead resistance, the pair could drop to the 20-day EMA. A break and close below this support could pull the price down to the psychological level at $1.
LUNA/USDT
Terra’s LUNA token broke out of the overhead resistance at $111 on April 2 and made a new all-time high at $118 on April 3. This suggests that the bulls are in the driver’s seat.
LUNA/USDT daily chart. Source: TradingView
However, the negative divergence on the RSI warns that the bullish momentum may be weakening and the LUNA/USDT pair could witness a minor correction or consolidation.
If the price slips below the 20-day EMA ($100), traders who may have bought at lower levels could book profits. That could pull the price down to the 50-day SMA ($84).
Conversely, if the price rebounds off the 20-day EMA, it will suggest that the bulls continue to defend the level aggressively. The buyers will then try to push the pair above $118. If they succeed, the pair could rise to $125 and later march toward $150.
Avalanche (AVAX) repeatedly broke above the overhead resistance at $98 in the past few days but the bulls could not sustain the higher levels. This indicates that bears are defending the level with vigor.
AVAX/USDT daily chart. Source: TradingView
The bears will now try to pull the price to the 20-day EMA ($89). This is an important level to watch out for because a strong rebound off it will suggest that the sentiment remains bullish and traders are buying on dips.
That could increase the possibility of a break and close above the $98 to $100 resistance zone. If that happens, the AVAX/USDT pair could rally to $120.
Contrary to this assumption, if the price continues lower and breaks below the 20-day EMA, the next stop could be the 50-day SMA ($82). The pair could then extend its range-bound action for a few more days.
DOT/USDT
Polkadot (DOT) broke and closed above the overhead resistance at $23 on April 3 but the bulls could not sustain the higher levels. This suggests that the bears have not yet given up and are selling on every rise.
DOT/USDT daily chart. Source: TradingView
The bears are trying to sustain the price below $23 and trap the aggressive bulls who may have gone long on a breakout above the resistance. The critical level to watch on the downside is the 20-day EMA ($21).
If this support cracks, the DOT/USDT pair could drop to $19. If the price rebounds off this level, the DOT/USDT pair could remain range-bound between $19 and $23 for a few days.
Conversely, if the price turns up from the current level and breaks above $24, the pair could rally to the 200-day SMA ($29).
DOGE/USDT
Dogecoin (DOGE) rebounded off the 20-day EMA ($0.13) on April 3, indicating that the bulls continue to defend this level aggressively. The rising 20-day EMA and the RSI in the positive zone indicate an advantage to buyers.
DOGE/USDT daily chart. Source: TradingView
The buying continued on April 4 and the bulls attempted to resume the up-move toward the overhead resistance zone between $0.17 and the 200-day SMA ($0.18) but the long wick on the candlestick suggests that bears are selling at higher levels.
If the price continues lower and breaks below the 20-day EMA, it will suggest that the DOGE/USDT pair could remain range-bound between $0.10 and $0.17 for a few more days.
The bulls will have to propel and sustain the price above the 200-day SMA to signal a potential change in trend.
The views and opinions expressed here are solely those of the author and do not necessarily reflect the views of Cointelegraph. Every investment and trading move involves risk. You should conduct your own research when making a decision.
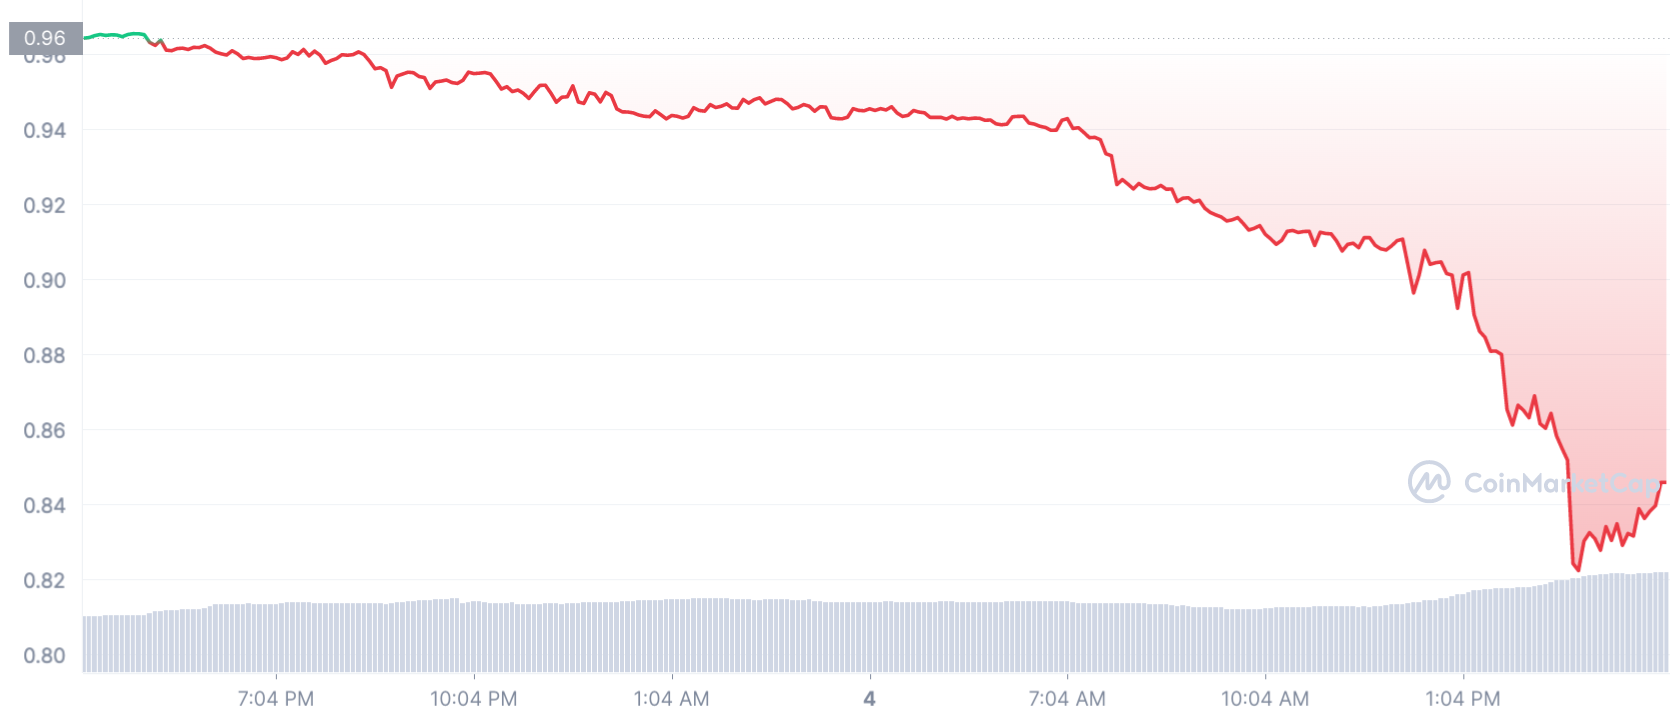
Neutrino Dollar (USDN), a stablecoin issued through Waves-backed Neutrino protocol, lost its U.S. dollar-peg on April 4 amid speculations that it could become “insolvent” in the future.
USDN plunges 15% despite WAVES backing
USDN dropped to as low as $0.822 on Monday with its market capitalization also diving to $824.25 million, down 14% from its year-to-date high of $960.25 million.
Interestingly, the stablecoin’s plunge occurred despite Neutrino’s claims of backing its $1-peg via what’s called “over collateral,” i.e., when the total value of Waves (WAVES) tokens locked inside its smart contract is higher than the total USDN minted, also called the “backing ratio.”
Neutrino Dollar price performance in the last 24 hours. Source: CoinMarketCap
Notably, Neutrino smart contract’s backing ratio came out to be 2.62 Monday, according to official data, underscoring that it had adequate funds to back USDN’s dollar-peg by 1:1. That is despite WAVES’ 35%-plus drop in the last five days.
Price manipulation
WAVES’ price dropped from its record high near $64 on March 31 to as low as $47 on April 4. The coin started declining as its momentum indicator, the relative strength index (RSI), jumped above 70 — an ‘overbought’ area that typically triggers selling sentiment.
WAVES/USD daily price chart. Source: TradingView
Nonetheless, the selloff occurred also as a pseudonymous analyst accused Waves of artificially pumping WAVES by 750% in the last two months by:
1) collateralizing USDN to borrow USD Coin (USDC) on the Vires.Finance lending platform;
2) use the proceeds to purchase WAVES;
3) converting the tokens to USDN, and 4) redeploy them into the Vires.Finance pool to borrow more USDC.
The analyst also said that a decisive WAVES’ price crash would make USDN insolvent.
If WAVES prices drop enough —- WAVES mkt cap could be less than USDN outstanding
This would mean USDN is insolvent and would depeg
If USDN depegs is material — the USDC short on Vires could liquidate $607mm of the $875mm outstanding USDN
Waves founder Sasha Ivanov, however, denied the allegations on April 3, noting that one cannot move markets of more than $1 billion daily volume by borrowing a few millions.
He further accused Alameda Research, a quantitative crypto trading firm headed by FTX’s Sam Bankman-Fried, of launching a campaign “fueled by a crowd of paid trolls” against WAVES to honor their short positions on the coin.
The account started borrowing $waves around March, 20, sending it to Binance – https://t.co/OoSC50EaHl, obviously to sell and make the price go lower. It started around the same time when the FUD campaign started.
From a technical perspective, WAVES holds its bullish bias above the confluence of two support levels: the 20-day exponential moving average (20-day EMA; the green wave) around $40 and the 0.382 Fib line near $42.50.
Conversely, a decisive break below the support confluence could risk crashing WAVES toward $30.
The views and opinions expressed here are solely those of the author and do not necessarily reflect the views of Cointelegraph.com. Every investment and trading move involves risk, you should conduct your own research when making a decision.
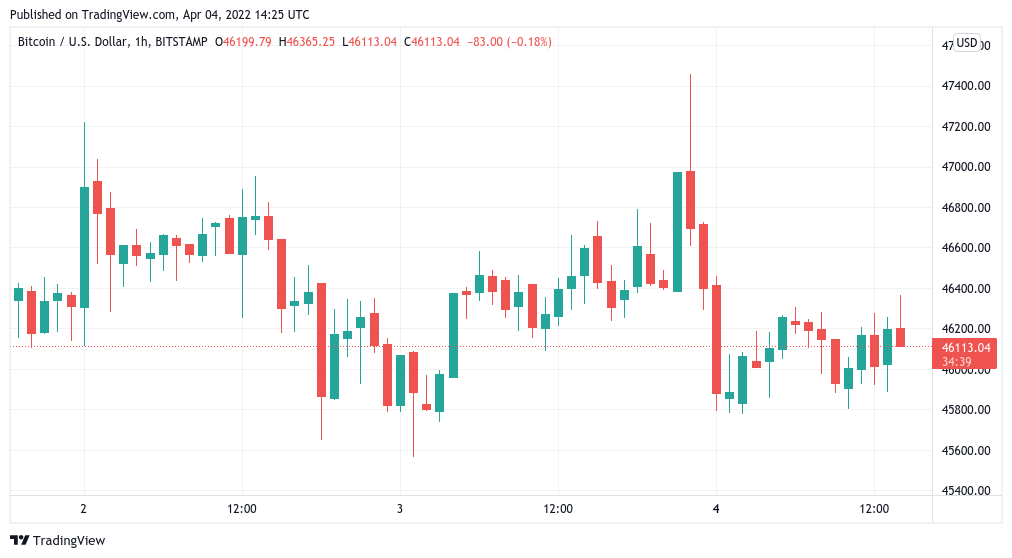
Data from Cointelegraph Markets Pro and TradingView showed BTC/USD dipping above and below the $46,000 mark on April 4, continuing a low-volatility few days.
The pair had managed to seal a second week near the 2022 yearly open, with analysts already hoping for a breakout to $50,000 or even beyond.
At the time of writing, however, there was still no sign of such an outcome, while Bitcoin stuck to an increasingly narrow low-timeframe trading range.
“Bitcoin is not really clear to me; it could be because of a very slow weekend, which is disturbing a bit, [in] my view,” popular trader Crypto Ed summarized in his latest YouTube update on the day.
Highlighting a falling diagonal resistance trendline, Crypto Ed reasoned that a potential pullback could come as early as April 4, resulting in Bitcoin reversing to $44,800 or deeper to near $43,000 should that not hold.
The diagonal, he added, was keeping $50,000 out of reach for the time being.
Fellow trader and podcast host Scott Melker was tentatively hopeful, noting that Bitcoin was being rejected at the 200-day moving average.
“Rejected at the 200, meandering down to $45,500; we should be heading up,” he said in a Twitter broadcast on April 4.
“Let’s hope that whales do not decide to dump on us just because there is a conference.”
Melker was referring to the Bitcoin 2022 event in Miami from April 6-9, a major gathering of some of the Bitcoin world’s best-known names.
On altcoins, the pack was led by Dogecoin (DOGE) on the day, which outpaced all the major cryptocurrencies, thanks to a classic publicity boost from Tesla CEO Elon Musk.
After the billionaire revealed that he had bought a 9.3% stake in Twitter, making him the largest shareholder in the company, DOGE/USD was the clear beneficiary in crypto, climbing almost to its highest levels in two months.
Musk’s move was the result of a survey held on Twitter, itself, in which just over two million respondents told him that “free speech principles” were not being upheld by the firm.
The consequences of this poll will be important. Please vote carefully.
Other Twitter activity in recent days, meanwhile, continued Musk’s direct interaction with the Dogecoin community.
As Cointelegraph reported, inflows to altcoins over the past week underscored the increased appetite for what on-chain analytics firm Glassnode called “riskier” altcoins.
Bitcoin (BTC) starts a new week and a new quarter as if it were starting the new year — at just over $46,000.
In what will seem like some serious deja-vu for hodlers, BTC/USD is at practically the same level it was on Jan. 1, 2022.
Price action has been quiet — too quiet, perhaps — in recent days, but behind the declining volatility, there are signs that the market is busy deciding future direction.
From macro to on-chain, there are in fact plenty of cues to keep an eye on in April, amid a backdrop of Bitcoin — at least so far — retaining its yearly open price as support.
Cointelegraph takes a look at five of these factors as they pertain to BTC price performance over the coming week.
Inflation meets fresh money printing
There has been much talk of the end of the post-COVID “easy money” period and the impact it’ll have on risk assets such as Bitcoin.
As the United States Federal Reserve pledges to reduce its record high balance sheet and keep raising key rates, commentators have sounded the alarm over what could be a shockwave hitting investment into crypto.
So far, however, there is little sign that a fundamental shift is underway, while in Asia this week, it seems like the opposite is true.
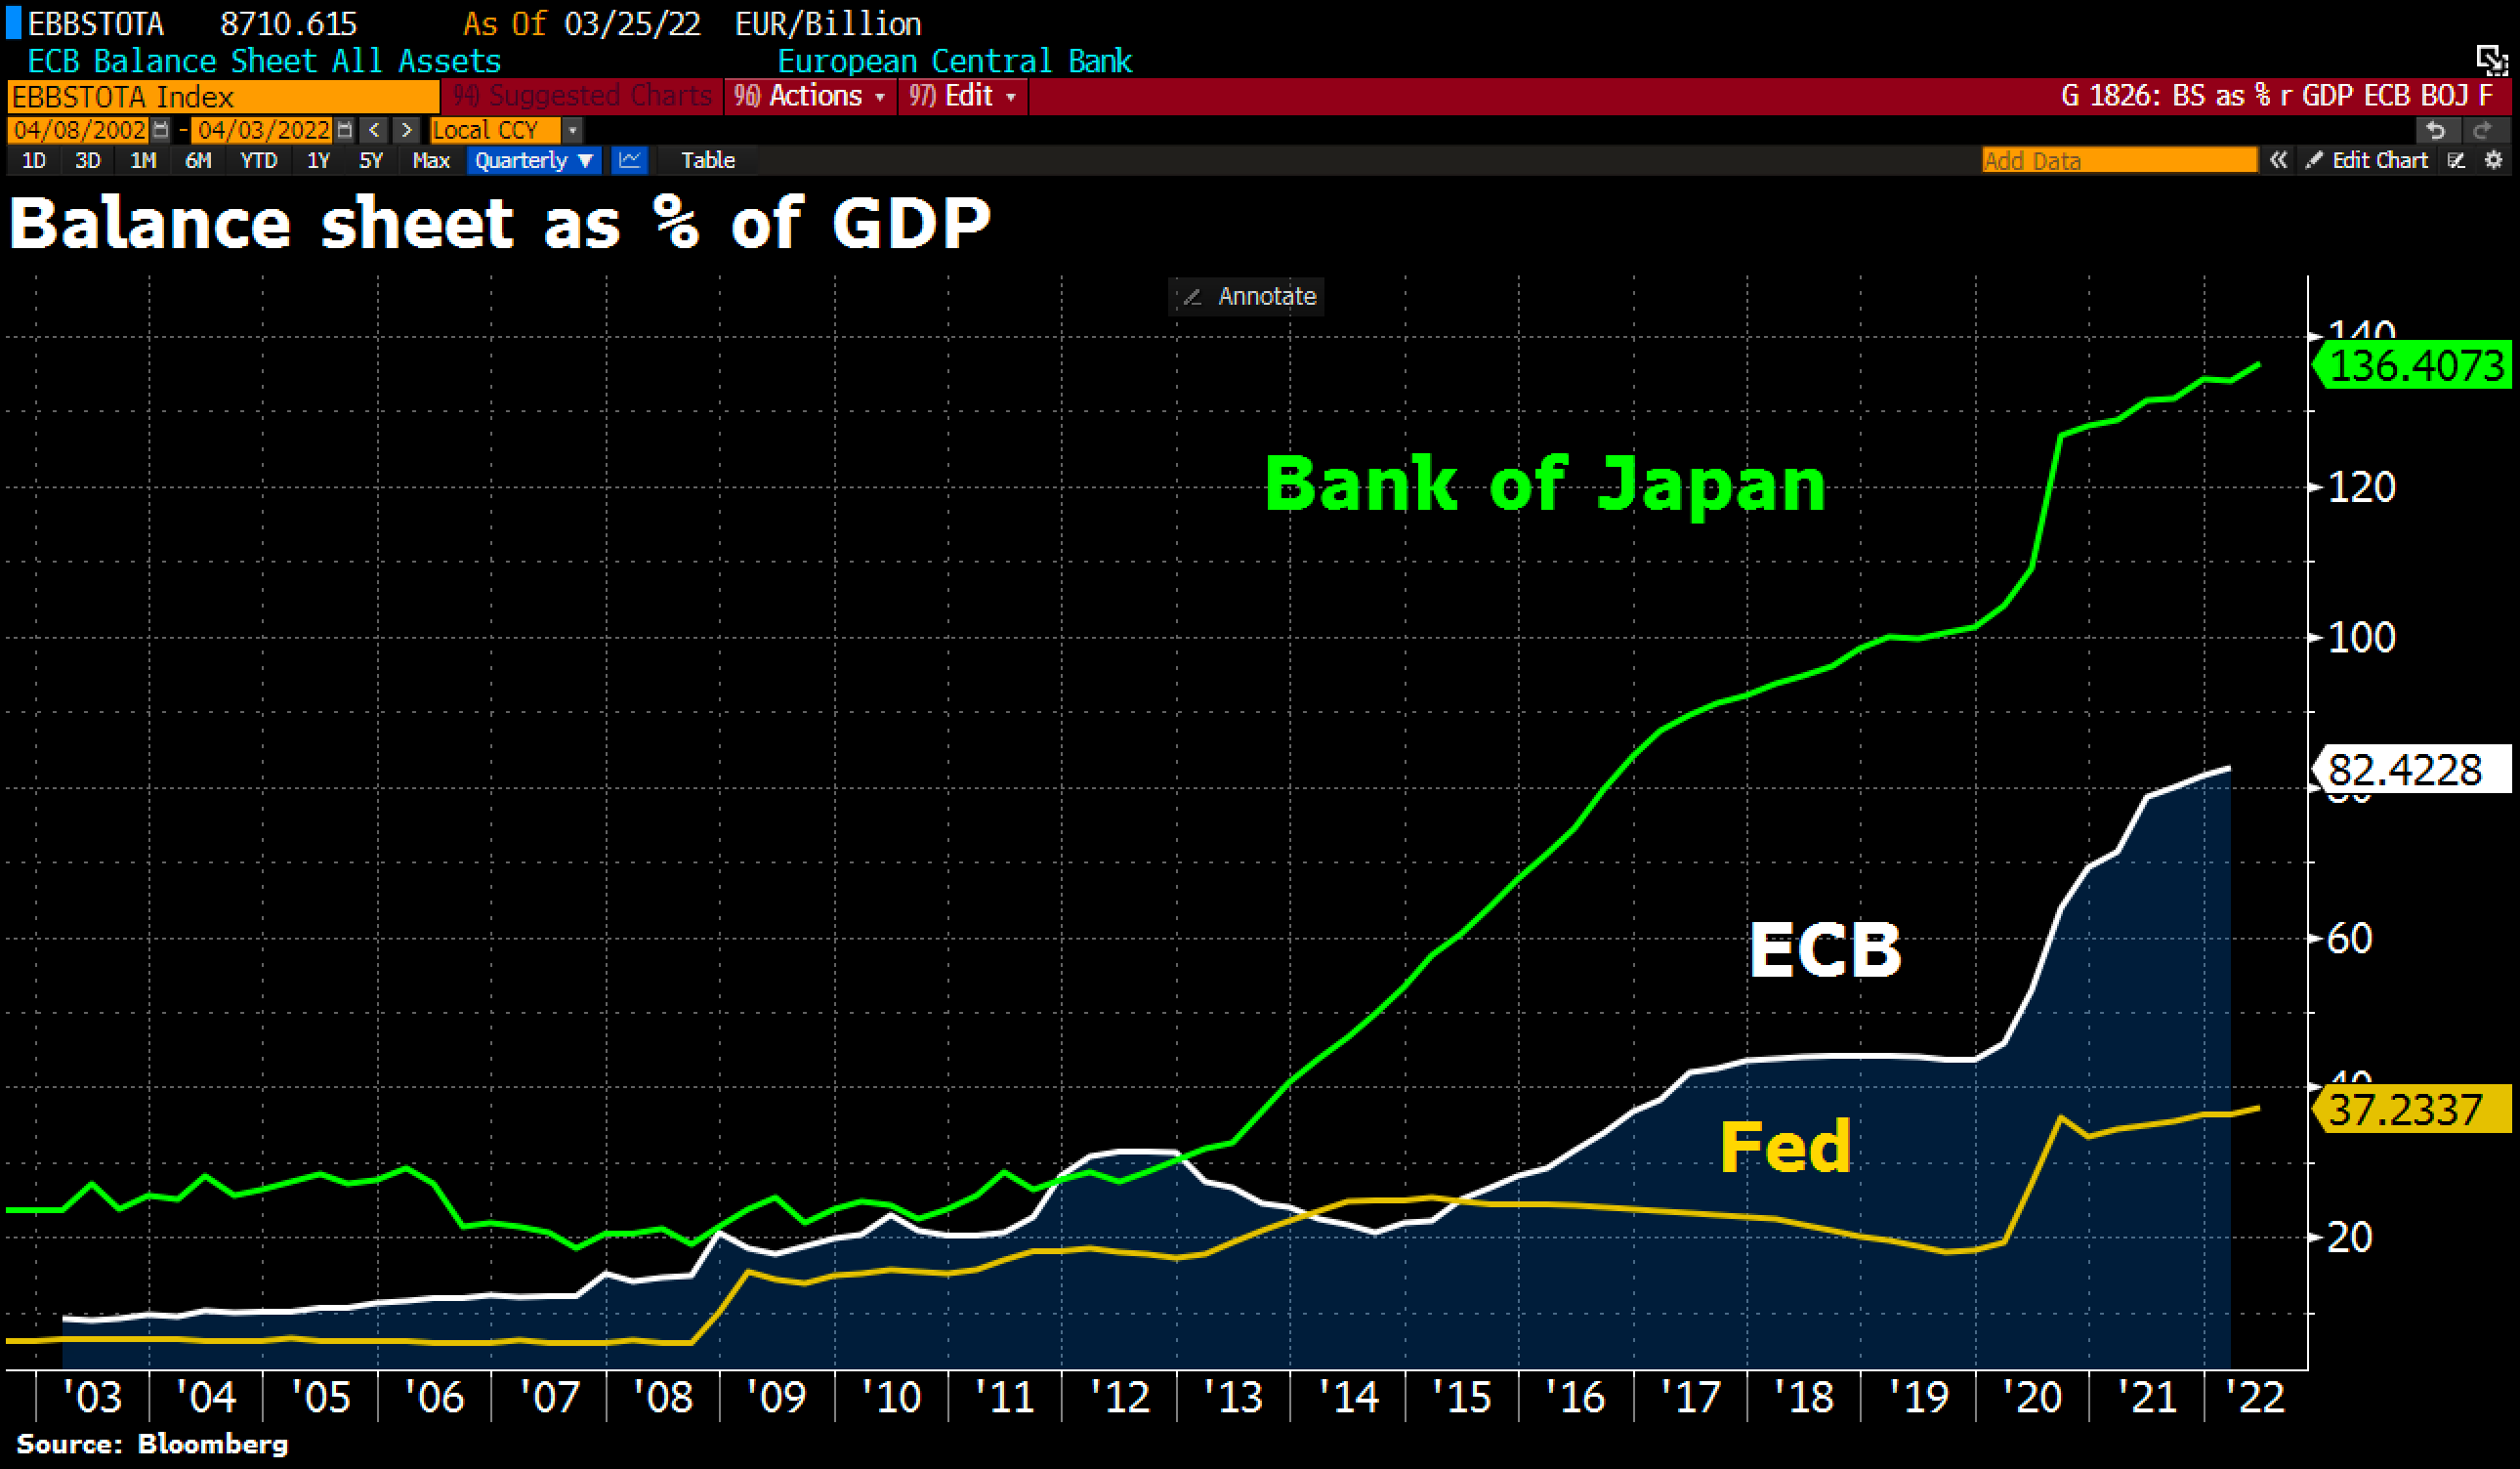
As highlighted by markets commentator Holger Zschaepitz, Japan’s central bank, the Bank of Japan (BoJ), has in fact added to its balance sheet but printing even more liquidity.
The BoJ already had the largest balance sheet relative to GDP, and that trend is only increasing, now at 136% of GDP.
For Zschaepitz, this is not only a surprise, but could be “the biggest monetary experiment in history.”
“In comparison, the ECB and the Fed look like amateurs,” he argued.
Central bank balance sheet annotated chart. Source: Holger Zschaepitz/ Twitter
If more printing means more good times for risk assets, meanwhile, not everyone is even convinced that the long-vaunted balance sheet reductions will last. Central banks, they claim, will soon have no choice but to restart liquidity injections.
“There is no government, ever, that resisted the temptation to print money in order to pay its bills and placate its citizens. The government will never voluntarily go bankrupt. This is axiomatic. I challenge you to contradict me with evidence,” Arthur Hayes, ex-CEO of derivatives giant BitMEX, wrote in a blog post in March.
“Therefore, if your time horizon is in the years, it’s time. If you mess with the bull, you get the horns. Remember: it’s not gold or Bitcoin that is increasing in price, it’s a decrease in value of the fiat currency in which they are priced.”
The contrasting view, as signaled by last week’s yield curve inversion, pits rate hikes against the now high risk of a recession in the U.S. — a combination that should pressure Bitcoin and stocks alike.
Spot bulls aim for $50,000
The lack of volatility is the main talking point among Bitcoin traders and analysts as Monday gets underway.
Some classic but brief excitement around the weekly close faded within hours, with bears still failing to take the yearly open away as support, data from Cointelegraph Markets Pro and TradingView shows.
With that, BTC/USD is in exactly the same place as it was three months ago, but short-term price signals are already seeing some calling for continuation higher.
Among them is popular analyst TechDev, who highlighted Bitcoin’s first “volatility squeeze” since January playing out on the 12-hour chart.
TechDev used indicators including the Bollinger Bands volatility measure, which is now seeing BTC/USD surfing the middle of the channel with a skew to the upside.
As Cointelegraph reported, the odds are already on for an attack on the $50,000 mark, which will be Bitcoin’s first this year.
April itself, meanwhile, has much to live up to — in and of itself, this month has historically been “good” for Bitcoin.
Buyers usher coins out of exchanges in March
It’s no secret that a lot of Bitcoin has been leaving exchanges this year, but the latest data shows just how the supply squeeze is playing out.
According to on-chain analytics firm Glassnode, last month saw exchange outflows unlike many others — exchanges are down by the equivalent of almost 100,000 BTC.
Historically, there have only been two occasions in Bitcoin’s lifespan when outflows surpass the 100,000 BTC mark, making March’s among the highest.
“Aggregate exchange outflows of this magnitude have only been seen on a handful of occasions through history, with most being after the March 2020 liquidity crisis,” Glassnode added in Twitter comments alongside an annotated chart.
Bitcoin exchange net position change annotated chart. Source: Glassnode/ Twitter
Should investors be recreating the bottom-buying behavior from after the COVID-19 crash, the implications should be clear, but may take a while to play out. In 2020, while BTC/USD rebounded after dropping 60% in days, it wasn’t until Q4 that price performance really began to change.
Fellow analytics platform CryptoQuant, which tracks the balances of 21 major exchanges, meanwhile shows that overall BTC stocks are now at their lowest since Aug. 1, 2018 — 2.303 million BTC.
A meandering downtrend in 2022 gathered pace in March, which saw a total of 77,000 BTC withdrawn to private wallets.
An unusual event has occurred when it comes to Bitcoin’s relationship with altcoins — combined open interest and volume on altcoin derivatives markets has surpassed that of Bitcoin for the first time in over a year.
The move was noticed by crypto analytics platform Coinalyze, which openly suggested that the much-fabled “altseason” may now be here.
“Could mean altseason, money flows into alts now,” founder Gabriel Dodan told Cointelegraph in private comments.
Such a perspective chimes with data showing considerable inflows into altcoins last week, which one commentator argued showed risk appetite among investors increasing.
Taking the limelight away from BTC may not be a dampener on performance per se, Dodan meanwhile added, thanks to volatility similarly draining away.
“On the other hand that makes BTC pretty stable because it is not over leveraged; it’s a good floor for BTC,” he explained.
Hash rate hits new all-time high
Hot on the heels of record difficulty for the Bitcoin network, hash rate has hit new all-time highs.
In what shows miners’ belief in the long-term profitability of participating in the network, hash rate is now at 223 exahashes per second (EH/s), according to data resource MiningPoolStats.
While only an estimate of the processing power dedicated by miners, hash rate has never been higher, and according to proponents, will continue to grow regardless of external attempts to “reign in” Bitcoin.
“Bitcoin mining is pretty much the most anti fragile system designed by man,” Francis Pouliot, CEO of payment processor Bull Bitcoin, argued in a well-known blog post about Bitcoin hash rate and energy consumption last year.
“Any attack on Bitcoin is guaranteed to make Bitcoin stronger, which itself implies a higher price, a higher hashrate, and higher energy consumption.”
The topic of Bitcoin versus energy remains highly controversial, with multiple popular figures taking pains to explain what they see as a logical fallacy — that Bitcoin uses “too much.” Bitcoin does not waste energy, they contend, but merely converts it into something more useful as the most sound money ever created.
Hash rate, regardless of the narrative, meanwhile continues to grow, underscoring the basic bullish premise for investing in Bitcoin.
The views and opinions expressed here are solely those of the author and do not necessarily reflect the views of Cointelegraph.com. Every investment and trading move involves risk, you should conduct your own research when making a decision.
Bitcoin (BTC) is attempting to hold above its closest support level and traders are watching to see if the price can remain strong and close above the 2022 yearly open price at $46,200 for the second week in a row.
April has historically been the best performing month of the year for the S&P 500, according to Sam Stovall, chief investment strategist at CFRA. If history repeats itself and the close correlation between the U.S. equity markets and Bitcoin continues, it could bode well for the crypto markets in the near term.
Another sentiment booster could be that the 19th million Bitcoin entered circulation on April 1. For the remaining 2 million Bitcoin, the crypto markets will have to wait for a long time because the last Bitcoin is expected to be mined by 2140. This could shift focus on how only a small quantity of Bitcoin is left to be mined and its growing demand could lead to scarcity and boost prices higher.
Could Bitcoin hold above its critical support and if it does, will altcoins rally? Let’s study the charts of the top-5 cryptocurrencies that may extend their recovery in the short term.
BTC/USDT
Bitcoin is witnessing a tough tussle between the bulls and the bears near the important level at $45,400. The bears tried to pull and sustain the price below this level but the bulls held their ground. This suggests that the bulls are attempting to flip the level into support.
BTC/USDT daily chart. Source: TradingView
The upsloping 20-day exponential moving average ($44,333) and the relative strength index (RSI) in positive territory indicate the path of least resistance is to the upside. The critical level to watch on the upside is the 200-day simple moving average ($48,276).
If bulls thrust the price above this barrier, the BTC/USDT pair is likely to pick up momentum. The rally could face minor resistance at the psychological level at $50,000 but if this level is crossed, the next stop could be $52,000.
Contrary to this assumption, if the price turns down from the current level or the overhead resistance, the bears will again try to pull the pair below $45,400 and the 20-day EMA. If that happens, the pair could drop to the 50-day SMA ($41,615).
BTC/USDT 4-hour chart. Source: TradingView
The 4-hour chart shows that the price has been correcting since hitting the resistance line of the ascending channel. Recovery attempts by the bulls are facing stiff resistance at the downtrend line. If bulls push and sustain the price above the downtrend line, the pair could rise to the resistance line of the channel.
A break and close above the channel could signal the resumption of the uptrend. Alternatively, if the price turns down from the downtrend line, the bears will attempt to sink the pair to $44,000. If this level cracks, the decline may extend to $42,594.
VET/USDT
VeChain (VET) surged above the overhead resistance at $0.07 on March 27 but the bears stalled the recovery at the 200-day SMA ($0.09). A minor positive is that the bulls have not allowed the price to slide below the breakout level at $0.07.
VET/USDT daily chart. Source: TradingView
If the price turns up from the current level, the bulls will make one more attempt to clear the overhead hurdle at the 200-day SMA. If they manage to do that, it will suggest a possible change in trend. The VET/USDT pair could then rally to $0.10 and later to $0.13.
The rising 20-day EMA ($0.06) and the RSI in the positive territory indicate advantage to buyers. This bullish view will invalidate if the price turns down and breaks below the 20-day EMA. Such a move could pull the pair to the 50-day SMA ($0.05).
VET/USDT 4-hour chart. Source: TradingView
The 20-EMA has flattened out and the RSI is near the midpoint on the 4-hour chart, indicating a balance between supply and demand. If the price breaks above $0.08, the bulls will attempt to propel the pair above $0.09. If they do that, the pair could extend its up-move.
Conversely, if the price turns down and breaks below the 50-SMA, the pair could drop to the critical level at $0.07. If bulls flip this level into support, the pair will again try to rise above $0.09 but if the support at $0.07 cracks, the bears may be back in the game.
THETA/USDT
Theta Network’s THETA token has been range-bound between $2.50 and $4.40 for the past several weeks. The bulls attempted to push the price above the overhead resistance but failed. This suggests that the bears continue to defend the level aggressively.
THETA/USDT daily chart. Source: TradingView
If the price does not break below $3.80, it will suggest that traders are not closing their positions in a hurry as they expect the up-move to continue. The upsloping 20-day EMA ($3.54) and the RSI near the overbought zone indicate that the path of least resistance is to the upside.
If buyers drive the price above the overhead zone between $4.40 and the 200-day SMA ($4.77), it will signal the start of a possible uptrend. The THETA/USDT pair could then pick up momentum and rally to $6.
Contrary to this assumption, if the price slides below the 20-day EMA, the next stop could be the 50-day SMA ($3.17). Such a move will suggest that the pair may remain range-bound for a few more days.
THETA/USDT 4-hour chart. Source: TradingView
The 4-hour chart shows that the bears have repeatedly thwarted attempts by the bulls to thrust the price above the overhead resistance at $4.40. The 20-EMA has flattened out and the RSI is near the midpoint, indicating a balance between supply and demand.
If the price slips below the 50-SMA, the short-term advantage could tilt in favor of the sellers. The price could then drop to $3.50. On the other hand, the bulls will gain the upper hand if the price breaks and sustains above the overhead resistance.
THORChain (RUNE) has been trading inside a large descending triangle pattern for several months. The sharp rally of the past few days pushed the price to the downtrend line of the triangle where the bears are mounting a strong resistance.
RUNE/USDT daily chart. Source: TradingView
If the price turns down from the current level, the RUNE/USDT pair could drop to the 20-day EMA ($9.75). This is an important level to watch out for because if the price rebounds off the 20-day EMA, it will suggest that the sentiment remains positive and traders are buying on dips.
That may enhance the prospects of a break above the downtrend line. If that happens, the bearish triangle setup will invalidate, which could be a bullish sign. The pair may then rally to $17.
This bullish view will be negated in the short term if the price turns down and breaks below the 20-day EMA. That could pull the pair down to the 200-day SMA ($7.88).
RUNE/USDT 4-hour chart. Source: TradingView
The 4-hour chart shows that the pair is facing strong resistance near $13. A minor positive is that the bulls have not allowed the price to dip and sustain below $11. Therefore, this becomes an important level to keep an eye on.
If the price breaks below this support, the pair could drop to the next major support at $10. Conversely, if the price rebounds off $11, the buyers will again try to resume the uptrend by driving the pair above the overhead resistance.
AAVE/USDT
Aave (AAVE) broke out of the downtrend line on March 29 which indicated a potential change in trend. The bears tried to stall the recovery at the 200-day EMA ($226) but the bulls did not give up much ground.
AAVE/USDT daily chart. Source: TradingView
The buying resumed on April 1 and the AAVE/USDT pair broke above the 200-day SMA. If the price sustains above the 200-day SMA, it will signal the start of a new up-move.
If bulls drive the price above $262, the rally may extend to the psychological level at $300. The bears may mount a stiff resistance at this level but if bulls overcome this barrier, the up-move could reach $350.
This bullish view will invalidate in the short term if the price turns down and plummets below the 200-day SMA. The bears could then pull the price to the 20-day EMA ($187).
AAVE/USDT 4-hour chart. Source: TradingView
The 4-hour chart shows that the bulls are buying the dips to the 20-EMA. If bulls push the price above $261.20, the uptrend could resume. This rally could face resistance in the overhead zone between $283 and $300.
The RSI is showing signs of a negative divergence, indicating that the bullish momentum may be weakening. If the price turns down and breaks below the 20-EMA, it will suggest that the short-term bulls may be booking profits. That could sink the pair to the 50-SMA.
The views and opinions expressed here are solely those of the author and do not necessarily reflect the views of Cointelegraph. Every investment and trading move involves risk, you should conduct your own research when making a decision.