“The Market Report” with Cointelegraph is live right now. On this week’s show, Cointelegraph’s resident experts discuss the best altcoins to buy for under $3.
But first, market expert Marcel Pechman carefully examines the Bitcoin (BTC) and Ether (ETH) markets. Are the current market conditions bullish or bearish? What is the outlook for the next few months? Pechman is here to break it down.
Next up: the main event. Join Cointelegraph analysts Benton Yaun, Jordan Finneseth and Sam Bourgi as they discuss the best altcoins to buy for under $3. First up, we have Bourgi with his first pick of 1INCH, the governance token of the 1inch decentralized exchange, which aims to offer the best rates by discovering the most efficient swapping routes across all leading DEXs. Second on his list is Enjin Coin (ENJ), which he describes as the plumbing for the metaverse and gaming projects building on the blockchain. Enjin Coin is an Ethereum-based token that aims to make it easy for individuals, businesses and brands to use nonfungible tokens (NFTs).
Yuan is next with his first pick of SUPER, the native token of SuperFarm, a blockchain-based decentralized ecosystem that enables users to create, deploy, develop and farm NFTs. It offers cross-chain NFT farming, making the process, and NFTs in general, more accessible and available to the average user. For his second pick, he’s decided to go with NCASH, the native token of Nitro Network, which launched in 2014 and aims to bridge the divide between the online and offline retail world. The project is an Internet of Things-based, contactless identification system that enables retailers to identify and better serve their customers by using customer records to make precise decisions on product preferences without the use of WiFi or Bluetooth.
In the third spot, we’ve got Finneseth with his first pick of MATIC, the native token of Polygon, which is a layer-2 scaling solution that seeks to provide faster transactions and lower costs for users. It acts as a speedy parallel blockchain running alongside the main Ethereum blockchain. Last, but not least, is RON, the native token of Ronin — another sidechain designed for crypto gaming that currently hosts Axie Infinity, one of the most active games in crypto. Third-party developers are also coming soon, which could bring thousands of new games to the Ronin network. They are all interesting picks, as always, so make sure to stick around till the end of the show to find out who had the best choices, which will be decided by our live poll.
After the showdown, we’ve got insights from Cointelegraph Markets Pro, a platform for crypto traders who want to stay one step ahead of the market. The analysts use Cointelegraph Markets Pro to identify two altcoins that stood out this week: Axie Infinity Shards (AXS) and NFTX.
Do you have a question about a coin or topic not covered here? Don’t worry. Join the YouTube chat room, and write your questions there. The person with the most interesting comment or question will be given a free month of Cointelegraph Markets Pro, worth $100.
The Market Report streams live every Tuesday at 12:00 pm ET (4:00 pm UTC), so be sure to head on over to Cointelegraph’s YouTube page and smash those like and subscribe buttons for all our future videos and updates.
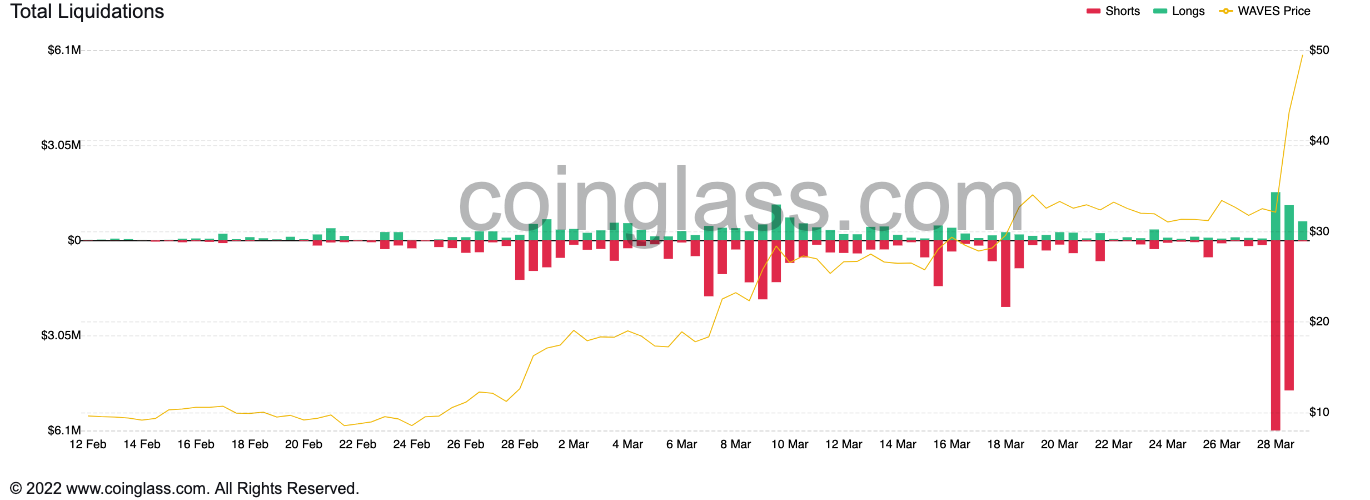
WAVES price surged by up to 70% on March 29, reaching a new all-time high around $54. Traders betting against the rise of Waves — the native token of the WAVES blockchain network — suffered losses worth millions of dollars as the WAVES/USD pair extended its recovery to a record level in the past 24 hours.
The price rebound, which started on Feb. 22 when WAVES price was at $8.25 caused around $13.75 million worth of liquidations due to crypto-based futures on a 24-hour adjusted timeframe, data from Coinglass shows.
WAVES liquidations every 12-hours. Source: Coinglass
Around $11 million of the total liquidated positions were short.
2.0 hype, Neutrino behind WAVES rally
As Cointelegraph earlier covered, traders may have jumped into the WAVES market after assessing its three consecutive optimistic updates: the migration to Waves 2.0, the launch of a $150 million fund and the partnership with Allbridge.
Edson Ayllon, product manager at dHEDGE — a decentralized asset management platform, told Cointelegraph that the euphoria surrounding the release of Waves 2.0 in October was reflective in the rising total value locked (TVL) in the Waves ecosystem that reached an all-time high of $4.36 billion on March 29.
“Waves 2.0 adds EVM support to the execution layer, and adds proof-of-stake with sharding to the consensus layer,” the analyst noted, adding:
“Sharding and proof-of-stake have been concepts Ethereum has been working towards for years on their roadmap.”
Interestingly, Neutrino, an algorithmic price-stable “assetization” protocol built atop the Waves blockchain, appeared largely behind the increasing Waves TVL.
Notably, the protocol witnessed an inflow of 8.91 million WAVES in one day — worth nearly $450 million — to its smart contract, data from Defi Llama shows.
Waves inflow into the Neutrino smart contract. Source: Defi Llama
Neutrino allows the creation of decentralized stablecoins that maintain their U.S. dollar-peg by collateralizing WAVES tokens. The protocol has launched just one stablecoin project so far, called Neutrino USD (USDN).
The supply of USDN increased from around 800 million to 832 million on a 24-hour adjusted timeframe, coinciding with the rise in the WAVES inflow into the Neutrino smart contract. That presented Neutrino as one of the active WAVES buyers in the past 24 hours.
USDN market capitalization in the last 24 hours. Source: CoinMarketCap
What’s next?
WAVES appears to have been breaking out of a bullish continuation pattern called a “bull flag.”
In detail, the chart pattern looks like a downward sloping channel that appears after a strong price move upward (called “flagpole”). In a perfect scenario, it resolves by breaking out toward the level at a length potentially equal to the flagpole’s size.
Applying the classic interpretation of the bull flag pattern to WAVES’ ongoing price action suggests a continued price rally toward $100, as shown in the chart below.
However, WAVES’ weekly relative strength index (RSI) has turned overbought — a sell signal. That could have the WAVES/USD pair retrace towards $34 as its interim support level. That would also mean that traders are returning to bull flag’s top for another upside confirmation.
As a result, a continued selloff below $17 would risk invalidating the entire flag setup.
The views and opinions expressed here are solely those of the author and do not necessarily reflect the views of Cointelegraph.com. Every investment and trading move involves risk, you should conduct your own research when making a decision.
Terra (LUNA) rose to its best level to date on March 29 as the Luna Foundation Guard’s (LFG) plans to increase its Bitcoin (BTC) reserves eased anxiety about the impact of an increasingly hawkish Federal Reserve and the ongoing Ukraine-Russia war on crypto markets.
LUNA price hits new record high above $106
LUNA’s price breached above the previous record high of $106.29 by minuscule margins, reversing the losses incurred during the selloff between December 2021 and January 2022.
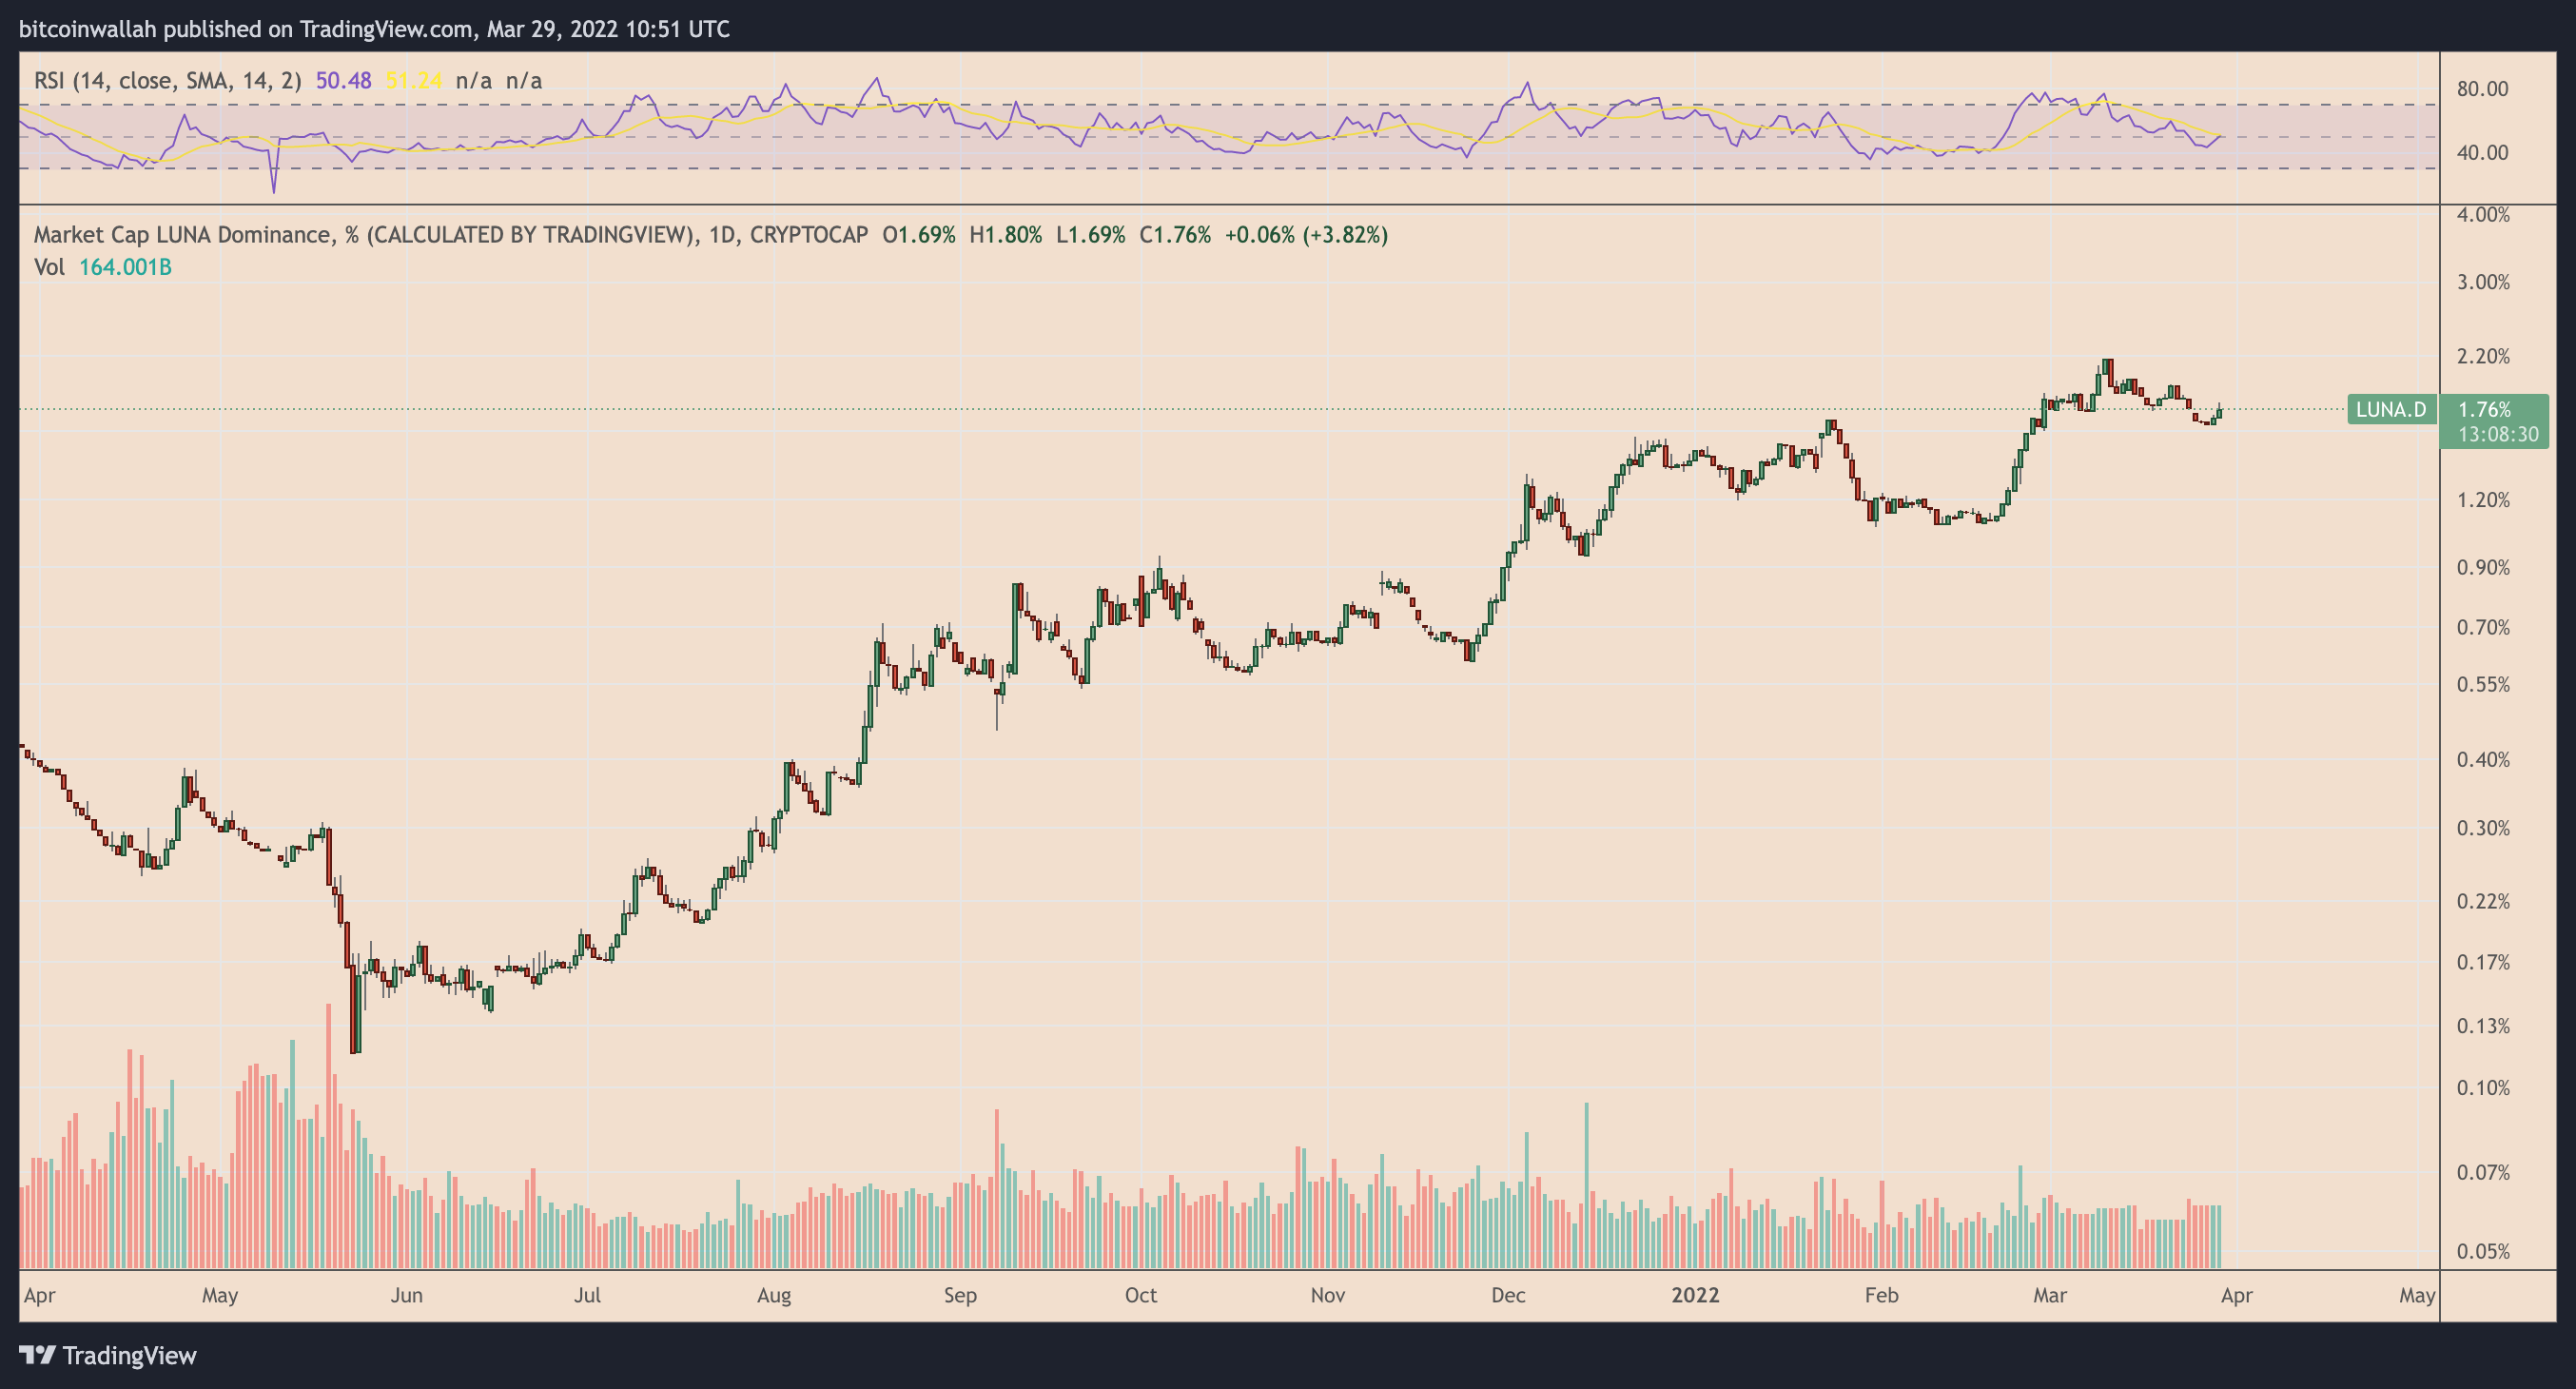
The latest price rally pushed Terra token’s net capitalization crossed $37.17 billion, now making up 1.76% of the entire crypto market, compared to 0.39% at the beginning of this year.
LUNA market dominance is increasing steadily in 2022. Source: TradingView
Terra does a MicroStrategy
Bitcoin wallets associated with LFG, a nonprofit spearheaded by Terra’s creator Do Kwon, saw an inflow of 2,830 BTC worth $135 million on Monday. The influx occurred as a part of LFG’s Bitcoin accumulation spree following a community proposal that suggested to use BTC as collateral to “provide deep liquidity at a discount when the UST peg is under pressure.”
UST is the Terra’s decentralized stablecoin otherwise collateralized by the blockchain’s native cryptocurrency LUNA. As such, Terra’s economy supports the burning of LUNA tokens to mint more UST units as a strategy to maintain the latter’s dollar-peg.
We’re seeing some of the earliest and most ambitious ideas in crypto starting to unfold
Crosschain decentralized stablecoin backed entirely by digitally native assets was the holy grail in 2016
LFG has outlined plans to boost its Bitcoin reserves to $3 billion with a long-term strategy to swell the pool to $10 billion. In a theory, that could lead to an increase in demand for UST, thereby forcing more LUNA tokens out of active supply permanently.
UST net supply. Source: Smart Stake
LUNA faces immediate selloff risks
From a technical perspective, LUNA faces the prospects of undergoing a 50% price correction in the coming weeks, though this may not necessarily hurt the bullish long-term outlook.
In detail, the Terra token has been consolidating inside what appears to be an ascending channel, a continuation pattern that appears after the price fluctuates inside a range defined by an upper horizontal and a lower rising trendline.
In a perfect scenario, the setup resolves with a breakout in the direction of the asset’s previous trend, rising by as much as the maximum distance between the channel’s upper and lower trendline. As a result, LUNA’s price could rise toward $425 in 2022, as shown in the chart below.
But the upside outlook needs further confirmation, beginning with a decisive breakout above the triangle’s upper trendline. If it does not come, LUNA’s prospects of a sharp pullback towards the lower trendlines appear higher, which means a price drop towards the $50-$60 range, down around 50% from today’s price.
The views and opinions expressed here are solely those of the author and do not necessarily reflect the views of Cointelegraph.com. Every investment and trading move involves risk, you should conduct your own research when making a decision.
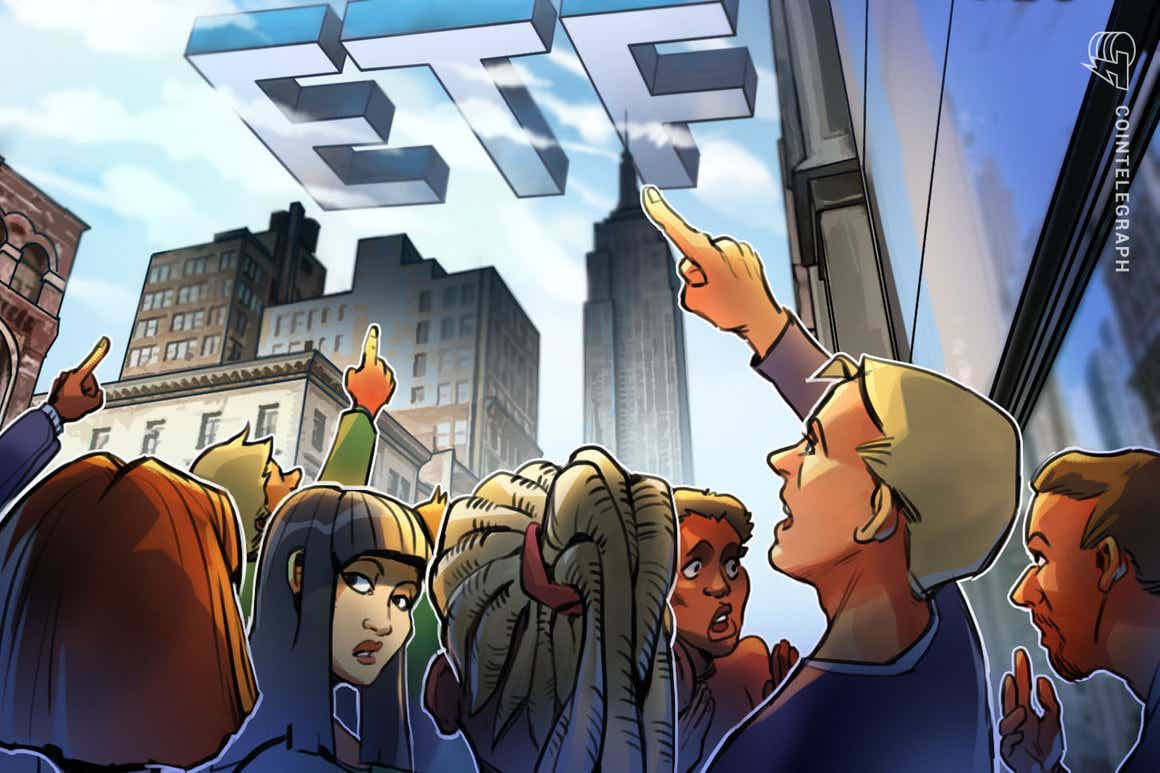
The American exchange-traded fund (ETF) provider WisdomTree continues expanding its cryptocurrency products in Europe by launching three new crypto exchange-traded products (ETP) backed by Solana (SOL), Cardano (ADA) and Polkadot (DOT).
WisdomTree announced Tuesday the launch of three new physically-backed crypto ETPs, including WisdomTree Solana (SOLW), WisdomTree Cardano (ADAW) and WisdomTree Polkadot (DOTW).
The ETPs are already listed on major European digital exchanges like Deutsche Boerse’s Xetra, the Swiss SIX exchange and the Swiss Stock Exchange. The pan-European exchange Euronext is expected to list the crypto ETPs in Amsterdam and Paris on Thursday, the announcement notes.
The ETPs are designed to offer investors in Europe another option to gain exposure to the price of Solana, Cardano and Polkadot via regulated exchanges. SOLW, ADAW and DOTW have a total expense ratio of 0.95% and are available for sale in Austria, Belgium, Denmark, Finland, France, Germany, Italy, Ireland, Luxembourg, Netherlands, Norway, Poland, Spain, Sweden and Switzerland.
The new ETPs follow the growing crypto asset product offering by WisdomTree in Europe, joining products like WisdomTree Crypto Mega Cap Equal Weight ETP, which is backed by physical assets including Bitcoin (BTC) and Ether (ETH), as well as WisdomTree Crypto Market (BLOC) and WisdomTree Crypto Altcoins (WALT).
WisdomTree’s head of Europe Alexis Marinof said that the new offering aims to meet the growing demand from institutional investors to diversify their crypto portfolio, stating:
“While bitcoin and Ethereum grab the headlines, altcoins are now viable options for many institutional investors, providing more options to diversify their crypto holdings just like they would with any other asset class.”
As previously reported by Cointelegraph, WisdomTree has been actively launching ETPs in Europe amid regulatory hurdles in the United States. In late 2021, the U.S. Securities and Exchange Commission rejected WisdomTree’s spot Bitcoin ETF after delaying a decision on the product multiple times. The firm subsequently amended its spot BTC ETF filing, naming U.S. Bank as a custodian for its BTC trust.
The crypto market is often associated with high volatility, wild swings in prices, and stories of rags to riches as well. It’s therefore very hard to look at crypto-assets as serious stores of wealth. But there are actually some coins that can help preserve your money without you taking so much risk: Here is how:
The crypto market these days has Stablecoins which are typically pegged on real assets.
Some crypto assets have minimal volatility too, including the mega caps.
You can buy crypto assets pegged on things like gold and other precious metals.
In case you are searching for coins that can offer you some stability in crypto, we have three here below to check out.
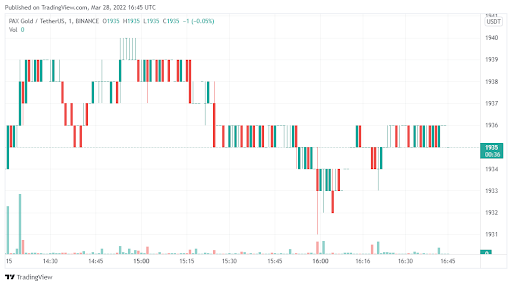
Pax Gold (PAXG)
As noted above, there are stablecoins in the market that are pegged on gold. Pax Gold (PAXG) is one of them. This is basically a crypto asset whose value is directly based or correlated with the price of gold.
Data Source: Tradingview
In essence, you get to store your asset in decentralized systems while getting the assurance of gold as a store of wealth. Many investors look at gold as the ultimate safe haven during times of volatility. PAX Gold helps you rely on gold in its crypto form.
PAX Dollar (USDP)
The Pax Dollar (USDP) is a stablecoin that is pegged on the US dollar. Just like the PAX Gold coin, its price is directly correlated with the US dollar. So, if you don’t want to put your money in fiat form, you can ditch the bank and store your dollars in crypto form.
Tether (USDT)
Tether (USDT) is also backed by the US dollar. However, unlike PAX Dollar, it actually has much more trade volume and market cap. In fact, Tether is the most popular USD-based stablecoin in the world. It will let you store your dollars in the blockchain easily.
As Bitcoin (BTC) finally broke out of the $46,000 resistance on March 27, traders were quick to conclude that the bearish trend was gone for good. Even as the price hit its highest level in 84 days, derivatives metrics and Asia’s Tether premium still show a lack of bullish sentiment.
While analysts will struggle to find a rationale for the modest 5.8% 24-hour gain that pushed Bitcoin above $48,500, we still have to account for the daily 3.8% average volatility.
For instance, over the past 12 months, BTC presented a daily swing higher than 5.8% in 44 instances, ranging from a negative 14.4% on May 19, to a 14.6% price increase on Feb. 28.
Bitcoin’s rally caused the broader crypto market capitalization to hike 15.3% over the past week, reaching $2.2 trillion. Curiously, Bitcoin gained 15.7% and Ether (ETH) 15.8%, pretty much in line with the altcoin’s average.
Still, they were no match for the altcoin rally that followed. Below are the top gainers and losers among the 80 largest cryptocurrencies by market capitalization.
Weekly winners and losers among the top-80 coins. Source: Nomics
Zilliqa (ZIL) announced a partnership with payments infrastructure provider Ramp, and is expected to release its metaverse project called Metapolis which will be built on unreal gaming engine, the same 3D technology behind Fortnite and PlayerUnkown’s Battlegrounds, or PUBG.
Axie is also expected to launch the Origin game over the next couple of weeks, which includes a reimagined storyline and the addition of active cards for eye and ear body parts.
Tether premium indicates weak retail demand
The OKX Tether (USDT) premium is a good gauge of China-based retail trader demand for crypto. It measures the difference between China-based USDT peer-to-peer trades and the official U.S. dollar currency.
Excessive buying demand tends to pressure the indicator above fair value, which is 100%. On the other hand, Tether‘s market offer is flooded during bearish markets, causing a 4% or higher discount.
Tether (USDT) peer-to-peer vs. USD/CNY. Source: OKX
Currently, the Tether premium stands at 99.9%, which is neutral. Thus, data shows retail demand is not picking up despite the price improvement, which is odd considering that the total cryptocurrency capitalization jumped 15.3%.
Funding rates show undecided traders
Perpetual contracts, also known as inverse swaps, have an embedded rate that is usually charged every eight hours. Perpetual futures are retail traders‘ preferred derivatives because their price tends to track regular spot markets perfectly.
Exchanges use this fee to avoid exchange risk imbalances. A positive funding rate indicates that longs (buyers) demand more leverage. However, the opposite situation occurs when shorts (sellers) require additional leverage, causing the funding rate to turn negative.
Weekly winners and losers among the top-80 coins. Source: Nomics
Notice how the accumulated seven-day funding rate is uneventful in most cases. This data indicates a balanced leverage demand between longs (buyers) and sellers (shorts).
For example, Solana’s (SOL) positive 0.20% weekly rate equals 0.8% per month, which is not a burden for traders building futures positions. Typically, when there‘s an imbalance caused by excessive optimism, that rate can easily surpass 5% per month.
Some might say that the Bitcoin price hike above $47,000 was the nail in the coffin for the bears because the cryptocurrency displayed strength during global macroeconomic uncertainty.
At the moment, there are no signs of bullishness from Asian retail traders, as measured by the CNY Tether premium and there is no indication of pressure from leverage longs (buyers) on futures markets. Therefore, the overall crypto market sentiment is neutral.
The views and opinions expressed here are solely those of the author and do not necessarily reflect the views of Cointelegraph. Every investment and trading move involves risk. You should conduct your own research when making a decision.
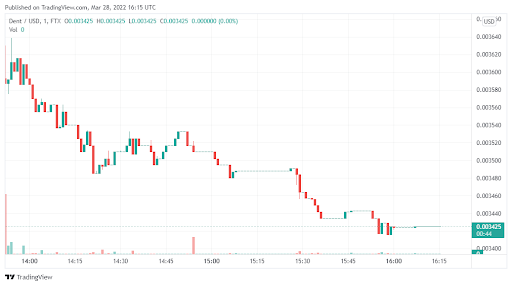
As the crypto market rallies at the start of the week, coins like Dent (DENT) have posted double-digit daily gains with weekly rallies of over 30% or so. But as with every bullish run, a pullback is always around the corner. For DENT, there seems to be a capped upward potential. Here is what you need to know:
The coin has rallied by 11% in the last 24 hours
Dent is also up by around 30% over the last 7 days.
The recent upswing is likely to continue before capping at a crucial resistance.
Data Source: Tradingview
Dent (DENT) – Why is upward momentum capped?
After gaining nearly 30% over the last 7 days, it seems like DENT still has some room to grow. However, we do not expect the coin to truly trend upwards for long. At the moment, DENT is trading at $0.034. There are two important resistance zones to watch.
The first one is the $0.035 mark, and the second is the $0.41. As of now, it seems like DENT is testing the first resistance zone but is yet to break through. In fact, in 24-hour trading, we saw some significant pullback from the morning sessions, where daily gains dropped from 15% to around 11%.
This could suggest that weakness at $0.35 is coming, and DENT may as well fail to surge past that first hurdle. If indeed this happens, DENT is likely to fall sharply before the end of the week. But if bulls can rally above $0.35, then $0.41 will be next.
Is DENT worth buying?
There is no momentum right now, to be fair. Yes, the coin has pushed up in the last 7 days, but we expect it to trade mostly sideways in the coming days as bulls try to smash past the crucial resistance we have talked about above. It would therefore be better to wait until the price has pulled back slightly.
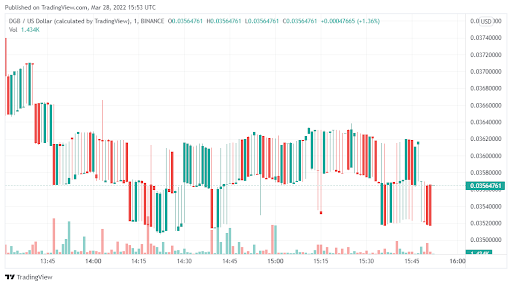
DigiByte (DGB) has surged over the last 24 hours in what appears to be a decisive bullish breakout. The coin has also been rising over the past month and has reclaimed a lot of losses seen this year. But how much momentum does it actually have? More details are below but first, here are some important points:
DGB is up around 90% over the last 30 days and over 100% in 14 days.
The coin had managed to post 30% gains in 24-hour intraday trading.
There however remains a serious risk of a sell-off
Data Source: Tradingview
DigiByte (DGB) – Analysis of this uptrend
For the most part of 2022, DigiByte remained largely on a downtrend with a few bursts upwards here and there. But in the last 14 days, it seems the coin has just shot up, gaining nearly 90%. DGD is now testing $0.4. The last time it did this was in June last year.
The $0.4 mark will be a decisive resistance level. We expect investors to start locking in profits at around that price and as such, it is highly unlikely that DGB will cross over. Also, looking at the 3-day chart, the coin is poised for a significant pullback.
While this may not happen in a few days, overall, we expect DGB to be firmly rejected at $0.4 and will firmly fall towards $0.28 in the near term. This will be a downswing of more than 30%.
Is DigiByte (DGT) worth buying now?
The momentum that DGB has built over the last 14 days is about to slow. The coin is currently at $0.36. We believe the upside based on the chart is capped at $0.4. It wouldn’t, therefore, make any sense to buy now.
However, please watch the rejection at $0.4. DGB is likely to fall back by at least 30% to around $0.28. This would be the best price to enter once more.
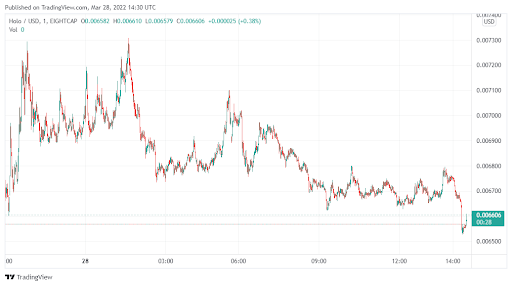
Holo Chain (HOT) has trended strongly upwards over the last few days. The coin has managed to post gains over the last three trading sessions in a row. As such, it has now turned bullish. But how far can it actually rise? We’ll discuss this more but first, some important facts:
The recent rally now means that HOT has smashed past its 30-day high
The coin has also regained over 50% from its lowest level this year.
HOT was also up by around 15% over the last 24 hours
Data Source: Tradingview
Holo Chain (HOT) – price prediction and analysis
Holo was already surging the past week. New announcements on the ecosystem last week had pushed 7-day gains to over 30%. However, for most analysts, the key to watch during that rally was the overhead resistance of $0.6.
Based on the price action today, it seems HOT has smashed that threshold. As a result, HOT is expected to keep the uptrend going and is likely to test $0.01 in the near term. This will represent gains of around 50% from the current price now.
Besides, HOT has also pushed above the average trading price of the last 30 days by over 50%. This indicates that investors are bullish about the coin and the recent gains we have seen are bound to continue. The only way this bullish momentum slows is if bulls fail to keep the price above $0.06.
Why Could Holo Chain (HOT) be perfect?
In the short term, we expect HOT to run a bit further. In fact, gains of at least 30% appear likely in the week ahead. But for long-term investors, the fact that HOT still has a market cap of less than $1 billion means that there is quite some potential. It is likely the coin will hit $0.03 before the end of the year.
Bitcoin (BTC) and several altcoins surprised many with their newfound strength during the weekend. Bitcoin’s rally easily sliced through the $45,900 level, which according to Glassnode was an area of resistance because several investors had purchased near that level when Bitcoin was declining after hitting its all-time high in November.
Bitcoin’s strength may have attracted buying in several altcoins, which are still languishing below their 52-week high. The rally in Bitcoin and the bottom fishing in altcoins has boosted investor sentiment, pushing the Crypto Fear and Greed Index into the “greed” territory.
Interestingly, the crypto markets have held a large part of their gains despite the tepid performance of the U.S. stock markets on March 28. This suggests that the crypto markets may be in the early stages of decoupling from the equity markets.
Could buyers sustain the momentum and clear the overhead resistance levels? Let’s study the charts of the top-10 cryptocurrencies to find out.
BTC/USDT
Bitcoin hesitated on March 26 as seen from the inside-day candlestick. This indicated indecision among the bulls and the bears. This uncertainty resolved to the upside on March 27 as the bulls regrouped and propelled the price above the overhead resistance at $45,400.
BTC/USDT daily chart. Source: TradingView
The sharp rally of the past few days has pushed the relative strength index (RSI) into the overbought zone for the first time since October 2021. This suggests that the momentum favors the buyers.
The bears may attempt to stall the up-move at the resistance line of the ascending channel but if bulls overcome this barrier, the BTC/USDT pair could rally to the psychological level at $50,000 and later to $52,000.
If the price turns down from the resistance line, the buyers will try to flip $45,400 into support. If they succeed, it will suggest that the up-move may continue. The bears will have to pull and sustain the price below $45,400 to weaken the bullish momentum.
ETH/USDT
Ether (ETH) broke above the symmetrical triangle on March 25 but the bulls could not sustain the higher levels. However, the buyers did not cede ground to the bears and resumed their purchase on March 26.
ETH/USDT daily chart. Source: TradingView
The momentum picked up on March 27 and the ETH/USDT pair has reached $3,411 where the bulls may encounter a minor resistance. If bulls bulldoze their way through, the ETH/USDT pair could rally toward the psychological level at $4,000.
Alternatively, if the price turns down from $3,411, the pair could retest the breakout level from the triangle. If the price rebounds off this level, it will suggest strong buying on dips. The bulls will then again try to resume the up-move.
The bears will have to pull and sustain the price inside the triangle to suggest that the bullish momentum may have weakened.
BNB/USDT
BNB continued its northward march and has reached the overhead resistance at $445. The bears are likely to defend this level with vigor.
BNB/USDT daily chart. Source: TradingView
The rising 20-day exponential moving average (EMA) ($402) and the RSI near the overbought zone indicate that bulls are in control. If buyers thrust the price above $445, the BNB/USDT pair could rally toward the psychological level at $500. This level could again act as a strong resistance.
If the price turns down from $500 but does not break below $445, it will suggest that the bulls have flipped the level into support. That will increase the likelihood of a break above the overhead resistance.
Contrary to this assumption, if the price turns down from $445, the pair could drop to the 20-day EMA.
XRP/USDT
Ripple (XRP) turned up on March 26, indicating that bulls are buying on minor dips. The buyers pushed the price above the strong resistance at $0.86 but are facing resistance near $0.91.
XRP/USDT daily chart. Source: TradingView
Both moving averages are sloping up and the RSI is in the positive zone. If buyers do not allow the price to slide below $0.86, the prospects of a break above $0.91 increase. If that happens, the XRP/USDT pair could rally to the psychological level at $1.
This positive view will be invalidated if the price turns down from the current level or the overhead resistance at $0.91 and plummets below the moving averages. Such a move could pull the price to the strong support at $0.70.
ADA/USDT
Cardano (ADA) has continued its recovery and the price has reached the overhead resistance at $1.26 where the bears are likely to mount a strong defense.
ADA/USDT daily chart. Source: TradingView
The rising 20-day EMA ($1) and the RSI in the overbought zone suggest that bulls are in control. If the price turns down from overhead resistance but the bulls do not give up much ground, it will increase the possibility of a break above $1.26.
If that happens, the ADA/USDT pair could rally to $1.60 and then march higher toward $1.80. This bullish view will invalidate if the price turns down from the overhead resistance and breaks below the psychological level at $1.
LUNA/USDT
Terra’s LUNA token has been stuck in a tight range between the overhead resistance at $96 and the support at the 20-day EMA ($90). This tight-range trading could soon lead to a sharp trending move.
LUNA/USDT daily chart. Source: TradingView
The rising 20-day EMA and the RSI in the positive territory suggest that the path of least resistance is to the upside. If buyers propel and sustain the price above $96, the LUNA/USDT pair could retest the all-time high at $105.
This level is likely to act as a major obstacle but if bulls overcome it, the uptrend may resume. The pair could then rally to $125. This positive view will invalidate in the short term if the price turns down and breaks below the 20-day EMA. That could open the gates for a possible decline to $82.
SOL/USDT
After trading near the overhead resistance at $106 for a few days, Solana (SOL) broke and closed above the level on March 27. The moving averages have completed a bullish crossover and the RSI is near the overbought zone, indicating an advantage to buyers.
SOL/USDT daily chart. Source: TradingView
If bulls sustain the price above $106, the SOL/USDT pair could rise to $122. The bears are expected to defend this level aggressively. If the price turns down from this level and breaks below $106, it will suggest that the pair may remain range-bound for a few more days.
The bulls will have to clear the overhead hurdle at $122 to signal the start of a new potential uptrend. The pair could then start its up-move, which could reach the overhead resistance zone between $158 and $163.
Avalanche (AVAX) rebounded off the 20-day EMA ($83) on March 26, indicating that bulls are buying on dips. The buyers will now try to sustain the price above the immediate resistance at $92.
AVAX/USDT daily chart. Source: TradingView
If they succeed, the AVAX/USDT pair could rally to the overhead resistance zone at $98 to $100. This is an important zone for the bears to defend because a break and close above it could extend the rally to $120.
If the price turns down from the overhead zone, the bears will try to pull the pair to the moving averages. If the price rebounds off this level, the pair may remain stuck between the moving averages and the overhead zone for a few days.
DOT/USDT
Polkadot (DOT) picked up momentum on March 27 and has reached the stiff overhead resistance at $23. The upsloping 20-day EMA ($20) and the RSI near the overbought zone suggest that bulls have the upper hand.
DOT/USDT daily chart. Source: TradingView
If bulls drive and sustain the price above $23, the DOT/USDT pair could rally to $28. If bulls succeed in clearing this hurdle, the up-move may extend to $30 and later to $32.
Alternatively, if the price turns down from the overhead resistance, the bears will try to pull the pair to the 20-day EMA. A strong rebound off this support will suggest that bulls continue to buy on dips. That will increase the possibility of a break above the overhead barrier.
This positive view will invalidate if the price breaks below the moving averages. That could extend the consolidation between $16 and $23 for a few more days.
DOGE/USDT
The bulls flipped the 50-day simple moving average (SMA) ($0.13) into support on March 25. This attracted strong buying in Dogecoin (DOGE), putting it on the path to a possible rally to $0.17.
DOGE/USDT daily chart. Source: TradingView
The moving averages are on the verge of a bullish crossover and the RSI is near the overbought zone, indicating that buyers have the upper hand. If bulls drive the price above $0.17, the DOGE/USDT pair could rise to $0.22.
If the price turns down from $0.17 but does not give up much ground, it will suggest that the traders expect the recovery to continue.
Conversely, if the price turns down sharply from the current level or the overhead resistance, it will signal that the pair may remain range-bound between $0.12 and $0.17 for a few more days.
The views and opinions expressed here are solely those of the author and do not necessarily reflect the views of Cointelegraph. Every investment and trading move involves risk. You should conduct your own research when making a decision.