Category: NEWS

  • Making a crypto fortune is easy, but here are 5 rules to follow to keep it

    Making a crypto fortune is easy, but here are 5 rules to follow to keep it

    Investing in any financial asset can be a tricky exercise, but this is especially true for the fast-paced cryptocurrency market, which comes with its own unique set of pitfalls and challenges. 

    A popular saying dictates that it takes 10,000 hours to master a skill and become an expert. In cryptoland time, this is measured in market cycles, which subject each trader to a few trips on the roller coaster of volatility as a crash course on navigating the market.

    Here are five important lessons every trader should learn when it comes to investing in cryptocurrency bull markets.

    Rule #1: No one ever went broke taking profits

    Since the early days of crypto, the community has been proud of its “hodl” nature, with the volatility in the price of Bitcoin (BTC) and other tokens haven shaken coins out of paper hands and into those of the true believers who comprise today’s crypto aristocracy.

    Few like to bring up the “not your keys, not your crypto” movement anymore, partially due to the fact that liquidity and money velocity are important factors in a healthy functioning market, but also because simply hodling as the market rises and then falls has resulted in fortunes achieved on paper simply fading away with the onset of a bear market.

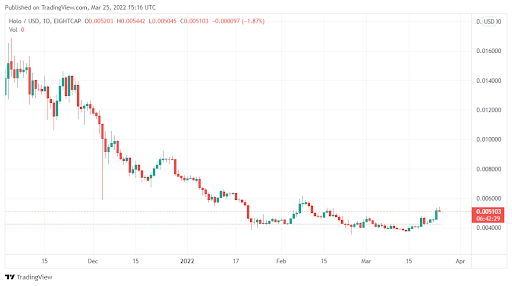
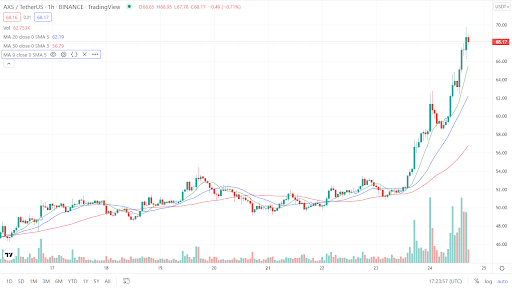
    When a cryptocurrency has made significant gains, especially if the price went parabolic in a near-vertical line on its trading chart, the best move is to take profits and allocate those funds either to stablecoins or different assets whose trading cycles are not exhausted.

    The fact of the matter is that nothing keeps going up forever, and in the cryptocurrency market, the fall can often be as fast and as hard as the rise.

    If selling a token is difficult due to personal attachments and a bullish long-term outlook, it helps to consider that after a parabolic move and consolidation phase, it’s possible to acquire even more of the tokens with the cashed-out funds once the dust settles.

    Rule #2: Don’t FOMO — there’s always another coin

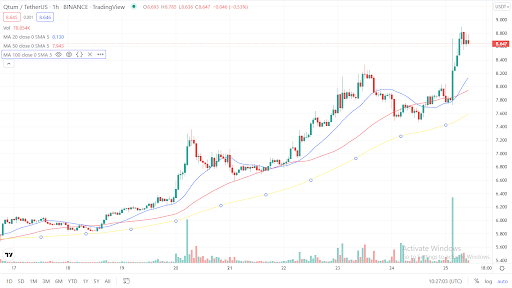
    One experience that just about every crypto investor has gone through is having the urge to buy a particular coin and resisting, only to see it take off like a rocket the following day and go on a two-week-long moonshot that sees its price increase tenfold.

    At this point, FOMO — the fear of missing out — kicks in and becomes so strong that a large market order is placed and filled at the top of the market. The result of this is usually some unexpected pullback where the newly opened position loses half its value in just a few short hours as early holders follow Rule #1 and take profits.

    Don’t FOMO!

    Once a coin has started going parabolic, just watch from the sidelines. Mentally congratulate those who caught the rally, and repeat the following: “There is always another token.”

    A quick survey of past bull markets will show boatloads of token pumps and token dumps in bull and bear markets, proving that there is no shortage of opportunities to get in early on high-flying projects and book solid gains amid the fast-paced hype cycles that the cryptocurrency market is known for.

    Rule #3: It isn’t going to be like last time

    Technical analysts often like to assert that crypto follows a series of predictable cycles, which they use to validate certain pieces of their craft. Holding this perspective allows them to apply past market cycles to the current price chart as a way to predict what comes next.

    In 2021, this belief led to yearlong proclamations that Bitcoin was going to $100,000 and beyond, only it topped out under $69,000 and limped into the close of the year without any sign of the highly anticipated blow-off top.

    Over the course of the year, the market was compared to the 2017 bull rally, then the 2013 rally and finally a combination of the two rallies as chartists struggled to explain in which part of the cycle the market was and where it would go next.

    In the end, the 2021 rally saw a unique double-top unlike any previous market cycle and could possibly extend into 2022 in alignment with the prediction by some that the four-year cycle is lengthening.

    The main takeaway is not to expect the market to perform as it has previously and focus on trading the market you have. Follow the trends in price, and make sure to keep Rule #1 and Rule #2 in mind.

    Related: US senators Lummis, Gillibrand reveal working on bipartisan crypto legislation

    Rule #4: Play trend cycles carefully

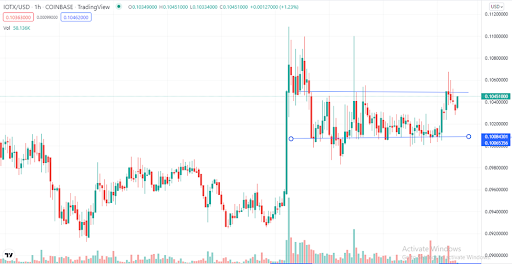
    In every crypto bull cycle, there is one sector that comes out of nowhere to dominate headlines and produce 100x gains.

    2021 saw the rise of memecoins, the arrival of nonfungible tokens (NFTs) and the advent of play-to-earn gaming, much to the chagrin of Bitcoin maximalists and those who “are in it for the tech.”

    When new trends like these begin to emerge in the cryptocurrency market, it’s wise to keep in mind the power of the cryptocurrency hype cycle and, if possible, get a little exposure to some of the tokens in that sector that have yet to start moving.

    This is strictly a mostly short-term play and is most often a case where Rule #1 is applied in full, as the vast majority of new arrivals to the altcoin market flare out within the first year.

    Rule #5: Don’t spend all your time focusing on the crypto market

    This final rule is meant to help maintain a healthy life balance and peace of mind. There is far more to life than investing in cryptocurrencies, or any other market.

    Just as all investment portfolios should be well-diversified, so too should your everyday experiences in the wider world.

    A vast majority of the big moves in crypto happen in a matter of days or weeks, and the rest of the year is full of sideways markets and rangebound trading.

    Conduct a decent amount of research, make your picks, follow Rule #1, and then use some of those profits in other parts of life to have more fun and diversify your experience to better enjoy the most precious commodity of all: time.

    Want more information about trading and investing in crypto markets?

    The views and opinions expressed here are solely those of the author and do not necessarily reflect the views of Cointelegraph.com. Every investment and trading move involves risk, you should conduct your own research when making a decision.

  • Holo Chain (HOT) is heating up right now – Here is why you should buy

    Holo Chain (HOT) is heating up right now – Here is why you should buy

    The crypto market in general is coming out of a period of consolidation over the last few weeks. Coins are surging, and Holo Chain (HOT) is one of them. In fact, HOT has been one of the top performers of the last week. Here is what you need to know:

    • The coin had surged by close to 10% over the last 24 hours

    • HOT is also up by around 30% over the last 7 days or so.

    • This uptrend is likely to maintain in the week ahead.

    Data Source” Tradingview 

    Why is Holo Chain (HOT) surging?

    The main reason why we saw a surge in HOT over the last few days was a new announcement on the ecosystem roadmap that looks to make the project huge. But even with that, HOT had actually shown a lot of bullish signs before. 

    For example, it had managed to cross above a crucial overhead resistance zone of $0.004. Also, the coin hit a monthly high at the start of the week. The bullish outlook still remains intact. In fact, we are watching to see if bulls can push the price above $0.006. 

    If this happens, we could see decisive gains that could target $0.01 in the near term. This will represent a 50% surge from the current price. But if the price falls below $0.004, then more weakness could ensue.

    Should you buy Holo (HOT)?

    Holo markets itself as a peer-to-peer chain that hopes to provide a fast and reliable infrastructure for the deployment of decentralised apps. The project is also introducing new tools to help bridge the gap between decentralized systems and centralized ones. 

    The fundamentals are indeed quite good, and we have seen a lot of resilience as far as HOT goes. In the longer term, we expect the price outlook to remain positive and upbeat.

  • Why QTUM could record even more gains going into April

    Why QTUM could record even more gains going into April

    • QTUM Rallies ahead of Binance Blockchain Week, where it is a premier sponsor. 

    • Binance Blockchain Week is a big deal and will draw crypto investors from across the globe. 

    • QTUM price action points to more gains in short to medium term.

    Qtum QTUM/USD has been one of the top-performing cryptocurrencies over the last 24-hours. In this period, QTUM is up by over 20% and gaining. While this is purely price action at play, there is a good chance that QTUM could sustain the rally over the next couple of days. This has a lot to do with the upcoming Binance Blockchain Week that will take place in Dubai on March 28th.

    QTUM will be the event’s premier sponsor, and quite naturally, this means it will attract a lot of attention. Under the current setup where bullish momentum is on the rise across the market, this could trigger a major rally in the price of QTUM into April. 

    For context on how big the Binance Blockchain Week deal is, it will have more than 80 influential speakers, over 10 panels and fireside chats, and over 10 keynotes. This means it will likely pay attention across the global crypto community, and even people who may not know how powerful QTUM is will likely be interested in the project. 

    However, besides the short-term attention, QTUM has all the hallmarks of a winner, especially now that bullish momentum is rising across the market. QTUM is a blockchain platform built on the Bitcoin UTXO but runs on PoS. This makes it energy efficient while leveraging on the simplicity of the Bitcoin code. The result has been huge adoption for Dapps, which can only grow going forward.

    QTUM moving averages point to further gains

    Source: TradingView

    In the last 24-hours, QTUM buying volumes have shot up. The 50-day and 100-day moving averages are looking up, while the 20-day moving average is outpacing them at an accelerated rate. This indicates that buying volumes are rising fast, and the price could rally even further in the short term.

    Summary

    QTUM is rallying at the moment and is up by over 20% in under 24-hours. QTUM is likely to get a boost from its sponsorship of the Binance Blockchain Week on March 28th. Long term, QTUM fundamentals are likely to drive its price even higher.

  • IoTeX price action points to a potential breakout – What could trigger it?

    IoTeX price action points to a potential breakout – What could trigger it?

    • IoTeX inked a deal with Google for global expansion.

    •  The IoT market is growing at a CAGR of 20%, which is a plus for IoTeX

    • The broader market is bullish, which is a plus for crypto with strong fundamentals like IoTeX 

    The cryptocurrency market has turned strongly bullish over the past week. IoTeX is one of those that have gained the most momentum and is up by over 20% in the last 48-hours alone. While this has a lot to do with the upside momentum across the market, IoTeX internal fundamentals are also a factor and we could see IoTX keep hitting higher prices both in the short term and long term.

    IoTeX IOTX/USD has positioned itself as one of the leading cryptocurrencies taking blockchain technology to the fast-growing IoT market. Through IoTeX, users of IoT devices can have more control over their data and interact with the internet more securely. 

    With the IoT market now worth $308.97 billion and expected to grow at a CAGR of 25% up to 2028, it’s a market all set to be worth trillions of dollars in the coming decades. For this reason, IoTeX has been inking high-profile partnerships that are likely to play well into its price dynamics in the future.

    Earlier in the month, it emerged that IoTeX was teaming up with Google to reach the global market better. According to the founder of IoTeX, adoption is growing at a rate of 20% a month, and with the partnership with Google Cloud, expansion can happen at an even more accelerated rate.

    IoTeX price consolidates after pump

    Source: TradingView

    After a massive pump on March 21st, IoTeX has been consolidating over the last few days. It continues trading between $0.104 and $0.10, but buying volumes are rising. If IoTeX has enough volumes to break the $0.104 resistance, it could test $0.15 pretty soon.

    Summary

    IoTeX has been one of the top crypto performers in the last few days. This has a lot to do with the pump across the market and IoTeX fundamentals that include a partnership with Google. IoTeX buying volumes are rising while the price consolidates, which points to a potential breakout in the short term. 

  • Price analysis 3/25: BTC, ETH, BNB, XRP, ADA, LUNA, SOL, AVAX, DOT, DOGE

    Price analysis 3/25: BTC, ETH, BNB, XRP, ADA, LUNA, SOL, AVAX, DOT, DOGE

    This week Bitcoin (BTC) and select altcoins broke above their immediate resistance levels and moved higher, which propelled the total crypto market capitalization above $2 trillion on March 24.

    One of the triggers that could have driven crypto prices higher was BlackRock CEO Larry Fink’s letter to shareholders where he said that the Russia-Ukraine conflict has opened up avenues for digital currencies to be used as a mode of settlement for international transactions.

    Another bit of news that may have aided the up-move in crypto prices was that Goldman Sachs redesigned its website with emphasis on the growth of digital assets and the metaverse, mentioning them as “megatrends.”

    Daily cryptocurrency market performance. Source: Coin360

    Apart from the increasing institutional interest, Minneapolis Federal Reserve President Neel Kashkari’s statement that the central bank could raise interest rates up to seven times in 2022 to curb inflation may also have boosted bullish sentiment in cryptocurrencies.

    Can bulls sustain the higher prices and build upon the up-move or will bears sell aggressively and trap the buyers? Let’s study the charts of the top-10 cryptocurrencies to find out.

    BTC/USDT

    Bitcoin closed above the immediate resistance at $42,594 on March 23, indicating that bulls absorbed the supply by the bears. That opened the doors for a move to $45,400 where the bears could again mount a strong defense.

    BTC/USDT daily chart. Source: TradingView

    Both moving averages have turned up gradually and the relative strength index (RSI) is in positive territory, indicating an advantage to buyers. If buyers push the price above $45,400, the BTC/USDT pair could rally to the resistance line of the ascending channel.

    If the bulls clear this obstacle, the pair could rise to the stiff overhead zone between the psychological resistance at $50,000 and $52,000.

    Any correction from the current level is likely to find support near $42,594 and the moving averages. The bears will have to pull and sustain the price below the moving averages to indicate that the bulls may be losing their grip.

    ETH/USDT

    The bulls are trying to sustain Ether (ETH) above the resistance line of the symmetrical triangle but the long wick on the candlestick suggests that bears are aggressively selling at higher levels.

    ETH/USDT daily chart. Source: TradingView

    The moving averages have completed a bullish crossover and the RSI has risen into the positive zone, suggesting that the path of least resistance is to the upside. If the price sustains above the triangle, the ETH/USDT pair could rally to $3,500 and later to the pattern target at $3,907.

    Contrary to this assumption, if the price re-enters the triangle, the bears will try to pull the pair to the moving averages. If the price rebounds off the moving averages, it will suggest that the sentiment remains positive and traders are accumulating on dips. That will increase the possibility of a break above the triangle.

    The bears will have to pull the price below the moving averages to negate the bullish view. The pair could then extend its stay inside the triangle for a few more days.

    BNB/USDT

    Binance Coin (BNB) has been consolidating in a large range between $445 and $350 for the past few days. There is a minor resistance at $425 but if bulls clear this hurdle, a move to $445 is possible.

    BNB/USDT daily chart. Source: TradingView

    The moving averages have completed a bullish crossover and the RSI is in the positive territory, which suggests a possible change in trend. A break and close above $445 could open the doors for a possible rally to $500.

    Alternatively, if the price turns down from the current level or the overhead resistance and breaks below the moving averages, it will suggest that traders may be booking profits near the resistance. That could keep the BNB/USDT pair stuck inside the range for a few more days.

    XRP/USDT

    XRP is facing strong resistance at $0.86. A minor positive is that the bulls have not allowed the price to break below the moving averages. This suggests that traders are not rushing to the exit.

    XRP/USDT daily chart. Source: TradingView

    If the price turns up from the current level or rebounds off the moving averages, the bulls will strive to clear the overhead hurdle at $0.86. If they succeed, the XRP/USDT pair could rally to $0.91 and thereafter rise toward the psychological level at $1.

    The rising moving averages and the RSI in the positive territory indicate advantage to buyers. This positive view will be negated in the short term if the bears sink and sustain the price below the 50-day simple moving average ($0.77).

    ADA/USDT

    Cardano (ADA) is attempting to start a new uptrend. When the bulls pushed the price above the overhead resistance at $1 on March 23, it was the first indication that the bears may be losing their grip.

    ADA/USDT daily chart. Source: TradingView

    The next level to watch on the upside is $1.26 where the bears will try to stall the relief rally. If the price turns down from the current level or the overhead resistance, the bears will try to pull the ADA/USDT pair to the critical level at $1.

    If the price rebounds off $1 with strength, it will suggest that the bulls have flipped the level into support. The buyers will then make one more attempt to clear the obstacle at $1.26. If they succeed, the next stop could be $1.60. This positive view will invalidate if the price breaks below $1.

    LUNA/USDT

    Terra’s LUNA token once again turned down from the overhead resistance at $96 on March 24 suggesting that bears are not willing to give up easily. The price could now slide to the 20-day exponential moving average ($89).

    LUNA/USDT daily chart. Source: TradingView

    If the price rebounds off the 20-day EMA, it will suggest that bulls are defending this level. The buyers will then make one more attempt to clear the overhead hurdle at $96. If they succeed, the LUNA/USDT pair could rise to the all-time high at $105.

    Conversely, if the price turns down and breaks below the 20-day EMA, it will suggest that traders may be booking profits due to the failure of the pair to rise above $96. The price could then drop to $82 and next to $75.

    SOL/USDT

    Solana (SOL) broke and closed above the 50-day SMA ($93) on March 23. This move also invalidated the bearish descending triangle pattern. Strong buying by the bulls has pushed the price to the immediate resistance at $106.

    SOL/USDT daily chart. Source: TradingView

    The moving averages are about to complete a bullish crossover and the RSI is in the positive territory, which indicates that bulls have the upper hand. If buyers drive the price above $106, the SOL/USDT pair could rally to $122.

    Alternatively, if the price turns down from the current level but bounces off the 20-day EMA ($91), it will suggest that the sentiment remains positive and traders are buying the dips. That will enhance the prospects of a break above the overhead resistance.

    A break and close below the 20-day EMA will suggest that the pair may consolidate between $81 and $106 for a few more days.

    Related: Beware the Bitfinex whale: New $45K BTC sell wall appears amid worries Bitcoin could retrace

    AVAX/USDT

    Avalanche (AVAX) has been trading between the overhead resistance at $92 and the moving averages. This suggests that bears are selling near $92 and bulls are buying on dips to the moving averages.

    AVAX/USDT daily chart. Source: TradingView

    If the price turns up from the current level or rebounds off the moving averages, the bulls will again attempt to clear the overhead hurdle at $92. If they manage to do that, the AVAX/USDT pair could pick up momentum. The bears may try to stall the rally at the psychological level at $100 but if bulls overcome this barrier, the rally could reach $119.

    This positive view will invalidate in the short term if the price breaks below the moving averages. Such a move will suggest that the pair may remain range-bound between $92 and $65 for a few more days.

    DOT/USDT

    Polkadot (DOT) has continued its upward journey which could reach the overhead resistance at $23. The bears are expected to mount a strong defense at this level.

    DOT/USDT daily chart. Source: TradingView

    If the price turns down from $23 but bulls do not cede ground, it will indicate that traders anticipate a move higher. That will increase the likelihood of a break above $23. If that happens, the DOT/USDT pair could rally to $28 and thereafter to $30.

    Conversely, if the price turns down from the current level or the overhead resistance and breaks below the moving averages, it will suggest that the bears are active at higher levels. That could keep the pair range-bound between $23 and $16 for a few more days.

    DOGE/USDT

    Dogecoin (DOGE) broke above the 50-day SMA ($0.13) on March 24 but the bulls are struggling to sustain the higher levels. This indicates that the bears are not ready to give up their advantage.

    DOGE/USDT daily chart. Source: TradingView

    The 20-day EMA ($0.12) has started to turn up and the RSI is in the positive territory, indicating that bulls have the upper hand. If the price rebounds off the moving averages, the bulls will again try to clear the overhead resistance and push the DOGE/USDT pair toward $0.17.

    Alternatively, if the price turns down and breaks below the moving averages, it will suggest that the breakout on March 24 may have been a bear trap. The sellers will then try to pull the pair to the strong support at $0.10.

    The views and opinions expressed here are solely those of the author and do not necessarily reflect the views of Cointelegraph. Every investment and trading move involves risk. You should conduct your own research when making a decision.

    Market data is provided by HitBTC exchange.

  • Ethereum price hits $3.2K as anticipation builds ahead of the ‘Merge’

    Ethereum price hits $3.2K as anticipation builds ahead of the ‘Merge’

    The week-long uptrend in the cryptocurrency market has begun to awaken bullish crypto investors and the successful March 15 launch of the Ethereum “merge” on the Kiln testnet has the community excited about the upcoming switch to proof-of-stake. 

    Data from Cointelegraph Markets Pro and TradingView shows that since the successful launch on Kiln, the price of Ether has climbed 25% from $2,500 to a daily high at $3,193 on March 25 as traders look to lock in their positions ahead of the merge.

    ETH/USDT 1-day chart. Source: TradingView

    Here’s a look at what analysts in the market are saying could happen with the price of Ether as the merge approaches and how the switch to POS could affect its price long term.

    A clear breakout from the downtrend

    The turnaround in Ether price over the past couple of weeks was succinctly addressed by crypto analyst and Justin Bennett, who posted the following chart highlighting the trend reversal that has occurred.

    ETH/USDT 1-day chart. Source: Twitter

    Bennett said,

    “Ether first higher high since early Nov. 2021. Probably nothing.”

    The merge will be a bullish development

    A deeper analysis of the effects the upcoming merge for Ethereum will have on its price was discussed by analysts from the independent global macro and crypto research house MacroHive, who noted that the merge “will have bullish implications for Ether.”

    According to MacroHive, “the prospect of being able to make a passive return on staked Ether will attract more investors into the space,” while the transition to proof-of-stake “will reduce Ethereum’s energy consumption by 99.95%.”

    This will in turn help to attract more institutional money into the Ethereum ecosystem as the Environmental, Social and Governance (ESG) concerns “around the energy consumption of mining/proof-of-work are mitigated.”

    The merge will also have a notable impact on the circulating supply of Ether as the net issuance will undergo a significant drop-off once completed as block rewards are replaced with Ether staking yields.

    MacroHive said,

    “This, coupled with the ongoing Ether burning should make Ether deflationary and this should be bullish overall.”

    Related: Crypto rallies to $2T market cap as institutions signal readiness to enter

    Merge could mirror Bitcoin halvenings

    A final bit of insight into the effects of the upcoming merge was put forth by options trader and pseudonymous Twitter user McKenna, who posted the following tweet likening the effects of the merge to that of Bitcoin halvenings.

    The overall cryptocurrency market cap now stands at $1.997 trillion and Ether’s dominance rate is 18.7%.

    The views and opinions expressed here are solely those of the author and do not necessarily reflect the views of Cointelegraph.com. Every investment and trading move involves risk, you should conduct your own research when making a decision.

  • Beware the Bitfinex whale: New $45K BTC sell wall appears amid worries Bitcoin could retrace

    Beware the Bitfinex whale: New $45K BTC sell wall appears amid worries Bitcoin could retrace

    Bitcoin (BTC) was up nearly 5% in 24 hours at the Wall Street open on March 25, but a new warning sign was giving traders cold feet.

    BTC/USD 1-hour candle chart (Bitstamp). Source: TradingView

    Bitfinex whale flips to sell mode

    Data from Cointelegraph Markets Pro and TradingView confirmed BTC/USD hitting multi-week highs of $45,137 on March 25 as Wall Street got underway.

    As $45,000 reappeared for the first time since the start of the month, however, so did all-too-familiar behavior among some of Bitcoin’s biggest investors.

    Attention turned to exchange Bitfinex on the day, a platform famous for large-volume traders, or whales, guiding short-term price action with their trades.

    As noted by popular trader Pentoshi, the entity that had purchased BTC at the last low near $34,000 had now put in a significant ask position beginning at $45,000.

    Blockware lead insights analyst William Clemente agreed, telling Twitter users that it was now “popcorn time” for the market.

    Cointelegraph contributor Michaël van de Poppe, meanwhile, flagged “a dozen” possible lower price targets should BTC/USD sweep liquidity at previous rejection points from March, these also lying just above $45,000.

    “I’m not saying I’m bearish at this stage, but while we’re making this build-up, I’m not really interested in longs at this point,” he said in his latest YouTube update.

    Only a rechallenge of $50,000, he added, would form the impetus to consider long positions.

    “No longs” on Ethereum, says trade

    Van de Poppe added that altcoins were also on the radar and that it would be interesting to see how Ether (ETH), in particular, deals with upcoming resistance.

    Related: What are the BTC price levels to watch as Bitcoin nears March peak?

    The top ten cryptocurrencies by market cap showed clear copycat strength on daily timeframes, led by ETH/USD, which matched Bitcoin’s 5% gains.

    Cardano (ADA), while dropping several percentage points on the day, was still up 35% compared to the same time last week, making it the top ten’s best performer.

    ADA/USD 1-day candle chart (Coinbase). Source: TradingView

  • Vanuatu prime minister says yes to Satoshi Island crypto project

    Vanuatu prime minister says yes to Satoshi Island crypto project

    It’s not every day that a country’s leader endorses a cryptocurrency project. Nayib Bukele, the President of orange-pilled El Salvador, was the first leader to endorse Bitcoin (BTC). 

    Now, the prime minister of Vanuatu, the Honourable Bob Loughman, has officially given the green light to Satoshi Island.

    The Vanuatu government approval, which Satoshi Island was happy to share with Cointelegraph. Source: SI

    Satoshi Island is the megaproject crypto utopia in the South Pacific tha recently disclosed to Cointelegraph its vision, progress and preparation. Hot on the heels of news that they received 50,000 citizenship nonfungible token (NFT) applications, the prime minister of Vanuatu has given his blessing to “watching the development of Satoshi Island unfold.”

    For the team at Satoshi Island, the endorsement is welcome news:

    “With this full endorsement from the prime minister of Vanuatu in hand, we can show everyone that Satoshi Island is as real as it gets, and the kind words of the PM inviting our community to their home could not be a warmer welcome.”

    Satoshi Island from above. Source: SI

    The official letter states that “the overnment of Vanuatu welcomes the Satoshi Island project and its community to our country,” while highlighting that “Vanuatu is looking for new ways to attract investment and people to our country.”

    The COVID-19 pandemic “severely affected the tourism sector,” a mainstay of the Vanuatu economy, contributing 34.7% to total GDP in 2019. According to World Bank data, visitor numbers to the paradise-like archipelago 2,000 km from Brisbane dropped from circa 300,000 to 80,000 in 2020.

    The team at Satoshi Island had previously told Cointelegraph that the “lack [of] tourism” was one of the pain points they wished to alleviate with their project. Fundamentally, however, the “crypto industry finally has a physical home” in Satoshi Island.

    Satoshi Island is a space for crypto enthusiasts to reside — not visit — living in sustainable build homes in a community organized by decentralized autonomous organizations, or DAOs, where ownership is represented by NFTs.

    Artist’s rendering of the Satoshi Island sustainable build homes. Source: SI

    Many of the past crypto megaprojects, from Akon City in Senegal to CryptoLand in Fiji, have failed. Satoshi Island’s successful team plans to “keep ideas on a need-to-know basis within the team until everything is in place to turn the idea into a reality.”

    Related: ‘Satoshi Island’ crypto utopia receives 50K citizenship NFT applications

    The team recommends that other planners “be very selective with the location and ensure it [is]logistically, environmentally and legally possible,” the continue suggesting to:

    “Be very selective with the location and ensure […] most importantly, owning the land before you release your project is an essential step to showing your target market that what you are promoting is real and not just a pipe dream.”

    With the prime minister of Vanuatu’s approval, the Satoshi Island crypto “pipe dream” is nearing reality.

  • Cardano pares most of its Q1 losses as ADA rebounds 60% in a month — What’s next?

    Cardano pares most of its Q1 losses as ADA rebounds 60% in a month — What’s next?

    Cardano (ADA) inched higher on March 25, putting itself on course recoup a great portion of losses that it had incurred in the first two months of this year.

    Cardano: not so bullish yet?

    ADA’s price jumped by around 7.5% in trading Friday, reaching $1.19 over a month after bottoming out at around $0.75. The Cardano token’s huge rebound move netted around 60% in gains. Nonetheless, it remained at the risk of losing its upside momentum in the coming weeks.

    At the core of this bearish analogy is a multi-month descending channel pattern, with a reliable track record of causing and limiting ADA’s rebound attempts simultaneously since September 2021.

    The channel’s upper trendline particularly has served as an ideal selloff zone, now being tested again as resistance, as shown in the chart below.

    ADA/USD daily price chart. Source: TradingView

    ADA’s daily relative strength index, now at 71.80, also alerts about its “overbought” nature. In a perfect scenario, an RSI reading above 70 leads to selloffs in an attempt to neutralize the underlying asset’s excessive valuation. That puts the Cardano token at an imminent pullback risk toward the descending channel’s lower trendline.

    More signs of ADA’s potential pullback move come from its weekly charts. Notably, the Cardano token’s rebound has been having it test its 20-week (near $1.21) and 50-week (near $1.31) exponential moving averages (EMA) as resistances. They were instrumental in capping ADA’s gains in January 2022. 

    ADA/USD weekly price chart. Source: TradingView

    Alex Benfield, analyst at Weiss Ratings, said ADA needs to reclaim $1.20 as support, a level that kept its bullish bias intact multiple times in 2021. He noted that if the Cardano token manages to do so, its likelihood of seeing a medium-term rally will be higher, adding:

    “Until it clears that resistance, this move is in danger of losing momentum,” 

    ADA “fundamentally bullish”

    Alexander Mamasidikov, co-founder of crypto wallet service MinePlex, believes Cardano’s interim outlook is bullish despite its overbought risks.

    Related: Charles Hoskinson cheekily admits: ‘I was wrong’ about DApp rollout

    The executive believes that ADA’s ongoing growth momentum is more fundamental than technical, noting that the token started spiking after it became one of the assets included in the Grayscale Investment’s new altcoin fund, dubbed Smart Contract Platform ex Ethereum fund (GSCPxE).

    “The growth is proof of how impressed investors are with respect to the revolutionary role of the Cardano blockchain in the fast-growing smart contract-powered evolution of Web3.0,” Mamasidikov asserted, albeit agreeing that levels near $1.50 could play spoilers to ADA’s upside move. Excerpts:

    “Drawing from ADA’s growth trajectory, the $1 price level remains the crucial support level while the coin’s resistance is pegged at $1.5 in the short to medium term.”

    The views and opinions expressed here are solely those of the author and do not necessarily reflect the views of Cointelegraph.com. Every investment and trading move involves risk, you should conduct your own research when making a decision.

  • Axie Infinity is rocketing – Here is why

    Axie Infinity is rocketing – Here is why

    A confluence of fundamentals and technical factors driving AXS price.

    • Axie Infinity was trading at a key support level when bullish momentum rose in the broader market. 

    • Axie Infinity has the benefit of being the largest and most popular play-to-earn gaming platform in the market.

    • Axie Infinity moving averages point to more gains in the short term. 

    Axie Infinity AXS/USD is one of the top crypto performers. In the past 7-days, Axie Infinity has been up by 32%, with most of the gains being recorded in the last 24-hours. The current pump is a mix of broader market momentum and the fact that Axie Infinity was trading at a key support level of $51.29 on the 100-day MA before the market started pumping. 

    That said, Axie Infinity’s core fundamentals are pretty strong, making it attractive to investors, especially now that it is trading at massive lows compared to its price in November 2021. 

    For instance, Axie Infinity is now the largest play-to-earn gaming platform in the market. As of February 2021, over two-thirds of NFT gaming transactions came from Axie Infinity. While Play-to-Earn games have slowed down in the past two months, Axie Infinity continues to command a lead in this space.

    This is a big deal because now that the markets are turning bullish again, gamers and creators looking to make money off NFT gaming will be drawn more into Axie for its dominance in the gaming market. 

    Axie Infinity trading in a bullish channel

    Source: TradingView

    In the last 24-hours, Axie Infinity has been trending up, and buying volumes have shot up. The momentum that Axie Infinity has at the moment is most evident in the moving averages. The short-term moving averages 20-day and 50-day moving averages are outpacing the 100-day MA with a huge margin. This indicates that AXS’s price is now rising at an accelerated rate compared to its price over a more extended period. 

    Summary 

    Axie Infinity is in a breakout after bouncing off major support in the past week. Rising bullish momentum across the market coupled with Axie Infinity’s strong fundamentals are adding to the upside momentum.