- Ontology price rose more than 50% to lead the top gainers across crypto.
- The altcoin gained as Bitcoin and Ethereum dropped, with the ONT price hitting a six-month high.
- ONT could retreat amid profit-taking.
Ontology has defied broader crypto dumping to skyrocket more than 55% to highs near $0.22, hitting its highest level in six months.
The uptick for Ontology (ONT) comes as the cryptocurrency market witnesses a significant uptick in sell-off pressure, with Bitcoin dropping to under $112k and Ethereum giving up gains after a new all-time high.

But as these top headline makers struggle, ONT is grabbing most attention amid its 55% price surge.
Ontology price spikes 55% to 6-month high
Ontology (ONT) has seen a remarkable 55% price surge, reaching an intraday peak of near $0.22, its highest level in six months.
The altcoin traded at lows of $0.13 in the morning session, but marched higher to reach levels seen at the start of February 2025.
With trading volume soaring by over 4,600% to more than $337 million, Ontology price stands out as one of the outperformers on the day.
As BTC and ETH pare gains, Ontology’s 24-hour gains come amid heightened activity around the decentralised identity protocol’s native token.
Mainstream adoption of artificial intelligence and blockchain has Ontology’s infrastructure for decentralised identity and data privacy, drawing significant interest.
🌐 Community Spotlight 🌐
The age of digital distrust is here.
Deepfakes, fake news & AI threaten our reality.
But there’s hope.
Discover how ONT ID anchors trust in the chaos.
👇https://t.co/a6rUeW6IeJ#AI #Web3 #DecentralizedIdentity
— Community article by @GinolaONT— Ontology – The Trust Layer for Web3 (@OntologyNetwork) August 21, 2025
The project’s focus on regulatory compliance for digital identity solutions and blockchain interoperability is a key cog in its adoption curve.
Analysts predict ONT could benefit from this outlook to target more gains.
Ontology price forecast: What’s the technical picture?
The price of Ontology breaking out as the rest of the market fights to hold onto recent gains suggests holders may have to deal with incoming downside pressure.
ONT going vertical will welcome a pullback, likely to a demand reload zone.
However, open interest in ONT has increased by over 617% to nearly $60 million.
This indicates trader confidence and speculative interest amid the token’s upward trajectory.
Ontology’s price outlook as open interest rises, combined with high trading volumes, suggests a potential bullish continuation.

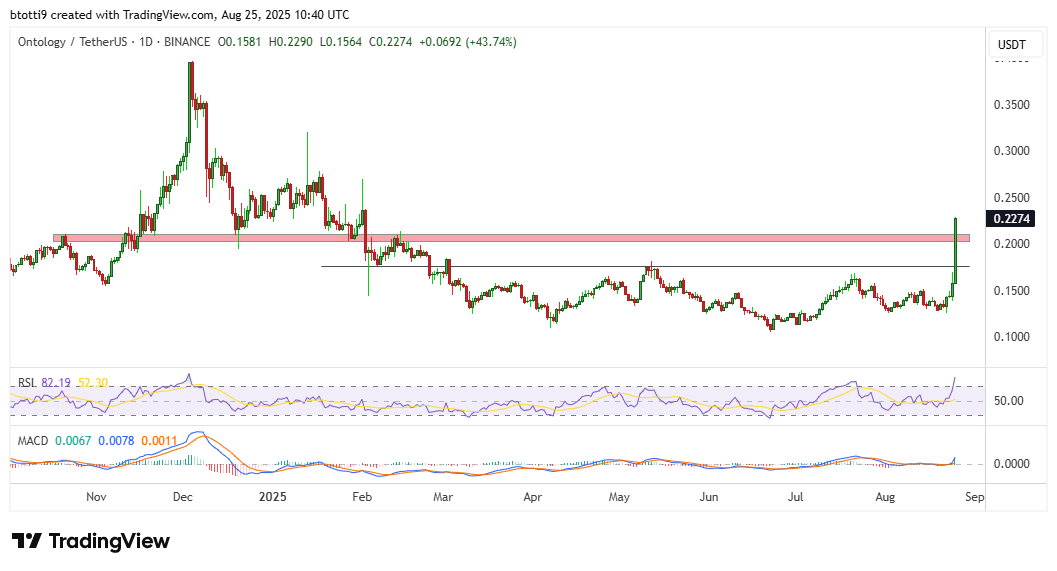
From a technical perspective, ONT is trading Relative Strength Index (RSI) on the daily chart at 81.
RSI at these levels shows the asset firmly in the overbought territory and thus leaning toward a reversal.
The Moving Average Convergence Divergence (MACD), however, shows a bullish crossover, indicating bulls have the upper hand and that a sustained rally may yet unfold if a retest allows buyers to establish a footing at key support levels.
On the daily chart, these areas lie around $0.20 and $0.17.
On the flipside, a break above $0.27 will allow buyers to aim for $0.40.