Convex Finance rallies as more DeFi protocols integrate it.
Convex is also benefiting from increased bullish momentum in the broader market.
Convex has broken through a key resistance level, indicating rising bullish momentum.
Convex Finance (CVX) has been one of the best cryptocurrency performers in the last 24-hours. This was triggered by the growing number of projects that are integrating Convex and offering investors a chance to earn a passive income off their Convex tokens.
For instance, On March 16th, Rari Capital announced the launch of the Tribe Convex Pool. This pool leverages some of the latest technologies, such as Flywheel and ERC-4626 plug-ins. Thanks to these technologies, investors will be able to use their Convex Finance tokens as collateral in the Fuss protocol when borrowing.
This came just days after another protocol, Enzyme, announced that Enzyme users could now use Convex to stake their Curve Finance tokens and grow their earnings. This is a big deal as it has increased the number of investors using Convex, which could translate to higher prices in the long run.
However, it is not just the integrations driving investor interest in Convex Finance. Convex is also in a market currently on an exponential growth path. DeFi is on a growth trajectory as investors take advantage of the space’s passive income opportunities. This means projects like Convex Finance, which offers investors a chance to increase their bags without trading, will only get more popular.
Convex is particularly interesting to investors because it is a relatively new project with a relatively small market cap. This means it has the potential to give an above-average return once the market turns bullish again.
Convex Finance breaks through key resistance
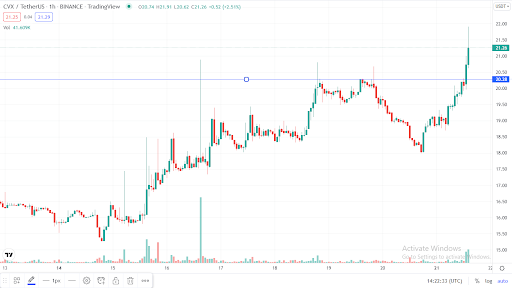
Source: TradingView
Convex Finance has been on an uptrend since March 20th, and bullish momentum is rising. Bulls are so strong that, Convex has broken through $20.26, a price level where it experienced significant resistance over the weekend. If it sustains the current momentum, then $25 would be within reach in the short term.
Summary
Convex is gaining momentum after a series of critical integrations with multiple DeFi protocols. Convex Finance is also benefiting from growing interest in DeFi, and the fact that bullish momentum is on the rise in the broader market.
Shiba Inu is trading in the direction of Bitcoin and the broader market. This is a good indicator as buying volumes are rising across the market.
Shiba Inu also has the support of its growing fundamentals, such as its Metaverse project.
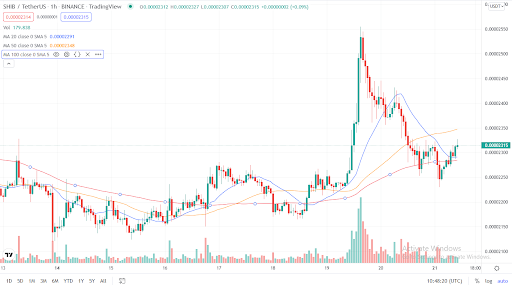
Shiba Inu has already crossed the 100-day MA resistance, a pointer to rising buying volumes.
Shiba Inu (SHIB) made history in 2021 after it recorded gains of 48,000,000% just a year after launch. Today, anyone who put in just $100 in SHIB in early 2021 is a multi-millionaire. However, with the market heavily bearish, it is only natural to wonder, is SHIB still a good investment in 2022? The answer is yes.
Like the rest of the market, Shiba Inu prices have been depressed for the past few months, so it is nothing unique to Shiba Inu. Besides, Shiba Inu’s price has been moving in tandem with the rest of the market, so you can expect SHIB to rise if the broader market gains upside momentum.
The best part is that bullish momentum seems to be on the rise in the broader market. For instance, Bitcoin has been gaining upside momentum in the last few days. While buying volumes are still relatively depressed, Bitcoin has managed to hold above the $40k support. This has also seen SHIB, and a host of other altcoins, gain upside momentum as well. If Bitcoin takes off from its current price, SHIB could rally as well.
Besides, the Shiba Inu team is working hard to add to the project’s intrinsic value. For instance, the team is currently building a Metaverse, a factor that will significantly add to the intrinsic value of SHIB going into the future.
SHIB breaks the 100-day MA resistance
Source: TradingView
In the last 24-hours, SHIB has been in a bullish reversal and has pushed through the 100-day MA resistance at $0.00002284. If bulls can sustain momentum and push through the 50-day MA at $0.00002348, Shiba Inu easily hit prices above $0.00002700 in the short term.
Summary
With buying volumes rising in the broader market, Shiba Inu has good prospects of rallying in the short term. Besides the price action, the Shiba Inu team is working on a Metaverse, which could help drive up the value of SHIB long term.
On Monday, Euroclear, a securities clearing firm that claims it has over 37.6 trillion euros in assets under custody, announced an investment into Fnality, a consortium of financial institutions focused on the regulated adoption of tokenized assets and marketplaces, for an undisclosed amount. Meanwhile, Euroclear is also focusing on developing its distributed ledger technology, or DLT, to settle digital securities against digital cash through the partnership.
The solution aims to increase the speed and efficiency of post-trade operations in areas such as market issuance, collateral trades and servicing interest payments. Founded in 2019, Fnality International said that it seeks to improve the efficiency of central banks for payment settlements. Its notable shareholders include Barclays, CIBC, Credit Suisse, ING, Mizuho Bank Nasdaq and UBS. Regarding the development, CEO of Fnality International Rhomaios Ram said:
“Welcoming Euroclear Group as an investor into the Fnality International consortium will significantly enhance the diversification of Fnality’s network and expand our footprint around Financial Market Infrastructure.”
Meanwhile, Lieve Mostrey, CEO of Euroclear Group, added: “We are pleased to be working with Fnality and our clients in shaping a solution on wholesale digital cash and digital securities settlement for the benefit of the whole industry.” Previously, Euroclear had led a central bank digital currency, or CBDC, experiment to settle French government bonds on the DLT in a partnership with the Banque de France. The Euroclear Group settled the equivalent of 992 trillion euros (roughly $1.09 quadrillion) in securities transactions in 2021 across 295 million transactions.
Data security and accessibility have become important issues of the modern age as the world slowly progresses towards a Web3 future that establishes blockchain technology as the underlying infrastructure for the new internet.
One project that is looking to capitalize on this growing trend by establishing tools for the new Web3 data economy is Ocean Protocol (OCEAN), a blockchain ecosystem that helps individuals and businesses unlock the value of their data and monetize it through the use of datatokens.
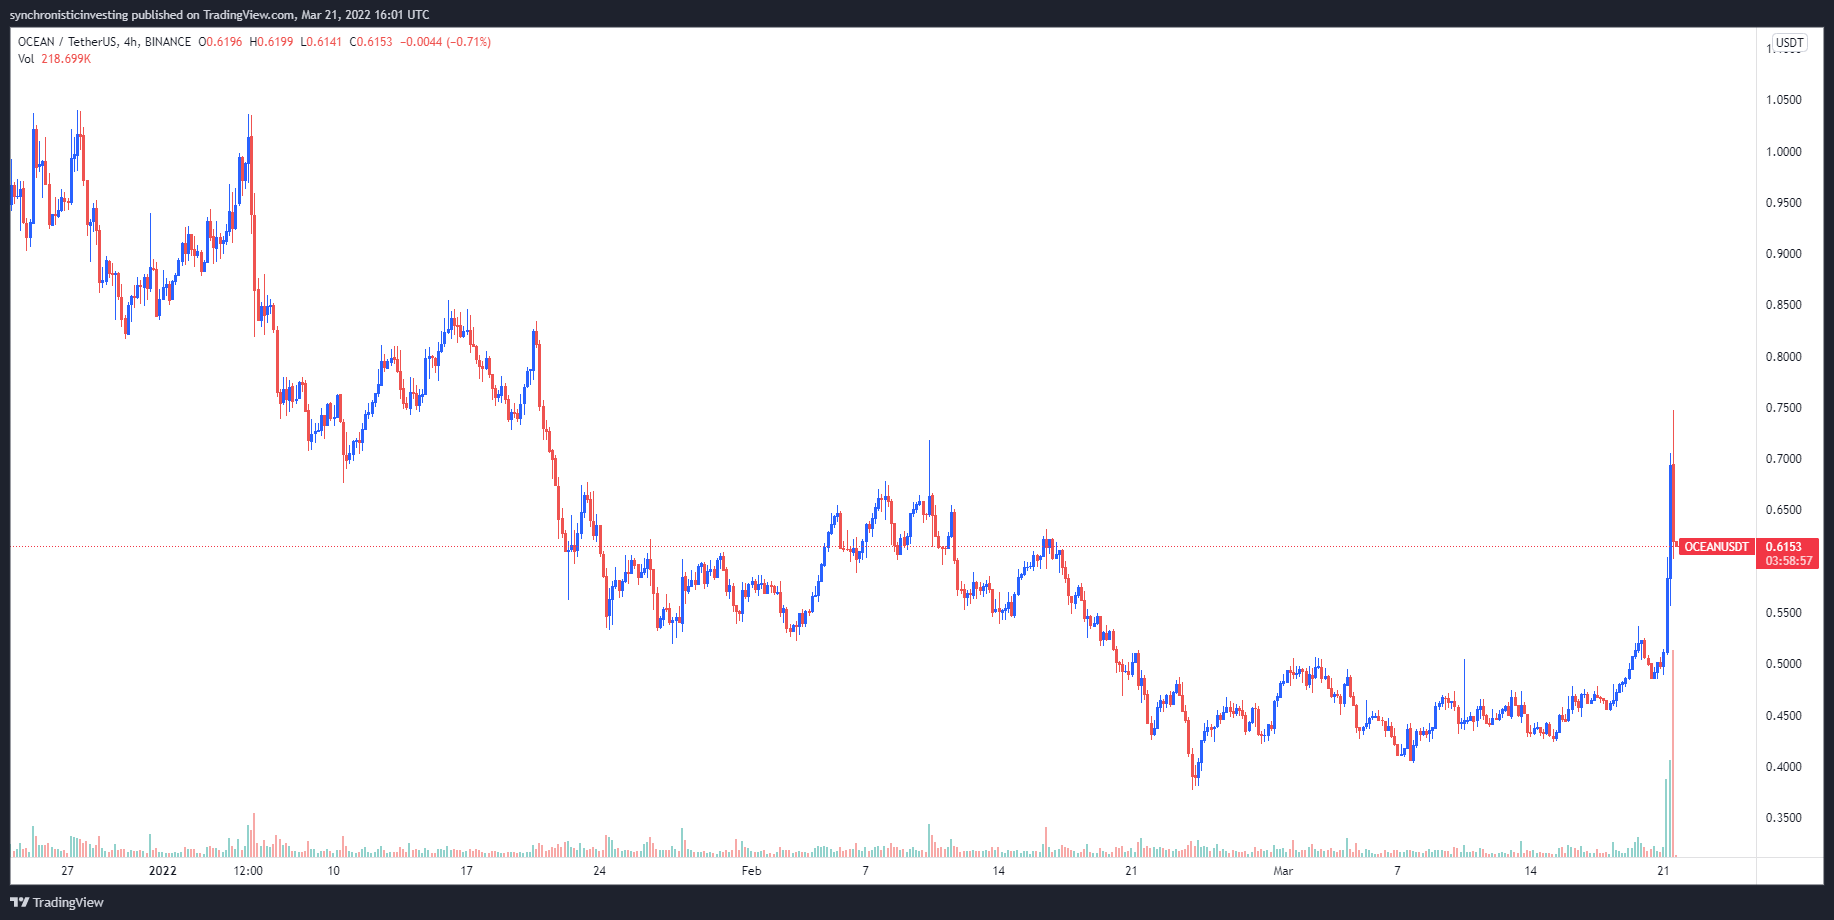
Data from Cointelegraph Markets Pro and TradingView shows that, over the past two weeks, the price of OCEAN has rallied 86.4% from a low of $0.40 on March 7 to a daily high of $0.748 on March 21 amid a 562% surge in its 24-hour trading volume to $321 million.
OCEAN/USDT 4-hour chart. Source: TradingView
There are three main reasons for OCEAN’s price rally: the upcoming launch of Ocean v4, the addition of new projects to the Ocean protocol, thanks to the ongoing OceanDAO grant program and an expanding list of data partners that bring real-world use cases to the ecosystem.
The upcoming launch of Ocean v4
One of the biggest developments boosting OCEAN’s momentum in March is the upcoming launch of Ocean v4, which is currently in public testing and is expected to go into production in the second quarter of 2022.
.@oceanprotocol is launching Version4 in the next weeks and it will get really interesting for data management and monetization.
Data X Defi =
Data IP: managed by NFTs (ERC721) Data consumption: managed by datatokens (ERC20)
According to the project, Ocean v4 will include several upgrades including a mechanism that purports to solve rug pulls in the datatoken pools by eliminating the initial datatokens provided to publishers. The new protocol upgrade will also see the introduction of data NFTs, which add nonfungible token capabilities to base intellectual property (IP) as a way to help increase revenue streams, as well as the addition of new ways for the community to monetized data.
Ocean v4 will initially be deployed on the Ethereum Virtual Machine (EVM) chains that currently support v3, including the Ethereum mainnet, Polygon, BNB Smart Chain, Moonriver and Energy Web Chain, and will be deployed on additional EVM chains over time.
OceanDAO grants
A second factor helping to strengthen the outlook for OCEAN is the ongoing OceanDAO grant process, which helps new projects launch on the network.
The Ocean Protocol Foundation originally announced its $140 million grant initiative back in October 2021 as a way to help fund projects in the Web3 data economy that were interested in using Ocean’s data markets and data unions.
OceanDAO recently completed the 15th round of grant rewards, which was won by TalentDAO, a protocol designed to address the lack of scientifically validated surveys for studying organizational health in the context of DAO contributors.
We continue with introducing the winning projects of the recently concluded @OceanDAO_ Round 15 to the Ocean Community @talentDAO_ is the latest grantee to have joined the Ocean ecosystem! pic.twitter.com/Qe9YHjRFgY
The addition of new data partners to the Ocean Protocol ecosystem is a third factor helping to boost the overall outlook of OCEAN as they represent real-world adoption of the Open Data Economy.
Dimitra Technology is the latest company to partner with Ocean as a way to help agricultural producers leverage blockchain technology and data to produce higher yields.
In this partnership, Ocean’s Web3 capabilities will be employed to enable data sharing and monetization so that small farmers can benefit from an extra layer of revenue.
The protocol has also announced the launch of Ocean Shipyard, which is designed to help fund entrepreneurs who are looking to build open-source Web3 solutions on Ocean Protocol and create value for the Ocean ecosystem.
VORTECS™ data from Cointelegraph Markets Pro began to detect a bullish outlook for OCEAN on March 19, prior to the recent price rise.
The VORTECS™ Score, exclusive to Cointelegraph, is an algorithmic comparison of historical and current market conditions derived from a combination of data points including market sentiment, trading volume, recent price movements and Twitter activity.
VORTECS™ Score (green) vs. OCEAN price. Source: Cointelegraph Markets Pro
As seen in the chart above, the VORTECS™ Score for OCEAN climbed into the green on March 19 and hit a high of 78 around 14 hours before the price increased 54% over the next day.
The views and opinions expressed here are solely those of the author and do not necessarily reflect the views of Cointelegraph.com. Every investment and trading move involves risk, you should conduct your own research when making a decision.
Bitcoin (BTC) and most major altcoins are attempting to start the new week on a positive note by bouncing off their respective support levels.
Goldman Sachs became one of the first major banks in the United States to complete an over-the-counter “cash-settled cryptocurrency options trade” with the trading unit of Michael Novogratz’s Galaxy Digital. This could encourage other major banks to consider offering OTC transactions for cryptocurrencies.
It is not only select nations that are showing growth in crypto adoption. A report by cryptocurrency exchange KuCoin shows that crypto transactions in Africa have soared by about 2,670% in 2022. Bitcoin Senegal founder Nourou believes that Africa could continue its thousand plus percent growth rates in the next few years.
Analyst Willy Woo speculated that Bitcoin’s four-year price cycle, based on the block subsidy halving, may not work as a predictive tool in the future as the price action is likely to be determined by supply and demand.
Could Bitcoin and altcoins climb above their overhead resistance levels? Let’s analyze the charts of the top-10 cryptocurrencies to find out.
BTC/USDT
Bitcoin is facing stiff resistance at $42,594, indicating that bears continue to sell at higher levels. The bears are attempting to pull the price below the moving averages while the bulls are trying to sustain the price above it.
BTC/USDT daily chart. Source: TradingView
Both moving averages have flattened out and the relative strength index (RSI) is near the midpoint, suggesting a balance between supply and demand. If the price slips below the moving averages, the BTC/USDT pair could drop to $37,000. Such a move will suggest that the pair could spend some more time inside the $42,594 to $37,000 range.
Conversely, if the price rebounds off the moving averages with strength, it will suggest that the sentiment has turned positive and traders are buying on minor dips. That may improve the prospects of a break above $42,594. If the price sustains above this resistance, the pair could rally to the overhead zone between $45,400 and the resistance line of the ascending channel.
ETH/USDT
Ether (ETH) turned down from the overhead resistance at $3,000 on March 19 but the bears could not pull the price below the moving averages on March 20. This suggests that bulls are buying on minor dips.
ETH/USDT daily chart. Source: TradingView
The bulls will attempt to push the price above $3,000 and challenge the resistance line of the symmetrical triangle. This is an important level to watch out for because a break and close above it will signal a possible change in trend. The ETH/USDT pair could then rally to $3,500.
Alternatively, if the price turns down from $3,000 or the resistance line of the triangle and breaks below the moving averages, it will suggest that the pair may extend its stay inside the triangle for a few more days.
BNB/USDT
Binance Coin (BNB) broke and closed above the 50-day simple moving average ($390) on March 17 but the bulls could not build upon this advantage. The long wick on the March 19 candlestick indicates selling at higher levels.
BNB/USDT daily chart. Source: TradingView
The BNB/USDT pair turned down and dipped to the 20-day exponential moving average ($386) on March 20. A minor positive is that the bulls have not allowed the price to slip below this level. This indicates that bulls are buying on dips.
If the price rises and breaks above $407, the up-move may continue and the pair could rally to $425. This level may act as a barrier but if crossed, the next stop could be $445.
On the contrary, if the price turns down and breaks below the 20-day EMA, it will suggest a lack of demand at higher levels. The pair could then slide toward $350.
XRP/USDT
XRP bounced off the 20-day EMA ($0.77) on March 18 and reached the downtrend line on March 19. The bears again defended this level but could not pull the price below the 20-day EMA. This suggests strong buying on dips.
XRP/USDT daily chart. Source: TradingView
Both moving averages have started to turn up and the RSI is in the positive territory, indicating that the path of least resistance is to the upside.
If bulls push and sustain the price above the downtrend line, the buying could pick up further and the XRP/USDT pair may rally to $0.91. If this level is also conquered, the next stop could be the psychological barrier at $1.
The bears will have to pull and sustain the price below the 50-day SMA ($0.75) to gain the upper hand.
The buyers have pushed the price to the stiff overhead resistance at $96 where the bears are mounting a strong defense.
If bulls overcome this hurdle, the LUNA/USDT pair could retest the all-time high at $105. The bulls will have to push and sustain the price above this level to signal the resumption of the uptrend. The rising 20-day EMA and the RSI in the positive territory indicate advantage to buyers.
Contrary to this assumption, if the price turns down and breaks below the 20-day EMA, several short-term traders may close their position. The pair could then drop to the strong support at $70.
SOL/USDT
Solana (SOL) attempted to break above the downtrend line on March 19 but the bears had other plans. They defended the level and pulled the price down to the 20-day EMA ($87) on March 20.
SOL/USDT daily chart. Source: TradingView
The buyers have successfully defended the 20-day EMA and will again attempt to push the price above the downtrend line.
If they manage to do that, the descending triangle pattern will be invalidated. The failure of a negative setup is a positive sign as it traps several bears who may have sold in anticipation of a breakdown. The SOL/USDT pair could then attempt a rally to $106 and later to $120.
Conversely, if the price turns down and breaks below the 20-day EMA, it will suggest strong selling at higher levels. The pair could then gradually dip to the support at $81.
ADA/USDT
Cardano (ADA) rose above the 20-day EMA ($0.86) on March 19 and the bulls held off attempts by the bears to pull the price back below the level on March 20. This suggests that the buyers are attempting to start a relief rally.
ADA/USDT daily chart. Source: TradingView
The bulls will now try to push and sustain the price above the overhead resistance at $1. If they succeed, it will suggest a possible change in trend. The ADA/USDT pair could then rally to the next overhead resistance at $1.26.
Alternatively, if the price turns down from the current level or the overhead resistance and breaks below the 20-day EMA, it will suggest that the pair may remain range-bound between $1 and $0.74 for a few more days.
Avalanche (AVAX) closed above the descending channel on March 18 and the bulls successfully defended the breakout level on March 20 and 21.
AVAX/USDT daily chart. Source: TradingView
The 20-day EMA ($78) has turned up and the RSI has jumped into the positive territory, indicating advantage to buyers.
If bulls drive and sustain the price above $93, the AVAX/USDT pair could rally to the psychological level at $100. The bears may attempt to stall the rally at this level but if bulls do not give up much ground, the likelihood of a break above it increases.
This bullish view will be negated if the price turns down from the current level and breaks below the moving averages.
DOT/USDT
Polkadot (DOT) broke and closed above the overhead resistance at $19 on March 19 but the bulls could not build upon this advantage. The bears used this opportunity and pulled the price back below $19 on March 20.
DOT/USDT daily chart. Source: TradingView
A minor positive is that the bulls have not allowed the price to break below the moving averages. The flattish moving averages and the RSI just above the midpoint suggest that the bears may be losing their grip.
If the price rises from the current level, the bulls will attempt to clear the overhead hurdle at $20. If they manage to do that, the DOT/USDT pair could rally to $23 where the bears may again pose a strong challenge.
This positive view will invalidate in the short term if the price breaks and sustains below the 20-day EMA ($18). That could open the doors for a possible drop to $16.
DOGE/USDT
Dogecoin (DOGE) broke and closed above the 20-day EMA ($0.12) on March 19 but the bulls could not sustain the higher levels. The bears pulled the price back below the 20-day EMA on March 20.
DOGE/USDT daily chart. Source: TradingView
The 20-day EMA is flattening out and the RSI is just below the midpoint, indicating that the selling pressure could be reducing. If buyers push and sustain the price above the 20-day EMA, the DOGE/USDT pair could rally to the 50-day SMA ($0.13). The bulls will have to clear this hurdle to open the doors for a possible rally to $0.17.
Alternatively, if the price turns down from the current level and closes below the intraday low formed on March 20, the pair could drop to the strong support at $0.10.
The views and opinions expressed here are solely those of the author and do not necessarily reflect the views of Cointelegraph. Every investment and trading move involves risk. You should conduct your own research when making a decision.
THORChain (RUNE) has appreciated nearly 41% in the past seven days, according to the data from Cointelegraph Markets Pro, and its recent price action is even leading the entire crypto market in the first quarter of 2021. Its mainnet launch, which was originally slated last year, is one of the main factors that led to its recent price surge. But, the other factor that provided added momentum is the integration of synthetic assets to its network. Why was this such a huge deal, and what are its implications for THORChain going forward?
THORChain is often compared to Uniswap since it provides users a way for traders to swap different tokens. The only difference is THORChain lets users trade layer-1 coins in a decentralized manner, whereas Uniswap is limited to only the tokens that are of the ERC-20 standard. Users can essentially swap their Bitcoin (BTC) for Ether (ETH) on THORChain without using a centralized exchange, and it claims to have processed more than 1.64 million transactions since inception.
The addition of synthetic assets to THORChain is expected to grow the network usage. Synthetic assets are, of course, virtually tokenized derivatives wherein it mimics the value of another asset. Synthetic assets, or synths, track real-world assets like stocks, commodities or even cryptocurrencies and traders use them for various reasons such as taking advantage of lower fees, performing faster transactions and access to 24/7 trading, among others.
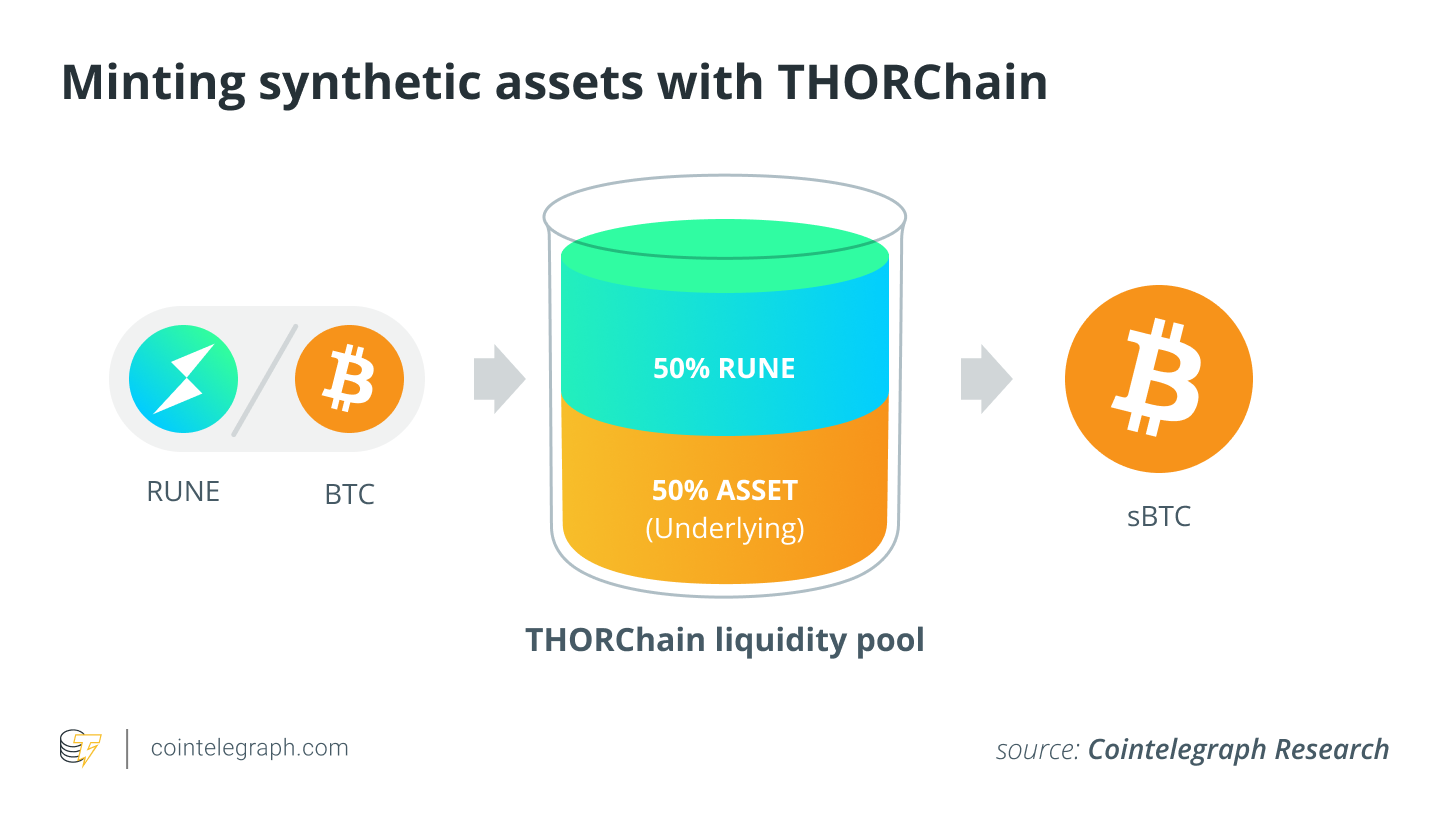
THORChain synths under the hood
THORChain allows users to mint synthetic versions of cryptocurrencies ranging from BTC to Aave (AAVE). To do this, users add either RUNE or the actual crypto asset to a THORChain liquidity pool. THORChain’s synths are pretty different from other synthetic assets, as synths from THORChain are not backed solely by the underlying asset and don’t require a high collateralization ratio.
For instance, Terra (LUNA) Mirror protocol, another platform for minting synths, has a 150% collateralization ratio. A THORChain synth, on the other hand, is backed by a liquidity pool that contains 50% of RUNE and 50% of the underlying asset. This is done through collateralization via pool ownership.
No impermanent loss
One of the main advantages boasted by THORChain is it removes impermanent loss, achieved by its protocol structure. THORChain maintains a reserve pool of RUNE tokens that it extracts from to pay block rewards for node operators and liquidity providers. It is also the same pool from which the system draws out the tokens needed to offset any difference in the synthetic asset’s exact value to that of the actual asset upon redemption, preventing impermanent loss.
Liquidity providers will have linear impermanent loss protection for 100 days, meaning that it incurs 1% protection daily until it reaches a full 100% coverage. At the time of writing, the reserve holds nearly $1 billion worth of RUNE, though it was actually past the billion-dollar mark a few months ago. The reserve is depleted from such token outflows but is replenished by network fees such as transfer fees and outbound fees (the gas cost of each chain multiplied by three).
How synths benefit users
Aside from the trading advantages mentioned earlier, THORChain synths are also cheaper to exchange than layer-1 assets while having a 50% reduction in swap fees when swapping asset to synth, synth to asset or synth to synth. But, perhaps its main selling point on offer is an uncomplicated and more lucrative way to yield farm. THORChain also has in its pipeline the capability for synth holders to earn a return by simply locking their assets in a vault. This makes the process approachable to newer participants, as they would no longer need to understand the concept of liquidity pools and the risks of impermanent loss.
THORChain has also integrated with Terra, catalyzing RUNE’s initial March rally. Lending and borrowing are also coming to the THORChain ecosystem by June 17. This is why many have been bullish to even call an $11.50 target for RUNE. Can RUNE maintain its rally going to the second quarter?
Cointelegraph’s Market Insights Newsletter shares our knowledge on the fundamentals that move the digital asset market. The newsletter dives into the latest data on social media sentiment, on-chain metrics and derivatives.
We also review the industry’s most important news, including mergers and acquisitions, changes in the regulatory landscape, and enterprise blockchain integrations. Sign up now to be the first to receive these insights. All past editions of Market Insights are also available on Cointelegraph.com.
A technical setup that preceded an 80% price rally in the Terra (LUNA) market in August 2021 has appeared again.
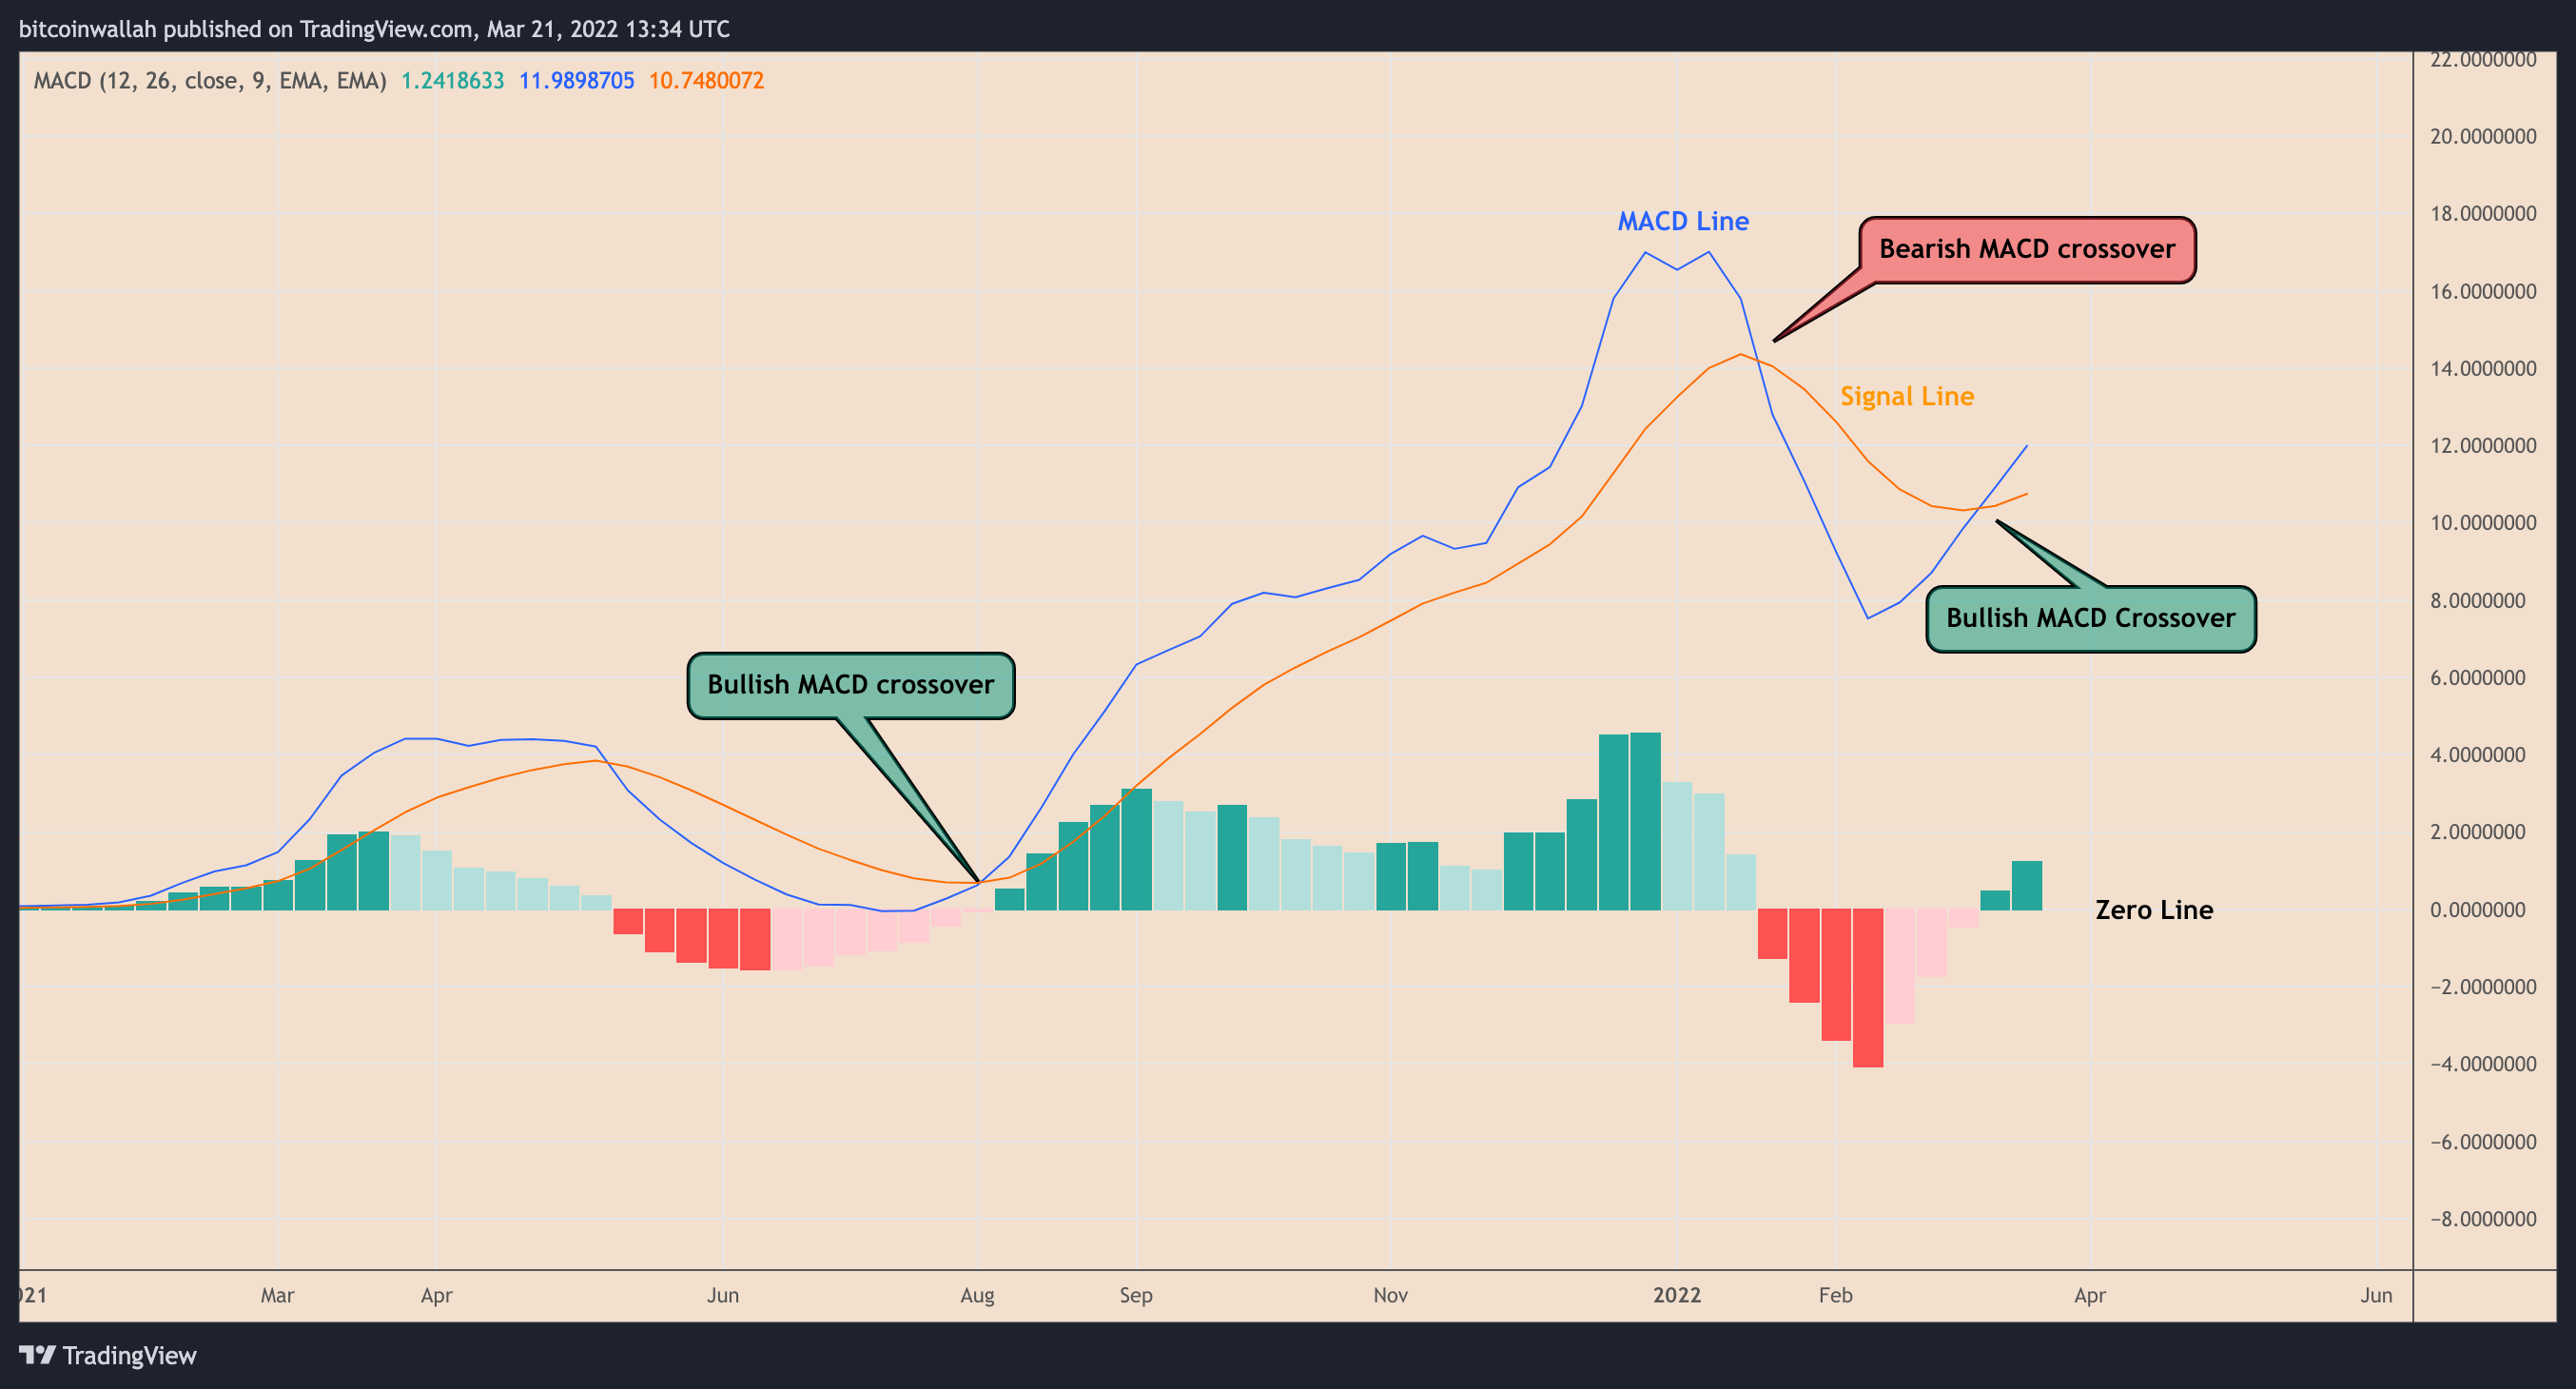
LUNA paints bullish MACD crossover
The technical setup involves a so-called “signal line crossover” between LUNA’s weekly MACD line — equal to the difference between the token’s 12-week and 26-week moving averages (MA) — and the nine-week MA called the signal line, plotted above the zero line, as shown in the chart below.
Together, these lines represent the moving average convergence divergence (MACD), a momentum oscillator to determine a market’s direction and momentum.
So, if the MACD line crosses above the signal line, markets interpret it as a bullish MACD crossover. Conversely, a bearish MACD crossover occurs when the MACD line falls below the signal line.
LUNA’s weekly MACD line closed above its signal line earlier this month, raising speculations about a strong bullish momentum ahead. For instance, independent market analysts Argonauts cited a similar bullish crossover from August 2021 that occurred before the token’s 80% price rally — from $12 to $102.
The MACD-based bullish outlook in the Terra market also stems from LUNA’s incredible price performance in the last 30 days.
Notably, LUNA’s price has surged by nearly 90% after bottoming out at $47.25 on Feb. 20, now eyeing a run-up above $100.
Nonetheless, LUNA’s strong upside move accompanies a decreasing momentum, as illustrated by its weekly relative strength index (RSI), and weakening trading volumes, suggesting bullish exhaustion is close.
Therefore, a pullback from levels near $100 could have LUNA retest its previous resistance-turned-support levels near $75.50 and $50, coinciding with the 0.236 and 0.5 Fib lines, respectively, of the Fibonacci retracement graph attached below.
LUNA’s close above its previous record high of around $106 could have it enter unchartered territory with a Fibonacci retracement graph drawn from a $102 swing high to a $45.50 swing low, suggesting an extended upside move toward $138.
On the other hand, a pullback move from levels near $100 could also trigger the classic double-top setup, which entails two high points in the market, signifying an impending bearish reversal signal. LUNA could paint one in the coming weeks, as shown in the chart below.
In a “perfect” double top scenario, the Terra token could risk crashing by more than 50% to $44 on the next pullback, followed by a breakout move toward $19.50, also coinciding with LUNA’s 50-week exponential moving average (the red wave).
The views and opinions expressed here are solely those of the author and do not necessarily reflect the views of Cointelegraph.com. Every investment and trading move involves risk, you should conduct your own research when making a decision.
SushiSwap (SUSHI), a community-led suite of decentralized finance (DeFi) tools, plans to implement a legal structure aimed at mitigating risks for token holders and members of the Sushi protocol.
Sushi’s new legal structure will be based on a community-approved proposal from Mar. 20 that cited the need for an association or foundation to help provide legal clarity and administrative support for SushiDAO.
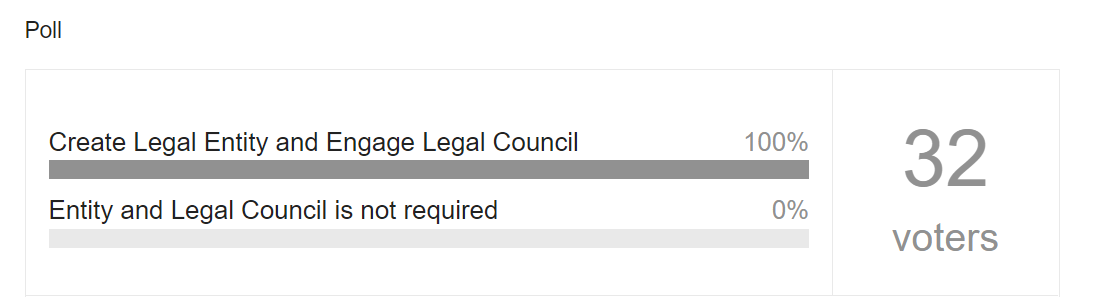
Proposal: Sushi Legal Structure
To form an association or a foundation for Sushi DAO in order to provide clarity regarding the rights and obligations of token holders and contributors and limit their liability and mitigate the future risk.$SUSHIhttps://t.co/SHpKcpvjqP
According to the proposer and a member of the SushiSwap community, Tangle, the intended foundation will play a key role in limiting the liability for contributors and, as a result, drive Sushi’s future growth.
Considering the possibility of risk mitigation and liability limitation via legal clarity for holders and contributors, the proposal received a 100% vote for the implementation of the legal structure.
Sushi Legal Structure proposal’s voting results. Source: Sushi forum
Tangle estimates an upfront expense of up to $100,000 and a recurring cost of $10,000 to set up the foundation:
“There are several jurisdictions which can be contemplated for forming a DAO entity, but Swiss Association law is currently the leading solution.”
Estimated budget for foundation. Source: Sushi forum
In order to build the foundation, the Sushi community will implement a four-step process, which includes determining and establishing the members, token distribution and transfer along with the draft articles of the foundation.
The proposal also includes the need for service entities including “DevCo services entity and any other core contributor entities.” Individuals residing in crypto-friendly jurisdictions will be considered ideal candidates for being a member of the foundation.
Adding to the discussion, community members highlighted the importance of defining the foundation’s use and what it owns:
“It’s definitely a must, it’s really the time for Sushi to update itself and to have a legal shield ready for all contributors.”
As smaller crypto communities slowly seep into the mainstream, foundations play a crucial role in dictating the future roadmap and relevance of the project. In an attempt to sieve imitators, the Dogecoin Foundation registered “Doge,” “Dogecoin,” and its associated logos as trademarks in the European Union.
Much success. It’s a small victory that seems so very irrelevant given all that’s currently happening in the world, but it’s an important step.
As Cointelegraph reported, the Dogecoin Foundation faced numerous issues with the misuse of its name and imagery. According to ex-director Ross Nicoll, several parties were registering trademarks for Dogecoin, and “in the summer of 2021, there was a potential lawsuit against the developers from someone who claimed we were responsible for their funds.”
We ask the buidlers in the blockchain and cryptocurrency sector for their thoughts on the industry… and throw in a few random zingers to keep them on their toes!
This week, our 6 Questions go to John deVadoss, the head of development at Neo — an open-source blockchain development platform — and a governing board member at the Global Blockchain Business Council, an industry association for the blockchain technology ecosystem.
I am proud to say that I build the best developer tools in the blockchain industry for N3. I also build the tools for the Token Taxonomy Framework as part of the Global Blockchain Business Council, where I serve as a governing board member. In addition, I serve as co-chair of IEEE Blockchain.
Previously, I was a co-founder of the InterWork Alliance, which is now part of the GBBC. Earlier, I was a general manager at Microsoft for close to two decades, during which I built out the architecture for .NET v1, Visual Studio Tools, the Microsoft Application Platform, Microsoft Digital (which I scaled to billion-dollar P&L) and more. I led the early service-oriented architecture and cloud architecture incubation initiatives for Microsoft, which led to Azure.
1 — Which people do you find most inspiring, most interesting and most fun in this space?
This is a wonderful question. I find the young men and women in our community and industry the most inspiring. The young people I meet with and have the opportunity to work with possess boundless energy and enthusiasm, and they are not willing to take no for an answer. They come in without any constraints, without any baggage of what can or cannot be accomplished, and without any preconceived notions of what should or should not be. They have no chip on their shoulder, nor do they have any sense of privilege or lack thereof. They just want to build — and I get tremendous energy (selfishly speaking) from working with them.
2 — What does decentralization mean to you, and why is it important?
Decentralization is first and foremost about the sovereignty of the individual. Individual sovereignty, whether from a natural-rights perspective (bestowed by God, nature or reason) or a legal-rights perspective (and as enshrined in the charter of the UN and subsequent international treaties), implies individual autonomy.
When understood as the capacity to decide for oneself and pursue a course of action in one’s life, individual autonomy implies individual self-governance. And self-governance is what decentralization means to me, and it’s why this is so important. In practical terms, this may be an asymptotic pursuit; however, the pursuit of self-governance at the individual level is our mission as a community and an industry.
3 — Do you subscribe to the idea of Bitcoin as a means of payment, as a store of value, as both… or as neither?
Bitcoin is a store of value. You can choose to use Bitcoin as a means of payment; however, you will live to regret it.
Compared with other stores of value, Bitcoin empowers you to own your keys and obviates the counterparty risks typically associated with other stores of value, including gold and silver. (Remember, your assets may not really be your assets if they happen to be someone else’s liabilities.)
With that baseline view, it is important to understand that Bitcoin is also a protocol — a set of rules, constraints, and schemas used to transfer value and settle with finality within the Bitcoin network. And it’s all accomplished in a secure, tamper-proof, uncensorable, fully transparent manner.
4 — What’s the unlikeliest-to-happen thing on your bucket list?
Perhaps, the unlikeliest-to-happen thing on my bucket list is becoming a rice farmer.
I harbor aspirations — visions, perhaps — that I will play a role in taking agriculture back to first principles. Never say never.
5 — What’s the most interesting place you’ve ever visited, and why?
The Oracle of Delphi is probably the most interesting place I have ever visited.
Why? Because the Oracle could not tell you anything upfront. You had to ask the question and frame it so that the Oracle could respond with a yes or no. The principle that it is up to us, up to you and me, to frame and ask the question is something that I find humbling and elevating.
In today’s world, we rely more and more on “experts,” both human and machine. I believe that the parable of the Oracle of Delphi teaches us how to work with “experts.”
6 — If you didn’t need sleep, what would you do with the extra time?
If I did not need sleep, I would write more. There is so much to write and so little time.
I want to write about economics, about philosophy, about anthropology, about biology, about psychology, about math, about cognition, about astronomy, about history and more. It is all there in my mind; I can visualize the ideas and sometimes even the words themselves, and yet, I need the time to transcribe them onto paper.
A wish for the young, ambitious blockchain community:
Bitcoin (BTC) rose above $42,000 on March 19 but the bulls continue to face a strong challenge from the bears at higher levels.
Although Bitcoin’s price has recovered from $37,578 on March 13, Cointelegraph market analyst Marcel Pechman highlighted that the long-to-short net ratio of top traders across three major exchanges shows that professional traders have not been buying aggressively.
But while Bitcoin struggles at higher levels, select altcoins are showing strength. Twitter account BTCFuel anticipates that altcoins could be entering “the final leg up of the hype phase” and may peak in the Summer.
Glassnode data shows that investors have withdrawn roughly 550,000 Ether (ETH) from centralized exchanges year-to-date. Due to the outflows, the exchanges’ net Ether balance has plummeted from 31.68 million Ether in June 2020 to 21.72 million Ether.
Could Bitcoin hold above the psychological level at $40,000 and will that shift focus to altcoins? Let’s study the charts of the most notable five cryptocurrencies to find out.
BTC/USDT
Bitcoin is facing resistance near $42,594 which suggests that traders are cautious at higher levels. The price could now slide to the moving averages, which is an important support to keep an eye on.
BTC/USDT daily chart. Source: TradingView
If the price rebounds off the moving averages, it will suggest that the bulls are not waiting for a deeper correction to buy. That could improve the prospects of a break and close above the overhead resistance. If that happens, the BTC/USDT pair could rally to $45,400 and later to the resistance line of the ascending channel.
Contrary to this assumption, if the price turns down and breaks below the moving averages, the pair could slide toward $37,000. A bounce off this support will suggest that the pair may remain range-bound between $37,000 and $42,594 for a few days.
The bears will have to pull and sustain the price below the support line of the channel to signal the resumption of the downtrend.
BTC/USDT 4-hour chart. Source: TradingView
The 4-hour chart shows that bears are defending the overhead resistance at $42,594. If the price rebounds off the 20-exponential moving average, the bulls will attempt to push the pair above the overhead resistance. If they manage to do that, the pair could rally toward $45,400.
Conversely, if the price slips below the 20-EMA, it will suggest that the short-term traders may be selling near the overhead resistance. That could open the doors for a possible drop to the 50-simple moving average. If this support cracks, the decline could extend to $37,000.
LUNA/USDT
Terra’s LUNA token rebounded off the 20-day EMA ($86) on March 18, indicating strong buying at lower levels. Both moving averages are sloping up and the relative strength index (RSI) is in the positive territory, indicating an advantage to buyers.
LUNA/USDT daily chart. Source: TradingView
If buyers drive and sustain the price above $96, the LUNA/USDT pair could challenge the all-time high at $105. A break and close above this resistance will suggest the resumption of the uptrend. The pair could first rally to $115 and then to $125.
Alternatively, if the price turns down from $96, the pair could again drop to the 20-day EMA. A break and close below this support will suggest that the bullish momentum is weakening. The pair could then slide to the strong support zone at $75 to $70.
LUNA/USDT 4-hour chart. Source: TradingView
The pair has been consolidating between $85 and $96. Although the bears had pulled the price below $85, they could not sustain the lower levels. This indicates strong buying on dips. Both moving averages are crisscrossing each other, suggesting a range-bound action in the near term.
If the price rises above $96, the advantage will shift in favor of buyers and the pair could then rally to $105.
Conversely, if the price turns down from $96, the pair could drop to the moving averages and then to $85. The bears will have to pull and sustain the price below the $85 to $82 support zone to signal the start of a deeper correction.
AVAX/USDT
Avalanche (AVAX) broke and closed above the downtrend line of the descending channel on March 18, indicating a possible change in trend. However, the bears have other plans and are currently attempting to pull the price back below the breakout level.
AVAX/USDT daily chart. Source: TradingView
If the price turns down from the current level but rebounds off the downtrend line of the channel, it will suggest that the breakout is valid. That increases the possibility of a rally to the psychological level at $100. The rising 20-day EMA ($78) and the RSI in the positive zone indicate advantage to buyers.
Conversely, if the price re-enters the channel and breaks below the moving averages, it will indicate that the recent breakout was likely a bull trap. That may catch several buyers off guard, resulting in a possible decline below the uptrend line.
AVAX/USDT 4-hour chart. Source: TradingView
The 4-hour chart shows that the rise above the channel had pushed the RSI into the overbought territory. This may have resulted in profit-booking from short-term traders. The pair could now drop to the 20-EMA, which is likely to act as a strong support.
If the price rebounds off this level, it will suggest that the sentiment has turned bullish and traders are buying on dips. That will increase the likelihood of the continuation of the up-move.
On the contrary, a break and close into the channel will suggest that the bullish momentum has weakened. That could pull the pair down to the 50-SMA.
Ethereum Classic (ETC) picked up momentum after it broke and closed above the downtrend line. Strong buying has pushed the price near the stiff overhead resistance at $38. The bears are likely to defend this level with vigor.
ETC/USDT daily chart. Source: TradingView
If the price turns down from the current level, the ETC/USDT pair could drop to $32. The 20-day EMA ($28) has started to turn up and the RSI is in the overbought zone, putting the advantage with the buyers.
If the price does not give up much ground from the current level or rebounds strongly off $32, the bulls will again try to clear the overhead hurdle at $38. If they succeed, the pair could rally to $45 and thereafter to $50.
Alternatively, if the price turns down and breaks below $32, the next stop could be the 20-day EMA. A break and close below this level will suggest that bears are back in the game.
ETC/USDT 4-hour chart. Source: TradingView
The 4-hour chart shows that the pair embarked on a vertical rally after breaking out of the downtrend line. This pushed the RSI deep into the overbought territory. Such overbought levels are usually followed by sharp declines.
The pair could drop to the 38.2% Fibonacci retracement level at $33 and later to the 50% retracement level at $32. The bulls are likely to defend this zone aggressively. If the price rebounds off this support zone, the buyers will attempt to drive the pair above the overhead resistance and resume the uptrend.
The bullish momentum may weaken on a break and close below $32. The pair could then drop to the 61.8% Fibonacci retracement level at $30.
EGLD/USDT
Elrond (EGLD) broke and closed above the moving averages on March 15, indicating that bulls are attempting a comeback. The bears have been attempting to pull the price back below the moving averages but the bulls have thwarted their efforts.
EGLD/USDT daily chart. Source: TradingView
The 20-day EMA ($151) has started to turn up gradually and the RSI has risen into the positive territory. This suggests that the path of least resistance is to the upside. If buyers push the price above $169, the EGLD/USDT pair could extend its up-move to the psychological level at $200. The bears are expected to mount a strong defense at this level.
This positive view will invalidate if the price turns down and plummets below the 20-day EMA. Such a move will suggest that the recent break above the 50-day SMA ($155) may have been a bear market rally. The pair could then again drop to $125.
EGLD/USDT 4-hour chart. Source: TradingView
The bulls pushed the price above the overhead resistance at $160 but the bears quickly pulled the price down and attempted to trap the aggressive bulls. Although the price broke below the 20-EMA, the bears did not build upon this advantage. This indicates strong buying at lower levels.
The bulls have again pushed the price back above $160 and are trying to resume the up-move. The bullish momentum could pick up on a break and close above $169. This positive view will be negated if the price turns down and breaks below $152.
The views and opinions expressed here are solely those of the author and do not necessarily reflect the views of Cointelegraph. Every investment and trading move involves risk, you should conduct your own research when making a decision.
 Source: TradingView