ApeCoin (APE), the governance token of the well-known Bored Ape Yacht Club (BAYC) NFT project was airdropped to BAYC and Mutant Ape Yacht Club (MAYC) owners at 8.30 am EST on March 17 and only eight hours after APE became tradable in the open market, it has already jumped to the 110th most traded token ranked by CoinGecko, totaling $900 million in trading volume across all tracked platforms.
As one would expect, there were some volatile price movements minutes after the airdrop and headlines show the price of APE dropping 80% since its launch. This raises the question of whether the ordinary BAYC and MAYC owner could have sold APE at $40 instead of $14, which it is trading for at the time of publishing.
Let’s take a look at APE’s price minutes after the airdrop was claimed and the token listed on Binance, FTX, Gate and SushiSwap to assess the scale of the price discrepancies during the initial price discovery periods.
ApeCoin spot 1-minute chart. Source: FTX
The spot price chart above shows that on the FTX one-minute chart, APE was trading as high as $40 in the second minute but the perpetual price chart below shows that in the first minute, it only went up to as high as $15 at the highest point.
ApeCoin perpetual 1-minute chart. Source: FTX
Binance shows a high of $28 on the minute of the airdrop from the one-minute chart while Gate shows an unbelievably high $214 on the same minute.
While the price of newly listed tokens are often volatile during the initial price discovery periods and it is difficult to know if transactions actually happened at these levels, the volumes on these minute candles can give a good indication of what the actual price of APE was right after the airdrop.
The trading volume of Binance is the highest among the three platforms used in this article and the reader should know that APE is also traded on other platforms. In the first five minutes, Binance’s total trading volume was $42 million, whereas FTX perpetual’s trading volume is in total $18 million and the spot volume is $6 million. Gate only has $1,665 trading volume on the candle, which shows the highest price of $214 and only $43,000 total volume in the first five minutes.
So it is clear to see that the more reliable price of APE minutes after the airdrop is from Binance, which is around $28 and happened on the minute of the airdrop. It is not uncommon to see a large drop in price in the newly launched tokens in the early trading hours, as it happened to many similar tokens. The question is whether an ordinary non-tech savvy owner could have sold the token in the first five minutes to avoid such a drop. The answer is almost certainly no.
First, the gas price for minting APE skyrocketed to 10 times (or even more) than the normal price right after the airdrop. Unless one is willing to take great risks bidding up the gas price to get the APE ahead of everyone else (and remember, at this point, the APE price is probably not discoverable anywhere), it is very difficult to even claim APE within one minute.
Second, once APE is in the recipient’s Ethereum wallet, it has to be transferred to centralized exchanges (CEXs) such as Binance and FTX to be sold. This also takes some time, depending on the traffic on the chain at the time. The quickest way would be to use a decentralized exchange (DEX) by simply connecting the Ethereum wallet and swapping APE for another token.
However, one interesting observation is that APE’s liquidity in the DEX is not as much as in the CEX. The TVL at the time of writing on Uniswap is relatively small for APE/USDC and APE/DAI pools, and the liquidity on SushiSwap is very low — the total value locked (TVL) in the APE/USDT pool is only $67,000.
APE liquidity pool as of March 17. Source: UniswapAPE/USDT liquidity pool as of March 17. Source: SushiSwap
BAYC owners can claim about 10,000 APE per NFT and MAYC owners can claim about 2,000 APE per NFT. This means only 80 BAYC owners will be able to swap the entire airdrop at the price of $28, given the $45 million TVL of APE/USDC on Uniswap.
No BAYC owners can swap the entirety of the airdrop on SushiSwap for USDT since the TVL of $67,000 cannot cover 10,000 APE swaps per BAYC or the 2,000 APE per MAYC at the price of $28.
Given the lack of liquidity in the DEX and the time it takes to transfer APE to a CEX such as Binance, it is almost impossible for an ordinary owner to cash out in the first one to two minutes at the top. It seems only tech-savvy owners (or bots) who know how to interact with the blockchain with code directly can execute these types of transactions in such a short period of time.
Even if the price of $40 is true and APE did drop 80% from there to $8, only very few were able to sell APE at that price. A more reasonable way to look at the initial price of a newly launched token is to use the volume of USD traded within the minute divided by the volume of the token. In the case of Binance in the first minute, the total USDT volume is 19.66 million and the total APE volume is 2.15 million, which gives an average price of $9.14 in the first minute for APE.
APE/USDT first minute volume. Source: Binance
Using this fairer way to look at APE’s price immediately after the launch, the token actually only dropped 12% since its peak, which is not overly dramatic, given the current bearish environment. When investors read headlines such as the token price falls 80% on its first day next time, make sure to take it with a grain of salt.
With Yuga Lab’s future plans to use APE for all its products and services, and the collaboration with Animoca Brands to build blockchain NFT games, the future outlook for APE and the Web3 economy built around NFTs could be very interesting.
The views and opinions expressed here are solely those of the author and do not necessarily reflect the views of Cointelegraph.com. Every investment and trading move involves risk, you should conduct your own research when making a decision.
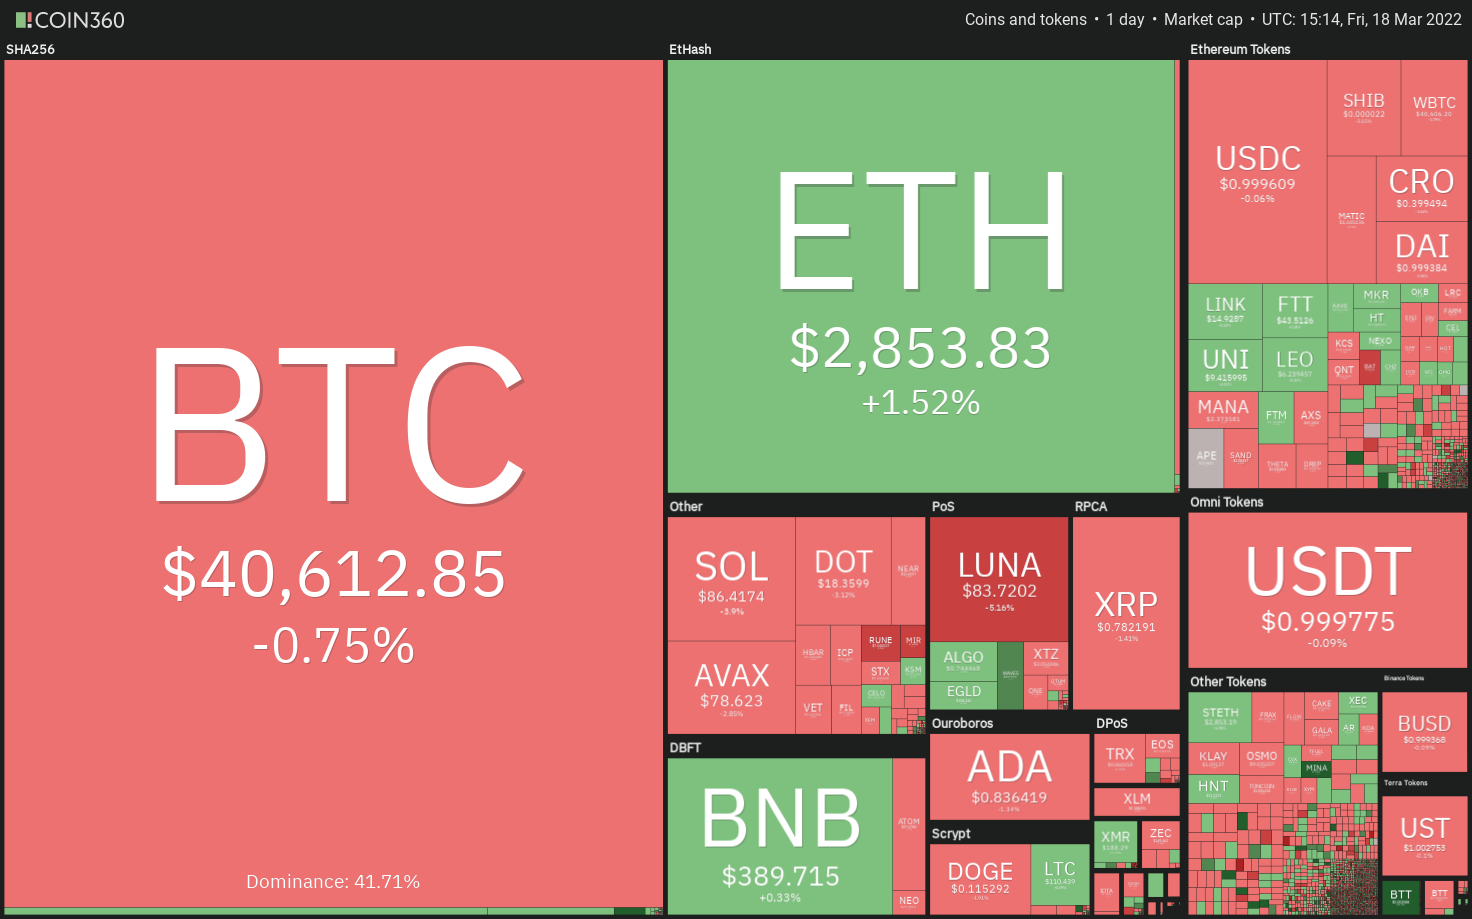
Bitcoin (BTC) saw brisk upwards action during the Wall Street trading session on March 18, conforming to predictions that higher levels would see a retest.
Data from Cointelegraph Markets Pro and TradingView followed BTC/USD as it advanced $1,650 from daily lows to nearly matching the $41,700 high from March 16.
The move buoyed traders, who began to reinforce their short-term view of levels near the top of Bitcoin’s 2022 trading range being challenged.
For popular trader Pentoshi, however, such a result would not mean that BTC/USD had broken its downtrend definitively.
“Macro headwinds still too strong but midterm, I think we rally bc seller exhaustion before any shot at new lows or prev lows. So lean towards up then down imo late Q2,” he told Twitter followers on the day.
Cold feet over macro conditions, as Cointelegraph reported, became a major issue this week, with multiple predictions of a major drawdown across major assets including BTC coming this year.
Analyst Matthew Hyland meanwhile noted that in any case, previous resistance around $40,000 was now increasingly looking flipped to support.
Looks like #Bitcoin has been using previous resistance ($40.3k) as new support the past few days
Earlier, Crypto Ed had delivered a near-term forecast of $43,000 for BTC/USD before a potential fresh consolidation period, only then followed by an exit up or down.
In a subsequent update, he showed the pair breaking out of a “bull flag” formation in place over recent days.
Ether (ETH), however, was a more interesting focus on the day.
The moves reignited talk of “altseason” appearing, with various commentators arguing for a new golden era for altcoins in the coming months.
Popular Twitter account BTCFuel offered the Summer as a potential peak for prices.
2/ To assess when the next #altseason peak will happen, I’ll be looking at charts of #Bitcoin, #Ethereum and the dominance of #altcoins of the different past altseasons. By aligning them “correctly” structure-wise, I found this provisional target zone when the peak should happen pic.twitter.com/8H1MyPONiF
Bitcoin (BTC) is facing a challenging environment in 2022 due to the surging inflation and geopolitical turmoil. Although gold has outperformed Bitcoin year-to-date, Bloomberg Intelligence senior commodity strategist Mike McGlone believes that Bitcoin could make a strong comeback. McGlone expects the current circumstances to “mark another milestone in Bitcoin’s maturation.”
Another bullish sign for the long term is that the Bitcoin miners have been increasing their Bitcoin holdings since 2021. Compass Mining founder and CEO Whit Gibbs said to Cointelegraph that Bitcoin mining companies are “taking more of a bullish approach to Bitcoin.”
Terraform Labs founder Do Kwon said that its stablecoin TerraUSD (UST) will be backed by more than $10 billion in Bitcoin reserves. He expects this move to “open a new monetary era of the Bitcoin standard.”
Could Bitcoin and altcoins find buyers on dips or will bears trap the aggressive bulls? Let’s analyze the charts of the top-10 cryptocurrencies to find out.
BTC/USDT
Bitcoin broke and closed above the 50-day simple moving average (SMA) ($40,311) on March 16 but the bulls are struggling to build upon this breakout. This suggests that demand dries up at higher levels.
BTC/USDT daily chart. Source: TradingView
The bears will try to make use of this opportunity and pull the price below the 20-day exponential moving average (EMA) ($39,973). If they succeed, the BTC/USDT pair could again drop to the strong support at $37,000.
Conversely, if the price rebounds off the moving averages, it will suggest that the sentiment has turned positive and traders are buying on dips. The bulls will then try to push the price above $42,600 and extend the rally to $45,400.
ETH/USDT
Ether (ETH) broke and closed above the 50-day SMA ($2,780) on March 16, indicating a strong comeback from the bulls. The buyers held the dip to the 50-day SMA today and are attempting to extend the recovery.
ETH/USDT daily chart. Source: TradingView
The relative strength index (RSI) has jumped into the positive territory and the 20-day EMA ($2,700) has started to turn up, indicating the path of least resistance is to the upside. If the price sustains above the 50-day SMA, the ETH/USDT pair could rally to the resistance line of the symmetrical triangle. The bears are expected to mount a strong defense at this level.
This positive view will be invalidated if the price turns down from the current level and plummets below the moving averages. The pair could then drop to the support line of the triangle.
BNB/USDT
BNB is facing resistance at the 50-day SMA ($389). This is the fourth instance when the bears are posing a strong challenge at this level. Therefore, the 50-day SMA becomes a key level to watch out for on the upside.
BNB/USDT daily chart. Source: TradingView
The flat moving averages and the RSI near the midpoint suggest a balance between supply and demand. If buyers push and sustain the price above the 50-day SMA for three consecutive days, it will indicate a possible change in trend. The BNB/USDT pair could then start its northward march toward $445.
On the other hand, if the price dips below the 20-day EMA ($382), the bears will attempt to pull the pair toward the strong support at $350.
XRP/USDT
Ripple (XRP) bounced off the 50-day SMA ($0.74) on March 15 but the bulls have not been able to challenge the downtrend line. This suggests that the bears are selling on rallies.
XRP/USDT daily chart. Source: TradingView
The bears will now attempt to pull the price below the moving averages. If they succeed, the XRP/USDT pair could drop to the strong support at $0.68. If this support also gives way, the decline could extend to $0.62.
Alternatively, if the price bounces off the moving averages, it will suggest that the bulls are buying on dips. That could enhance the prospects of a break and close above the downtrend line. The pair could then rally to $0.91.
LUNA/USDT
Terra’s LUNA token has broken below the 20-day EMA ($84), suggesting that the failure to sustain the price above $96 may have attracted profit-booking from the short-term traders.
LUNA/USDT daily chart. Source: TradingView
The 20-day EMA has flattened out and the RSI has dropped to the midpoint, indicating that the bullish momentum may be waning. If the price sustains below the 20-day EMA, the bears will try to pull the LUNA/USDT pair toward the strong support at $70.
Contrary to this assumption, if the price rebounds off the current level, the bulls will make another attempt to push and sustain the price above $96. If they manage to do that, the pair could rally to the all-time high at $105.
SOL/USDT
Solana (SOL) rose above the 20-day EMA ($86) on March 16 but the bulls could not push the price above the downtrend line. This indicates that the bears are active at higher levels.
SOL/USDT daily chart. Source: TradingView
The sellers will now attempt to sink the price below the strong support zone between $81 and $75. If they succeed, it will complete a descending triangle pattern and the SOL/USDT pair could plummet to $66.
However, the flattening moving averages and the positive divergence on the RSI suggest that the bearish momentum may be weakening. If the price rebounds off the support zone, the bulls will make one more attempt to overcome the barrier at the downtrend line and push the pair to $106.
ADA/USDT
Cardano (ADA) is facing stiff resistance at the 20-day EMA ($0.84) which suggests that the bears are defending this level aggressively.
ADA/USDT daily chart. Source: TradingView
The flattening 20-day EMA and the positive divergence on the RSI suggest that the selling pressure may be waning.
If the ADA/USDT pair does not give up much ground from the current level, it will suggest that the traders are holding on to their position as they anticipate a move higher. If the price breaks and closes above the 20-day EMA, the next stop could be the overhead resistance at $1.
This positive view will invalidate if the price turns down and breaks below $0.74. The pair could then resume its downtrend and decline to $0.68.
Avalanche (AVAX) broke above the moving averages on March 17 and rose to the downtrend line of the descending channel. The bears are expected to mount a strong defense at this resistance.
AVAX/USDT daily chart. Source: TradingView
The flattish moving averages and the RSI just above the midpoint indicate a minor advantage to buyers. If bulls sustain the price above the 20-day EMA ($75), the prospects of a break and close above the channel improve.
A close above the channel will be the first sign of a possible change in trend. The bulls will then attempt to drive the price toward the psychological level at $100.
This positive view will be invalidated in the short term if the price breaks and sustains below the 20-day EMA. The AVAX/USDT pair could then drop to the uptrend line.
DOT/USDT
Polkadot (DOT) broke and closed above the 50-day SMA ($18) on March 16 but the bulls could not sustain the price above the overhead resistance at $19. This suggests that the bears are not willing to give up easily.
DOT/USDT daily chart. Source: TradingView
The price has turned down from the overhead resistance but a minor positive is that the bulls are attempting to defend the moving averages. If the price rebounds off the moving averages, it will increase the possibility of a break and close above the overhead resistance. The DOT/USDT pair could then start its journey toward $23.
Conversely, if the price slips below the 20-day EMA ($17), the pair could drop toward the support at $16. The pair could then extend its stay inside the $16 to $19 range for a few more days.
DOGE/USDT
Dogecoin (DOGE) once again turned down from the 20-day EMA ($0.12) on March 17, indicating that bears continue to sell near the resistance levels.
DOGE/USDT daily chart. Source: TradingView
The sellers will now try to pull the price down to the strong support at $0.10. If the price bounces here, the DOGE/USDT pair could remain range-bound between $0.12 and $0.10 for a few days.
The first sign of strength will be a break and close above the 20-day EMA. That could push the price to the 50-day SMA ($0.13), which may again act as a strong resistance.
A break and close above this resistance could attract buyers and open the doors for a possible rally to $0.17. Conversely, a break and close below $0.10 will suggest the resumption of the downtrend.
The views and opinions expressed here are solely those of the author and do not necessarily reflect the views of Cointelegraph. Every investment and trading move involves risk. You should conduct your own research when making a decision.
Much has been said about Bitcoin‘s carbon emissions. Far less has been said about the potential of blockchain to increase the efficiency of renewables by transparently managing supply and demand. Blockchain doesn‘t pose a threat to the planet — it’s going to play an essential role in helping to bring about a net-zero carbon emission economy.
It is a few years in the future: You are sitting on your sofa, having a nice coffee after loading the washing machine. You’ve switched it on but, of course, the Internet of Things-enabled machine checks prices and will run when it hits a cheap electricity window. The Tesla outside in the drive is fully charged, you don‘t have any plans to go any further than the supermarket today, so the battery is available to sell its energy back to the grid and deposit tokens in your energy wallet if the electricity grid requires power.
Back to today.
Energy and electricity, in particular, are vital to our society. The grim effects on Texas in the 2021 freeze — where more than 4.5 million homes and businesses were left in the icy dark, causing misery and 246 deaths — showed us how vulnerable all our systems are to trouble with the electricity supply.
Blockchain is an essential part of turning the power grid green.
In 1882, the first U.S. electricity plant, the Pearl Street Station, started producing power for around 85 customers‘ lights in Manhattan, using DC current. Westinghouse, a rival to Thomas Edison’s company, invented AC power and built a big hydropower plant at Niagara Falls to supply electricity to Buffalo, NY. Other developed countries followed suit. The model was a large centralized power plant that, through a grid, sent high voltage electricity to substations and distributed it to residential and business consumers.
This model worked well for more than a century or so. It does, however, rely on large, expensive and centralized power stations fueled by coal, natural gas, hydro or nuclear. It‘s a top-down structure.
Well, DER…
Now we have a new paradigm: In a transition to a decarbonized future, we have lots of Distributed Energy Resources (DERs) to deal with. These could be wind or solar generators, but they could also be battery storage, hydrogen fuel cells, smart appliances or electric vehicles. Utility company Dominion Energy, for example, is investing in a fleet of school buses in Fairfax, Virginia.
A solar panel microgrid on a building in South Africa. Source: The Sun Exchange
Twice a day, they will be picking up and dropping off kids. The rest of the time, they sit in the depot to serve as a giant battery for the local power grid. Instead of a few large power stations, soon, we will have a very complex web of producers and consumers. In the old days, if a national grid needed more power, someone flicked a switch and another power plant came online. Conversely, if there was too much, an engineer somewhere shut one down.
Balancing all the loads from different inputs and outputs is much more difficult in a distributed system and requires a lot of AI, data analytics and some sort of transparent, accessible, trusted and un-manipulable accounting system. You might have come across something of this nature. Spoiler: These are blockchain and tokenomics.
The new energy paradigm is a rough beast, slouching to be born, to misquote Irish poet W.B. Yeats. But, we can look at a few pioneers in the field.
Distro – Port of Rotterdam
Rotterdam in the Netherlands is the largest port in the world, handling incredible amounts of cargo every day. It uses a lot of electricity. BlockLab.nl teamed up with S&P Global Commodity Insights, a giant in the field of commodity trading and analytics, to create Distro, an AI-based trading platform to buy and sell energy from a solar power microgrid on the roofs of buildings within the port complex.
It uses high-frequency trading and blockchain accounting to drive down user costs by 11%, produce returns up 14% and reduce emissions of CO2, according to an in-house analysis released October 5, 2021. The success of this pilot project has generated tremendous interest in replicating this in other places, according to James Rilett, senior director of Innovation at S&P Global Commodity Insights.
The Port of Rotterdam. Supplied.
BlockLab is a multi-disciplinary innovation laboratory that aims to put blockchain technology into practical use by building applications to enhance the global energy transition and optimize global supply chains. It is backed by the Port of Rotterdam and collaborates with leading universities and technology developers.
Janjoost Jullens, energy lead at the BlockLab, met Rilett at an exhibition and there was an immediate exchange of ideas. James Rilett says,
“We were already thinking about AI, blockchain, big data and the energy transition. What we wanted to do is bring the best bits of the proven evolution of energy markets to a new technological paradigm.”
The Port of Rotterdam backed the project in 2018 with a small amount of “pizza money,” with the clear direction that it had to be a practical and realizable project, not some vaporware. Distro is a peer-to-peer energy network of consumers and “prosumers.” That is, users that both generate power and consume it as well. All the energy trading is automated, so there is minimal administration needed.
“It‘s a very innovative and realistic method,” Janjoost says. “We blend together blockchain, algorithm trading, data engineering and data science — a business solution that copes with decentralization.”
Blockchain is the “special sauce,” as James describes it, that ensures that transactions are fair, transparent and reconciled, which is a big issue in the conventional energy trading world.
“The platform has hosted 20 million blockchain-validated, cleared and settled transactions. The blockchain lowers the price at which it is sensible to manage microtransactions because it‘s beautiful technology out of the box that helps those transactions clear in a trustful way. It is unique and new to the power market.”
They are working on scaling this technology to larger projects. The first will be implemented in the Port of Rotterdam industrial area, which accounts for 35% of the Netherlands‘ entire carbon emissions, and the second is a microgrid development in California.
Another niche use is “Shore Power.” Docked ships need variable power, usually using diesel generators, and produce fine dust air pollution. Distro is working on replacing this with clean energy supplied by renewables to overcome this problem.
Powerledger announced as a winner at the World Summit Awards (@WSAoffice) in the Environment and Green Energy category, for our peer-to-peer energy trading project in Uttar Pradesh, India!
Australia’s Powerledger is pushing forward with decentralized markets so that renewable energy generation, storage and purchasing power are harnessed in an optimal way. It aims to expand the use of renewables by using advanced trading between microgrids to ensure that high penetration levels will not cause grid instability.
Ensuring continuity in transmission and distribution is essential with intermittent renewable energy sources to avoid conventional grid failures, including not only blackouts but brownouts, where the grid falls below its operating parameters and causes problems with equipment.
It has already established almost a dozen projects in Australia and various other countries. Powerledger released the Solana-based token POWR on Coinbase and Binance last year.
Jemma Green, Powerledger executive chairman and co-founder, tells Magazine:
“What happens is that energy companies often bundle fossil fuel energy into the mix to make up for holes in the supply of intermittent renewable energy.”
She believes that storage, including EV batteries and the use of advanced market software, will bridge that gap as more renewables come into the energy mix.
Powerledger‘s uGrid software is being used in Thailand in project T77 to trade rooftop solar power between an international school, apartment complex, shopping center and dental hospital in Bangkok. This blockchain-based software is the backbone of the peer-to-peer trading system that enables energy distribution within the community. This is cheaper than the grid and reduces emissions because the generation is local and not from a distant power station. The key technology is a blockchain app that trades energy between participants rapidly to get the best price in a microsecond-by-microsecond fluctuating market of supply and demand.
Powerledger is working on 30 projects in 11 countries, so these different energy technologies are being put through their paces to validate their performance. Green says:
“People are, understandably, apprehensive about any new technology, but blockchain is the building block for a whole new internet. It’s a whole new era where you can take the sun‘s rays and turn it into a currency.”
There is a lot of potential for these projects across the developing world, perhaps in the way that smartphone banking applications leapfrogged the Western concept of high street banks and went straight to mobile users in Africa and Asia.
Justin Sun not involved
Across Asia, numerous other projects harnessing sustainable energy and blockchain are being implemented. Launched in 2015, The Sun Exchange‘s micro-leasing marketplace in South Africa brings individual and corporate energy investors to off-grid energy development. Tokens are a way to finance a project without going down the route of conventional capital, which not all projects can.
Blockchain can also be valuable for measuring, recording and verifying greenhouse gas emissions. ECO2 Ledger uses blockchain technology to make carbon credit data more reliable and traceable in the voluntary carbon market in China, where individuals can track their carbon emissions on the MyCarbon app and trade with those who need carbon credits. Launched in mid-November 2019, it quickly accumulated over 500,000 users, with its website claiming to have traded 100,000 tons of carbon credit.
MyCarbon Phone App. Source: ECO2 Ledger
Trading in Renewable Energy Certificates (called by various names in different markets) is important. The production, trade, distribution and consumption of renewable energy can be electronically documented and tracked with this method, creating carbon credits for verifiable carbon generation. In the developed world, this is an established and regulated market. In the developing world, where it is often voluntary, there can be a lot of issues: transparency of tracking, fraud and unacceptable transaction costs.
Swiss-based Energy Web Foundation (EWF) is a nonprofit founded in 2017 that is developing publicly available and decentralized solutions designed specifically for the energy sector. EWF’s Energy Web Origin (EW Origin) is a suite of open-source and fully customizable software tools for building blockchain platforms for easy and efficient renewable energy sourcing in line with the existing standards and regulations.
They have projects in Thailand, Turkey and El Salvador. Mercados Eléctricos16 (MERELEC), an electricity trading corporation operating across Mexico and Central America, is executing a pilot platform to assess a business case for the technical feasibility of a blockchain-based regional carbon credit trading marketplace. This is a fledgling project, started in 2019, and it has not been without challenges. Data acquisition has been a problem due to the diversity of devices. Lack of understanding of blockchain has been another. As these credits are voluntary, there seems to have been a lack of customers. But, good projects will overcome early difficulties.
EZ Blockchain’s mobile bitcoin mining center in operation at a power plant. Source: EZ Blockchain
A flare for flares
A lot of natural gas is lost, being flared (burned) instead of being used. It is potentially hazardous and often uneconomic to process and sell. This is very wasteful. EZ Blockchain, founded in the United States in 2017 by Sergii Gerasymovych, uses this waste gas. He explains, “We utilize that energy, convert it into electricity and mine Bitcoin.” The company’s product is a mobile data center that can be put on a gas site and use surplus gas to generate power — a neat trick.
“There is a lot of energy in the power grid that is wasted. If there is excess power in the grid, we use it to mine Bitcoin. If there is a shortage, then our data center shuts down. It‘s balancing supply and demand.”
The company is running flat out and installing new mining data centers every day. It has over 60 operating in the U.S. and Canada, some directly owned by EZ Blockchain, others by the energy companies themselves. They are building around a dozen more each month and are hooking their data centers up to renewable microgrids.
“Our company is focused very much on incentivizing renewable energy,” Sergii says.
“What I mean by that is renewable energy such as wind or solar requires a consistent user of power in order to be profitable. So, with the help of batteries, solar panels or wind turbines and cryptocurrency mining as a constant load, we can provide the companies that invested in renewable assets a much quicker return on investment. It can use the excess energy instead of being shut down when the wind blows, but there is not enough demand.”
He adds:
“The future is bright but there is a lot of work. We are at the stage where we are massively expanding. We literally hired ten people last week. So, the company’s growing exponentially.”
Putting the pieces together
Decentralized energy systems — local and low carbon — are the way forward for energy transmission and distribution. Couple that with IoT, AI, machine learning, big data and other technological innovations, as well as much more granular user control, a decentralized financial and accounting system will be required to ensure transparency, security and accountability. There‘s really only one technology that fits the bill: blockchain.
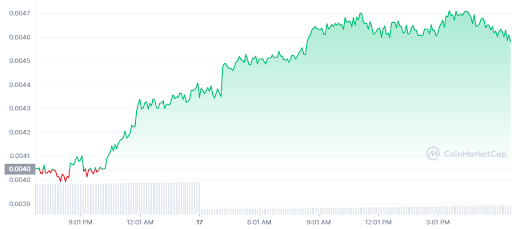
Lucky Block (LBLOCK) has been surging today. Although most coins in the market are posting some gains, LBLOCK is on another level. But could this signal a sustained bullish run that will take the coin to $0.1? It remains to be seen, and here are some facts to keep in mind:
Surging to $0.1 will mean Lucky Block (LBLOCK) will grow nearly 100x.
It’s the second day in a row the coin has posted double-digit gains.
At the time of writing, it was trading at $0.0048, up around 20%.
Data Source: Tradingview
Lucky Block (LBLOCK) – is $0.1 a bridge too far?
Well, Lucky Block (LBLOCK) is a coin that has a lot of potentials. But for it to hit $0.1, it will need to deliver gains of almost 100x. This is not unprecedented in crypto, but there are many barriers right now.
The key thing to note though is that Lucky Block (LBLOCK) has actually not been listed in any of the major exchanges out there. This gives it huge upside potential. Typically, coins can explode in value once they start to enter the main exchange platforms.
Lucky Block (LBLOCK) is also undervalued. It has a market cap of around $140 million, but it could be bigger. The road to $0.1 is not impossible. But it will take a bit longer. This is because conditions in the market right now are not that good.
Is Lucky Block (LBLOCK) a good asset?
Lucky Block (LBLOCK) is trying to build a global lottery using the power of blockchain technology. It’s an innovative concept that could open the door for more betting-related services.
Based on that alone, it looks like a decent buy. Besides, the project has been attracting a lot of capital and backing from investors. It’s only a matter of time before it becomes huge in the crypto market.
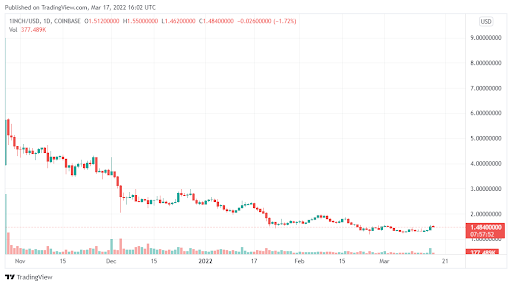
As the crypto market shows some bullish signs today, 1Inch (1INCH) had posted impressive gains in 24-hour intraday trading. But those gains have pulled back. The coin was under a lot of pressure in recent weeks. It seemed for a moment things were finally looking up. But how far can today’s rally go? Here is what you need to know first:
1INCH still remains bearish despite the recent surge in the price.
The coin has lost 85% from its all-time highs too.
At the time of writing, 1INCH was trading at around $1.49
Data Source: Tradingview
1Inch (1INCH) – Predictions and analysis
It’s not that long ago when 1INCH was hitting an all-time high of $8.29. This in fact happened at the end of 2021, and there was a lot of hope that 2022 could be huge. But things have not really taken off. 1INCH has now tanked, and at one point, it was just hovering around $1.
But there are signs things may start to turn. First, the coin has managed to cross over a crucial overhead resistance of $1.39. 1INCH has consolidated above that price and is now trying to trigger sufficient demand for a bullish break. But we do not see enough upside right now to push the token above $3.
It will take time before those $8.39 highs are repeated. But in the short term, 1INCH could still hit $3 before it pulls back once more.
What is the value of 1Inch Network (1INCH)?
1Inch Network (1INCH) is a network that hopes to create a collection of fast-growing decentralized protocols. The aim is to provide a robust infrastructure where people or organizations can launch innovative blockchain solutions.
The project has received a lot of investment and still has some potential to deliver real gains in the long run. It currently has a market cap of around $600 million.
The explosion of play-to-earn games in the blockchain has been spectacular. In 2021, play to earn coins in the market were the fastest growing assets. Although they have lost some of the gains made last year, this subsector remains very promising. Here is why:
Play to Earn incentivizeS players to play for rewards.
The integration of NFTs into Play-to-Earn games is bringing a new dimension.
All major blockchain developers and investors are backing blockchain games.
So, if you missed Axie Infinity, there are still other upcoming blockchain games that could deliver impeccable outcomes. Here they are:
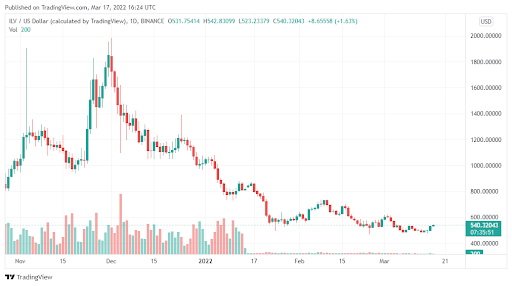
Illuvium (ILV)
Illuvium (ILV) is an immersive RPG adventure game that gives players access to broad landscapes and exciting gameplays. It is built on Ethereum and comes with various levels. There is also NFT integration and staking as well for investors.
Data Source: Tradingview
Illuvium is hoping to become a dominant strategy game that will attract millions of daily users. It is still at its initial phase right now too. Its native token ILV is currently trading at $534, up around 5% for the day. The project also has a market cap of under $346 million.
Battle of Guardians (BGS)
Battle of Guardians (BGS) is another real-time and immersive game that has dubbed itself “The future of fighting games”. It has full NFT integration as well and strives to give users a real battle experience all through the game. There is also an expansive gaming universe to keep things fresh. The native token for the game is the BGS, and it is trading at $0.01265 right now.
High Street (HIGH)
High Street (HIGH) has integrated both play to earn and the metaverse. In addition to the immersive games, users can also own various in-game items, including virtual real estate. High Street is actually working to bring big brands into its digital universe. Its native token HIGH was trading at $3 at press time.
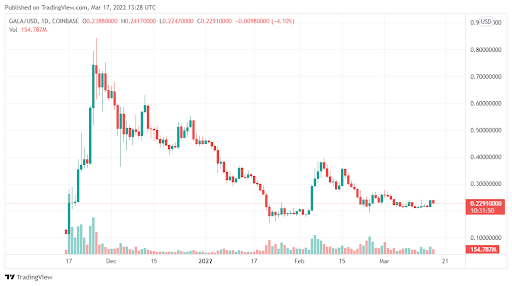
The metaverse wipe-out we saw during the last week has pushed a lot of coins way lower from yearly highs in 2022. Gala Games (GALA) has not been spared, and the coin has been on a massive downturn since the end of February. But are there signs of a recovery? Here is what we know:
GALA could rise above its 20-day EMA in the days ahead.
The EMA will create important support for price consolidation in the near term.
The meta coin was trading at $0.22 at press time.
Data Source: Tradingview
Why does the 20-day EMA matter for GALA?
Trend reversals are very crucial in technical analysis. In most cases, when coins have dropped consistently over a long period of time, bulls are often watching for the right trend reversal to buy. For GALA, rising above its 20-day EMA of $0.28 could signal a trend reversal is coming.
This will in turn trigger a buying frenzy that will push the meta coin well above $0.36. This will be almost 80% above the current price which is presently at $0.22. The most important indicator to watch in this setup is the $0.21 support.
The bulls will need to defend this zone and create enough momentum for the next leg up. If GALA falls below that threshold, it will be very hard to see any recovery. In fact, the coin could easily bottom to $0.17 before it rises again.
Why is Gala Games (GALA) trending lower?
Much of these losses were occasioned by news that Meta Platforms, one of the key tech drivers in the metaverse, missed earnings expectations. But the high market volatility due to economic and geopolitical pressures has played a big role.
This volatility is sadly here to stay for the foreseeable future. But even with that, overall, the longer-term outlook for GALA remains largely in positive territory.
Please be aware that some of the links on this site will direct you to the websites of third parties, some of whom are marketing affiliates and/or business partners of this site and/or its owners, operators and affiliates. We may receive financial compensation from these third parties. Notwithstanding any such relationship, no responsibility is accepted for the conduct of any third party nor the content or functionality of their websites or applications. A hyperlink to or positive reference to or review of a broker or exchange should not be understood to be an endorsement of that broker or exchange’s products or services.
Risk Warning: Investing in digital currencies, stocks, shares and other securities, commodities, currencies and other derivative investment products (e.g. contracts for difference (“CFDs”) is speculative and carries a high level of risk. Each investment is unique and involves unique risks.
CFDs and other derivatives are complex instruments and come with a high risk of losing money rapidly due to leverage. You should consider whether you understand how an investment works and whether you can afford to take the high risk of losing your money.
Cryptocurrencies can fluctuate widely in prices and are, therefore, not appropriate for all investors. Trading cryptocurrencies is not supervised by any EU regulatory framework. Past performance does not guarantee future results. Any trading history presented is less than 5 years old unless otherwise stated and may not suffice as a basis for investment decisions. Your capital is at risk.
When trading in stocks your capital is at risk.
Past performance is not an indication of future results. Trading history presented is less than 5 years old unless otherwise stated and may not suffice as a basis for investment decisions. Prices may go down as well as up, prices can fluctuate widely, you may be exposed to currency exchange rate fluctuations and you may lose all of or more than the amount you invest. Investing is not suitable for everyone; ensure that you have fully understood the risks and legalities involved. If you are unsure, seek independent financial, legal, tax and/or accounting advice. This website does not provide investment, financial, legal, tax or accounting advice. Some links are affiliate links. For more information please read our full risk warning and disclaimer.
The Bored Ape Yacht Club (BAYC) has officially revealed their ERC-20 utility and governance token ApeCoin (APE), marking a diversification from profile-picture projects (PFPs) into “culture, gaming and commerce” within the Web3 sphere.
The asset has been developed and launched by the ApeCoin decentralized autonomous organization (DAO), a distinguished entity from Yuga Labs, who have established a six-month tenured council committee comprising of Alexis Ohanian, Amy Wu, Maaria Bajwa, Yat Siu and Dean Steinbeck, to oversee the DAO development.
ApeCoin’s official Twitter account stated Thursday that the members of the BAYC ecosystem will be granted a 90-day window of opportunity to claim their allocation of 10,000 tokens commencing March 17 at 12:30 pm UTC.
Token claim is now open. If you own a BAYC Ecosystem NFT, go here: https://t.co/NLOB0m4cqf Reminder: the claim period will be open for 90 days, and tokens associated with an NFT can only be claimed once.
A number of prominent exchanges such as Binance US, FTX, Gemini and OKX, among others have already pledged to list, and enable public trading of the asset on their platforms.
Despite this, others have profited from the market euphoria with the launch of similarly named tokens like APECoin.dev. The project in question has amassed a market capitalization of over $1.5 million with a price of $0.145. In response, CoinMarketCap has published a red warning tag on the page advising that the token is not affiliated with the official BAYC project, and should not be interacted with.
Cointelegraph spoke to Insight, a Bored Ape holder and NFT journalist, for an expert perspective on the community’s expectations for the release.
“This airdrop will be unprecedented there is no doubt”, he stated, “but historically in the space, we have watched these airdrops pump and slowly fizzle out as the engagement dissipates. That being said, with the momentum of BAYC and their positioning in the NFT space as the number 1 collection, I believe things may be different.”
“I don’t think we will see the emotional attachment that holders have for the ape NFTs themselves, but either way this is HUGE for both ape holders and the space as a whole.”
As a consequence of the asset’s launch, the average price of the BAYC collection rose significantly across the last seven days from 76.11 ETH on March 11 with a total volume of 913 ETH, to an average price of 110.15 ETH and a volume of 9,583 ETH in the hours preceding launch on March 17.
In a parallel trend, the floor price also witnessed a growth spurt, before falling sharply upon the ApeCoin launch from around 108.69 ETH to 78 ETH at the time of writing.
Additionally, the floor price of the accompanying collections Mutant Ape Yacht Club, and Bored Ape Kennel Club has experienced major fluctuations, currently sitting at 15.85ETH and 5.8ETH, respectively.