- Most major US public Bitcoin miners expected to report Q1 losses despite high BTC prices.
- US tariffs on imported mining rigs raised costs and created strategic uncertainty for miners.
- The April Bitcoin halving event further pressured revenue by cutting block rewards by 50%.
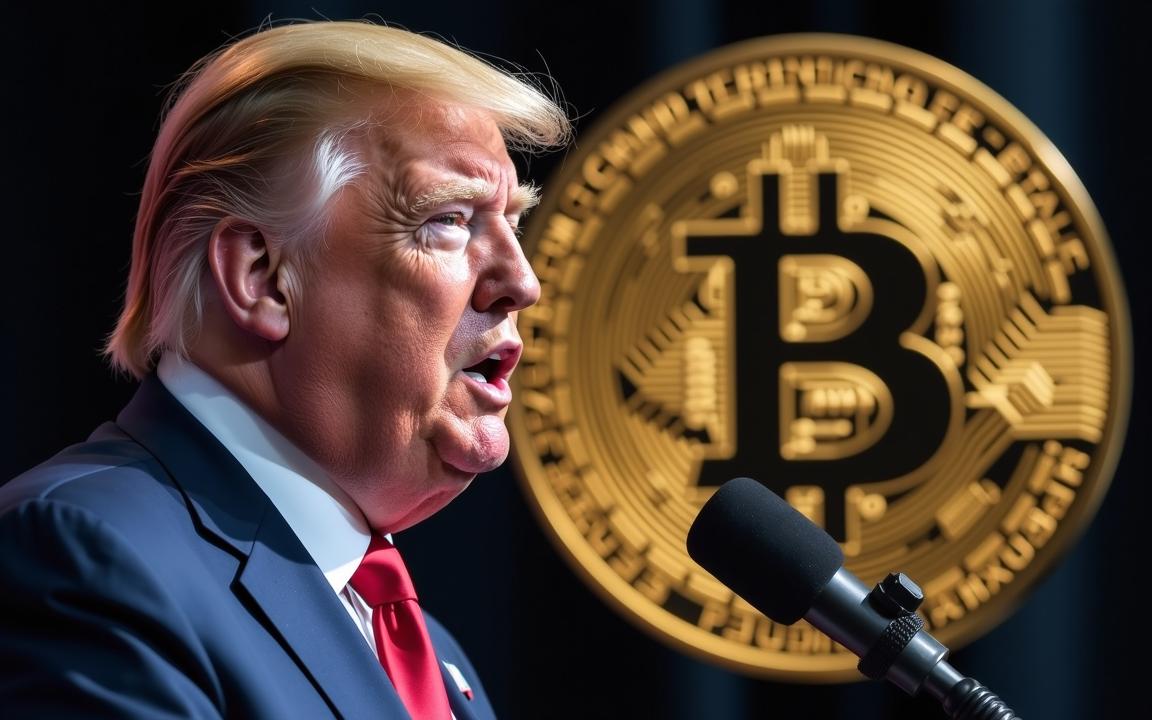
Despite entering office with promises to champion the US Bitcoin mining industry, President Donald Trump’s return to the White House hasn’t translated into immediate prosperity for the sector.
As American crypto miners prepare to release their first quarterly earnings since the administration change, analysts anticipate a challenging period marked by losses, squeezed margins, and operational headwinds, even against the backdrop of Bitcoin hitting record highs earlier in the year.
The paradox of pain: losses despite high Bitcoin prices
The prevailing expectation is one of financial strain.
According to analyst estimates compiled by Bloomberg, seven out of the eight largest publicly traded Bitcoin miners based in the US are projected to report a net loss for the first quarter of 2025.
This stark outlook contrasts sharply with the significant adjusted net income of $1.1 billion reported collectively by the group in the same period of 2024, now estimated to swing to a loss of $190 million.
Among the cohort, only CleanSpark Inc. is anticipated by analysts to post a profit.
This downturn comes despite Bitcoin reaching a record above $109,000 in January and averaging roughly 75% higher in price during the first quarter compared to the previous year.
Concrete results are already emerging: Riot Platforms Inc., a major player, reported a Q1 loss of $296.4 million on Thursday, a dramatic reversal from its $211 million net income in Q1 2024.
Competitive squeeze: record difficulty and rising costs
Several factors are converging to pressure miners’ profitability.
A primary challenge is the soaring level of competition within the network.
Mining difficulty, a metric reflecting the total computing power dedicated to securing the Bitcoin blockchain, has repeatedly broken records in recent months.
This surge in the global “hash rate” means more miners are competing for the same fixed amount of newly issued Bitcoin rewards.
“This is going to be an interesting quarter for the Bitcoin miners and perhaps a difficult one over the past few months,” commented Brian Dobson, managing director at brokerage firm Clear Street.
“We will see margin compression and lower revenues from Bitcoin mining due to that higher global difficulty rate.”
This intense competition is partly a legacy of the late 2024 Bitcoin price surge, fueled by Trump’s pro-crypto stance, which prompted miners to rush orders for more powerful, specialized mining machines (rigs).
Furthermore, rising energy costs in some key US mining states have added to operational expenses during the same period.
Growth in international mining operations, including from Russia and China, has also intensified the global hash rate competition, according to Ethan Vera, COO at Luxor Technology.
Tariff tremors and strategic hesitation
Compounding the competitive pressure are the direct and indirect impacts of US trade policy.
The specialized mining rigs essential for operations are mostly manufactured in Asia.
Tariffs imposed on these machines, some originating from countries like Malaysia, directly increase capital expenditure for US miners.
Vera noted that potential further tariff hikes “will be very detrimental, return profiles and growth forecasts can be hindered from that,” adding wryly, “With tariffs coming in, I think everyone outside the US will benefit from that.”
Supply chains faced additional disruption early this year due to heavy border inspections and the US Commerce Department’s blacklisting of an AI affiliate (Xiamen Sophgo Technologies Ltd.) of Bitmain, the largest rig supplier, in January.
More broadly, the unpredictable nature of tariff policy under the Trump administration is creating strategic paralysis.
“The management teams are hesitant to develop a multi-year strategy based on what tariffs look like today when they realize that three months from now we could have a very different conversation on what the tariffs would look like,” explained Dobson.
Capital crunch: shifting financing strategies
Accessing capital has also become more challenging. Historically, many public miners relied heavily on “at-the-market” (ATM) stock offerings to raise billions for purchasing machines and funding energy-intensive operations.
However, the retreat in the broader stock market since the post-election highs has made equity financing less attractive.
Consequently, companies are increasingly turning towards debt instruments. MARA Holdings Inc., Riot Platforms, and CleanSpark have all utilized convertible bonds or credit facilities recently to secure liquidity.
“I think the big public companies don’t want to sell shares in the current market, this is an expensive way for them to raise capital, whereas the debit instruments are just lower-cost capital,” Vera observed.
Adding a final layer of difficulty is the impact of the Bitcoin “halving” event that occurred last April.
This pre-programmed code update slashed the Bitcoin rewards paid to miners for validating transactions by 50%, directly cutting into their primary revenue stream.
An unintended consequence?
While President Trump campaigned on making the US a leader in Bitcoin mining, the first quarter under his administration seems defined by miners grappling with the challenging side effects of his broader policies.
Tariffs are hiking equipment costs and potentially benefiting foreign competitors, while market volatility linked to policy uncertainty has hampered access to equity capital.
As Vera concluded, “In terms of the tariffs, I don’t think Trump has Bitcoin mining as his number one priority to focus on… The trade war, for him, is the most important thing.”
Share this article
Categories
Tags