Key Takeaways
- Ever since the Merge went live in September, Ether has underperformed Bitcoin significantly
- This is despite the supply of Ethereum falling post-Merge
- More Ether is also being staked since the Shapella upgrade in April
- Demand has fallen with regard to Bitcoin, however, overriding the lower supply
- Regulatory crackdown and greater institutional interest in Bitcoin appears to be driving the divergence, writes our Head of Research
One of the more interesting trends to follow within crypto is that of the ETH / BTC chart. In other words, how the world’s two largest cryptocurrencies move in relation to one another. Now ten months on from the Ethereum Merge, it feels like a good time to re-analyse the relationship.
The Merge completely transformed Ethereum, switching the network to a proof-of-stake mechanism rather than the proof-of-work mechanism it was on previously. On the other hand, Bitcoin remains (and always will be) a proof-of-work blockchain.
This means that the fundamentals underlying the Ethereum network have flipped. Perhaps this is most noticeable when plotting the total circulating supply of ETH. The Merge going live in September 2022 sticks out like a sore thumb, with the supply (slightly) contracting from that date.
Zooming in on the post-Merge period in the next chart shows the contraction. The supply has reduced at an average rate of 0.15% per month. Prior to the Merge, the supply grew by 0.41% per month.
Moreover, the supply of liquid Ether has contracted even further than the above charts show. Looking at the total value of staked Ether, the pattern was relatively steady from when the staking contract opened in November 2020. This trend more or less continued as the Merge went live in September 2022. However, as seen on the next chart, the amount of staked Ether spiked notably in April of this year, as the Shapella upgrade went live.
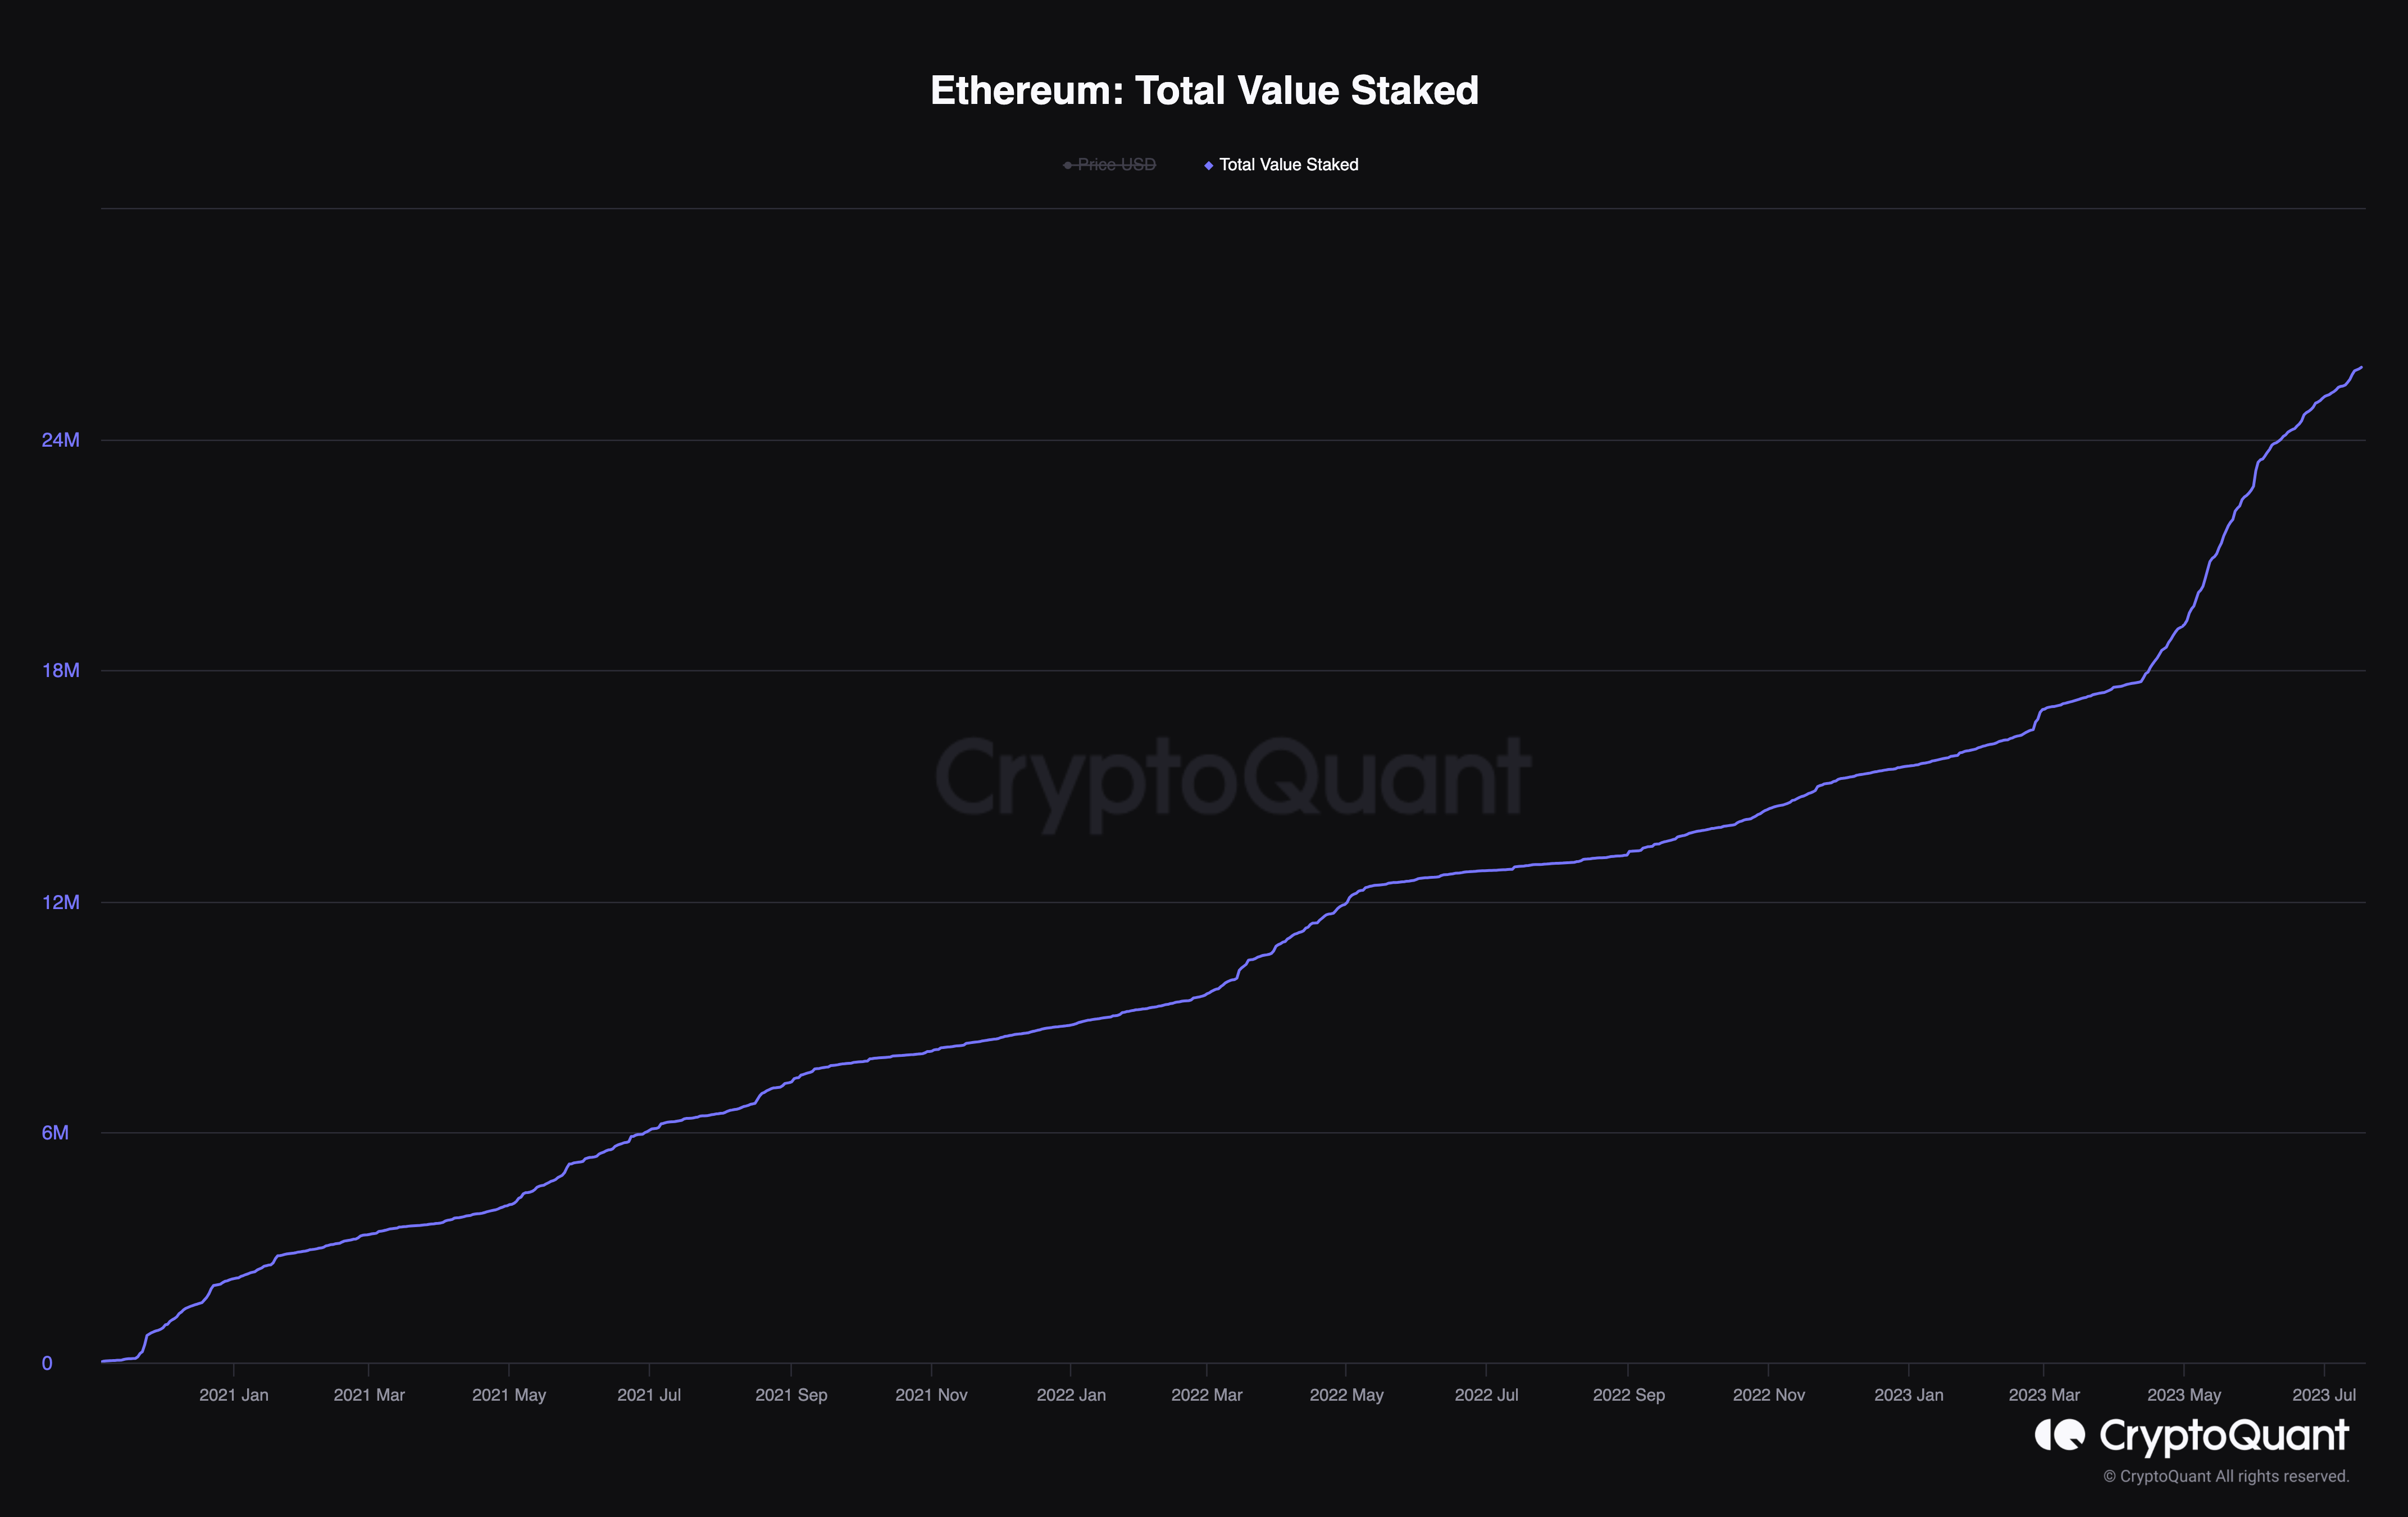
This Shapella upgrade, also known as Shanghai, allowed staked Ether to finally be sold, with some of the early stakers having locked up their tokens since Q4 of 2020. Despite concern that this would lead to a vast amount of Ether flooding the market and denting the price, the opposite has happened. With the indefinite lock-up restriction no longer a factor, the Ether staked has spiked noticeably, with the trend far steeper in the three months since.
But how has this structural break on the supply side affected Ether’s performance against Bitcoin? Less supply equals a higher price, right? Well, no actually. Almost on a dime from when the Merge went live, ETH has fallen relative to Bitcoin, as I have plotted on the below chart (the black line denotes the Merge in September).
The reason, of course, is that price is governed by supply and demand, rather than just supply. And while supply has contracted, the demand side of the equation has not held up – at least relative to Bitcoin.
Ether underperforms Bitcoin
Two months after the Merge, FTX collapsed, sending the entire crypto sector for a spin. As is customary in times of price decline, Bitcoin fell less than the rest of the market. Thus, Ether falling against Bitcoin in the aftermath of the crash is not surprising.
However, thus far in 2023, the crypto market has been on fire, with token prices accelerating across the board as the macro climate has softened amid falling inflation. The Nasdaq jumped 32% in the first six months of the year, its best half-year return since 1983. And yet, despite the crypto market riding this wave, Ether fell further still against Bitcoin, something which seemingly bucks the trend.
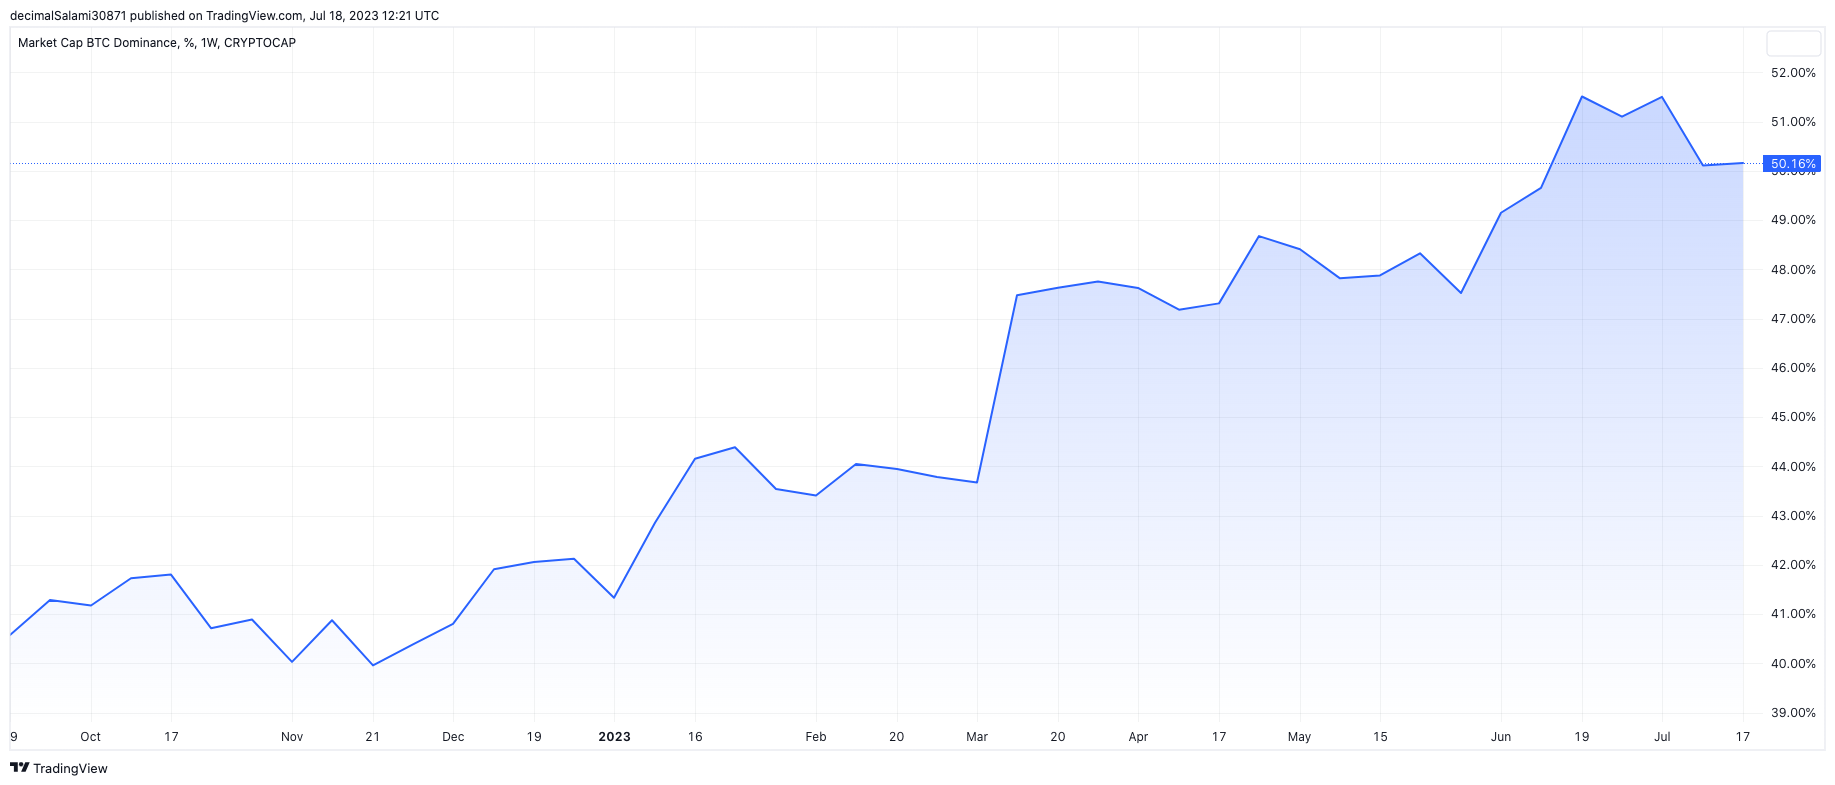
The reason is most likely regulation. The great regulatory crackdown in the US has been brutal on crypto, but Bitcoin has not been as squarely in the crosshairs as a lot of the market. This has led to Bitcoin dominance rising to its highest level in two years, now comprising over 50% of the entire cryptocurrency market cap. It opened the year at 42% (it was also roughly at this level at the time of the Ethereum Merge in September).
This comes amid sentiment that Bitcoin could be carving out its own niche in the space. This is the view that many in the space have long held (and a Bitcoin maximalist’s sworn mantra), but the difference now is that the law appears to be coming around to the same point of view. I’ll let Coinbase CEO Brian Armstong put it more succinctly than I:
“We go back to 2021, we wanted to become a public company, we described everything about our business, the assets that we list on our platform, how we do staking. The SEC at that point allowed us to become a public company”.
“A totally different tone started to happen (about a year ago),” Armstrong continued. “We kind of got this information from the SEC that, well actually everything other than Bitcoin is a security.”
Although Ether was not present on the list of tokens announced by the SEC that comprised securities, a list which included some other popular cryptos such as MATIC, SOL and ATOM, it has not been immune. Viewed more or less in a grey area, Ether nonetheless has suffered as the regulatory blows kept coming. While last week’s XRP ruling is positive for the space, and there will be many more twists and turns to come, it still feels like Bitcoin has separated itself from the crowd.
Further reinforcing this view is the slew of Bitcoin ETFs submitted for approval from some of the world’s biggest asset managers, including Blackrock. Denied repeatedly to date, the presence of big names backing Bitcoin amid this suffocating US legal environment is another boon for the orange coin. And while one could (rightly) hypothesise that a Bitcoin ETF would make an Ether ETF more likely, there is no denying that Bitcoin has pulled further ahead in the race.
This has led to a situation in 2023 where Bitcoin has outperformed Ether, which seems surprising when the latter has tended to outperform the former during prior periods of price expansion. But it is always important to remember how brief the trading history for both Ether and Bitcoin is. Ether was only launched in 2015, and it was another couple of years before it traded with any genuine liquidity. So, leaning on past performance must always be done with a pinch of salt. Additionally, the crypto market has never experienced a macro environment like this.
Finally, any hopes that the Merge would accelerate Ether into the stratosphere perhaps overlooked how much of the upgrade was priced in. This was in the works for a long time, repeatedly delayed before it finally came and went.
All in all, this has led to Ether lagging Bitcoin, with the latter increasing its dominance over not only Ether, but the crypto market as a whole. Things are changing quickly in crypto, and Bitcoin has been weathering the turbulent waters better than altcoins in recent months, primarily due to the legal climate.
Then again, the way prices have been going, Ether investors can’t be too unhappy – despite Ether’s second-place medal, it is still up 57% thus far this year. It could be worse, even if they did back the wrong horse.
Share this article
Categories
Tags