
Key Takeaways
- Bitcoin mining stocks have traded with significantly more volatility than Bitcoin itself
- Mining stocks have underperformed, as rising energy costs and increased competition has cut into profits
- Miners also overleveraged during the pandemic, purchasing new equipment with debt and holding onto Bitcoin stashes as prices fell
- Fees on the network rose with the Ordinals protocol and thus provided miners relief, but have since fallen back to normal levels
Anyone remotely interested in the cryptocurrency world will attest to the fact that Bitcoin is incredibly volatile. At one point in March 2020, it was $4,600. By November 2021, at the peak of the bull market pandemic, it hit $68,000. A year after that, it was back down to $15,500. And it is currently ticking along around the $27,000 mark.
As we said, volatile. And yet, there is something even more volatile: Bitcoin mining stocks.
First, a quick explainer into Bitcoin mining for the uninitiated. For those familiar with how the industry works, you can skip this little introduction.
Bitcoin miners are in the middle of what is a peculiar economic model. Miners act as “volunteers”, validating transactions on the Bitcoin blockchain. Because Bitcoin is a decentralised network, there is no central authority to maintain the blockchain, hence the need for these “volunteers” to validate transactions.
I put quotation marks around the word “volunteers” because miners get paid for their work, so don’t really have a claim to the volunteer title. Vitally, miner revenue comes in the form of Bitcoin. This revenue stream is split into two streams – the block reward subsidy, which halves every four years, and transaction fees.
The bottom line is that miners pay a cost to maintain the blockchain, in the form of energy/electricity, and receive revenue in return, in the form of Bitcoin.
Mining share price performance
Two things have been true about the performance of bitcoin mining stocks to date. The first is that they are extremely correlated with the price of Bitcoin itself. The second is that they have shown far greater volatility.
The Valkyrie Bitcoin Miners ETF is a good way to demonstrate the performance of mining stocks. It was launched in February 2022 and allocates at least 80% of holdings to companies which derive at least 50% of their revenue or profit from bitcoin mining operations.
Launched as the bear market started to engulf crypto, it has underperformed Bitcoin significantly, down 59% while Bitcoin is down 37% in the same timeframe. However, since the start of the year when markets have been a bit softer, it has outperformed: up 142% against Bitcoin’s rise of 62%.
Why have mining stocks suffered?
This has been the pattern that has consistently held: mining stocks almost trade like a levered bet on Bitcoin. Obviously, their entire business depends on the popularity of Bitcoin. Not only is their revenue literally denominated in it, but the more people use Bitcoin, the more transactions there are to be validated and the more lucrative mining is.
As a result, mining stocks have struggled immensely during the bear market. Despite rebounding this year as crypto markets have turned more optimistic in line with the macro climate and expectations around the future path of interest rates, mining stocks are still far below the prices at which they traded at 18 months ago.
There are a few reasons why the fall has been more than one would have perhaps expected. The first is resource management. Bitcoin miners get paid in Bitcoin, but they can sell their holdings if they wish. As prices surged during the pandemic, on-chain data shows that this did not occur. Instead, miners largely held onto their stash.
We looked at this in a recent piece, and the below chart presents this well. It displays a relatively constant pattern of miners offloading Bitcoins. However, the behaviour or speed of selling does not waver as Bitcoin’s price spikes immensely, rising from $5,000 in March 2020 to $68,000 in November 2021. This is seen by the huge uptick in miner reserves in USD terms, while there is no change to the trajectory of reserves in BTC terms.
In essence, it implies that miners did not monetise an increased amount of their Bitcoin as those Bitcoins appreciated in dollar terms. The more Bitcoin you hold, the more volatile your stock is going to be.
In retrospect, this seems a mistake. While miners were always going to struggle with the price of Bitcoin falling so violently, a refusal to diversify their holdings meant they were betting even heavier on Bitcoin’s price holding. That proved to be a bad bet.
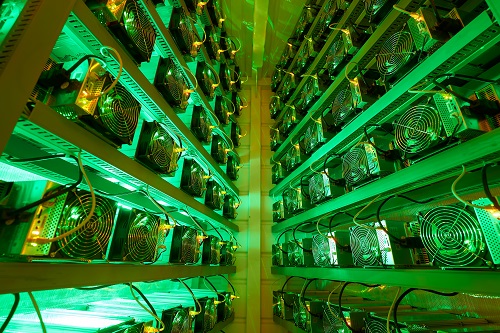
Bitcoin hash rate is at all-time highs
Not only did miners not sell much Bitcoin as it rose in price, but many invested in more equipment as mining revenues surged in line with the rocketing prices during COVID. Even worse, many miners also turned to debt to finance new equipment – equipment which was selling for bloated prices as more and more miners entered the game.
This equipment has since fallen in price, just as the Bitcoin price has. The below chart shows the growth in hash rate on the network – a measure of the total computing power mining Bitcoin. The rise has been incessant.
While greater hash power is excellent for Bitcoin overall and is vital for the security of the network, it does make things more challenging for miners. More hash power in essence means more competition.
Due to the wonderful kaleidoscope of incentives laid out by Satoshi Nakamoto in their Bitcoin whitepaper, this also means a difficulty adjustment will kick in – meaning the more miners on the network, the harder it is to mine Bitcoins. This is necessary in order to keep Bitcoin on track to hit its final supply of 21 million bitcoins in 2140. Otherwise, an increase in miners would validate transactions quicker and hence more Bitcoin would be released into circulation.
This sounds complicated, and the intricacies of it are. But the bottom line is that more hash power on the network means it requires more energy to mine Bitcoin – another thing which is eating into the bottom line of miners.
And what happened to energy costs over the last year? Surging inflation and the war in Ukraine has sent electricity prices aggressively upward. The below chart shows the movement in the US, the most popular mining destination.
This means that miners are getting double squeezed – on the revenue side, a falling Bitcoin price is obviously reducing their revenue, while on the cost side, the price of energy has also risen. Higher costs and falling revenue is…not good. And down goes the share price.
Are Bitcoin mining fees rising?
One point mentioned in crypto circles recently has been the increase of transaction fees on the Bitcoin network. As we covered recently, this can be attributed to increased activity on the network as a result of the Bitcoin Ordinals protocol. In other words, Bitcoin NFTs and memes, which exploded onto the scene in recent months.
The only issue is, this spike in fees proved to be brief. The below chart shows how the percentage of miner revenue derived from fees has fallen right back down to earth.
While the Ordinals protocol was certainly a bonus for miners, its effect has worn off and it appears unlikely to disrupt the age-old pattern: as the price of Bitcoin rises in bull markets, more people use the Bitcoin network, meaning more transaction fees. In bear markets, the opposite happens. This is what the below chart shows – the percent of miner revenue derived from fees tracks the Bitcoin price quite well (remember, the other part of revenue is the block subsidy award, which is pre-set and price agnostic, halving every four years).
Final thoughts
To wrap this mining report up, the reality is that miners will always suffer when the price of Bitcoin is falling, and outperform when it rises. This is because more people use Bitcoin when prices are rising, meaning more transactions and more revenue.
In the last year, miners have also been fighting a battle on the costs front, as inflation and an energy crisis have pumped the cost of electricity up, even if the worst of that may be in the rear window. Then there is the fact that many miners overleveraged themselves by purchasing more equipment at heightened prices on debt. Not to mention the decision by many to hold their revenue in Bitcoin rather than monetise into fiat.
Competition is now also fierce, input costs rising incessantly, the hash rate on the network near all-time highs. Put it this way: the days of college students mining on laptops are long gone.
All these factors have contributed to what has been an extremely challenging environment for miners over the past year. It also explains why mining stocks are even more volatile than one of the most volatile mainstream financial assets: Bitcoin itself.